- Bitcoin trades at $74,246 (-1.98% 24h), touching the 200-day MA that one analyst pre-identified as the correction's floor in September 2026
- Analyst flagged a "final pump before 2-month correction" on Sep 21; that exact sequence has now played out, with the MA touch confirmed on Nov 8
- Spot Bitcoin ETFs logged $411.9M in net outflows on the latest trading day, with $1.28B in net outflows across the past 5 sessions per SoSoValue
- Neckline/resistance on the Inverse H&S pattern remains unbroken — a confirmed daily close above it is the structural trigger for bull continuation
Bitcoin is trading at approximately $74,246 — down 1.98% over the past 24 hours, with a market cap of $1.49 trillion. The move brings Bitcoin precisely to the level that one analyst identified weeks ago as the correction’s floor: the 200-day moving average. The message from that analyst is direct — the two-month pullback is over, and this is the entry.
An analyst who goes by CryptoBullet1 on X flagged this setup in a November 8, 2026 daily chart update, writing: “So we reached the 200-Day MA as expected ✅ The 2-month correction is coming to an end. If you think we’re in a new Bull Market (which is very likely), then this dip is your chance to get in if the August pump caught you off guard.” The call is not reactive — it was pre-planned. A September 21, 2026 post from the same analyst had already called a “final pump before 2-month correction” after a higher high was printed. That sequence has now played out exactly as mapped.
The 200-Day MA — Why This Level Is Not Arbitrary
The 200-day moving average is the most widely tracked long-term trend indicator in traditional and crypto markets. It is calculated as the average closing price over the prior 200 daily sessions — making it a slow, smooth representation of the dominant trend. When an asset trades above it, the structure is broadly bullish. When an asset revisits it after a sustained rally, institutional buyers and long-term holders treat the level as a re-entry zone rather than a breakdown signal.
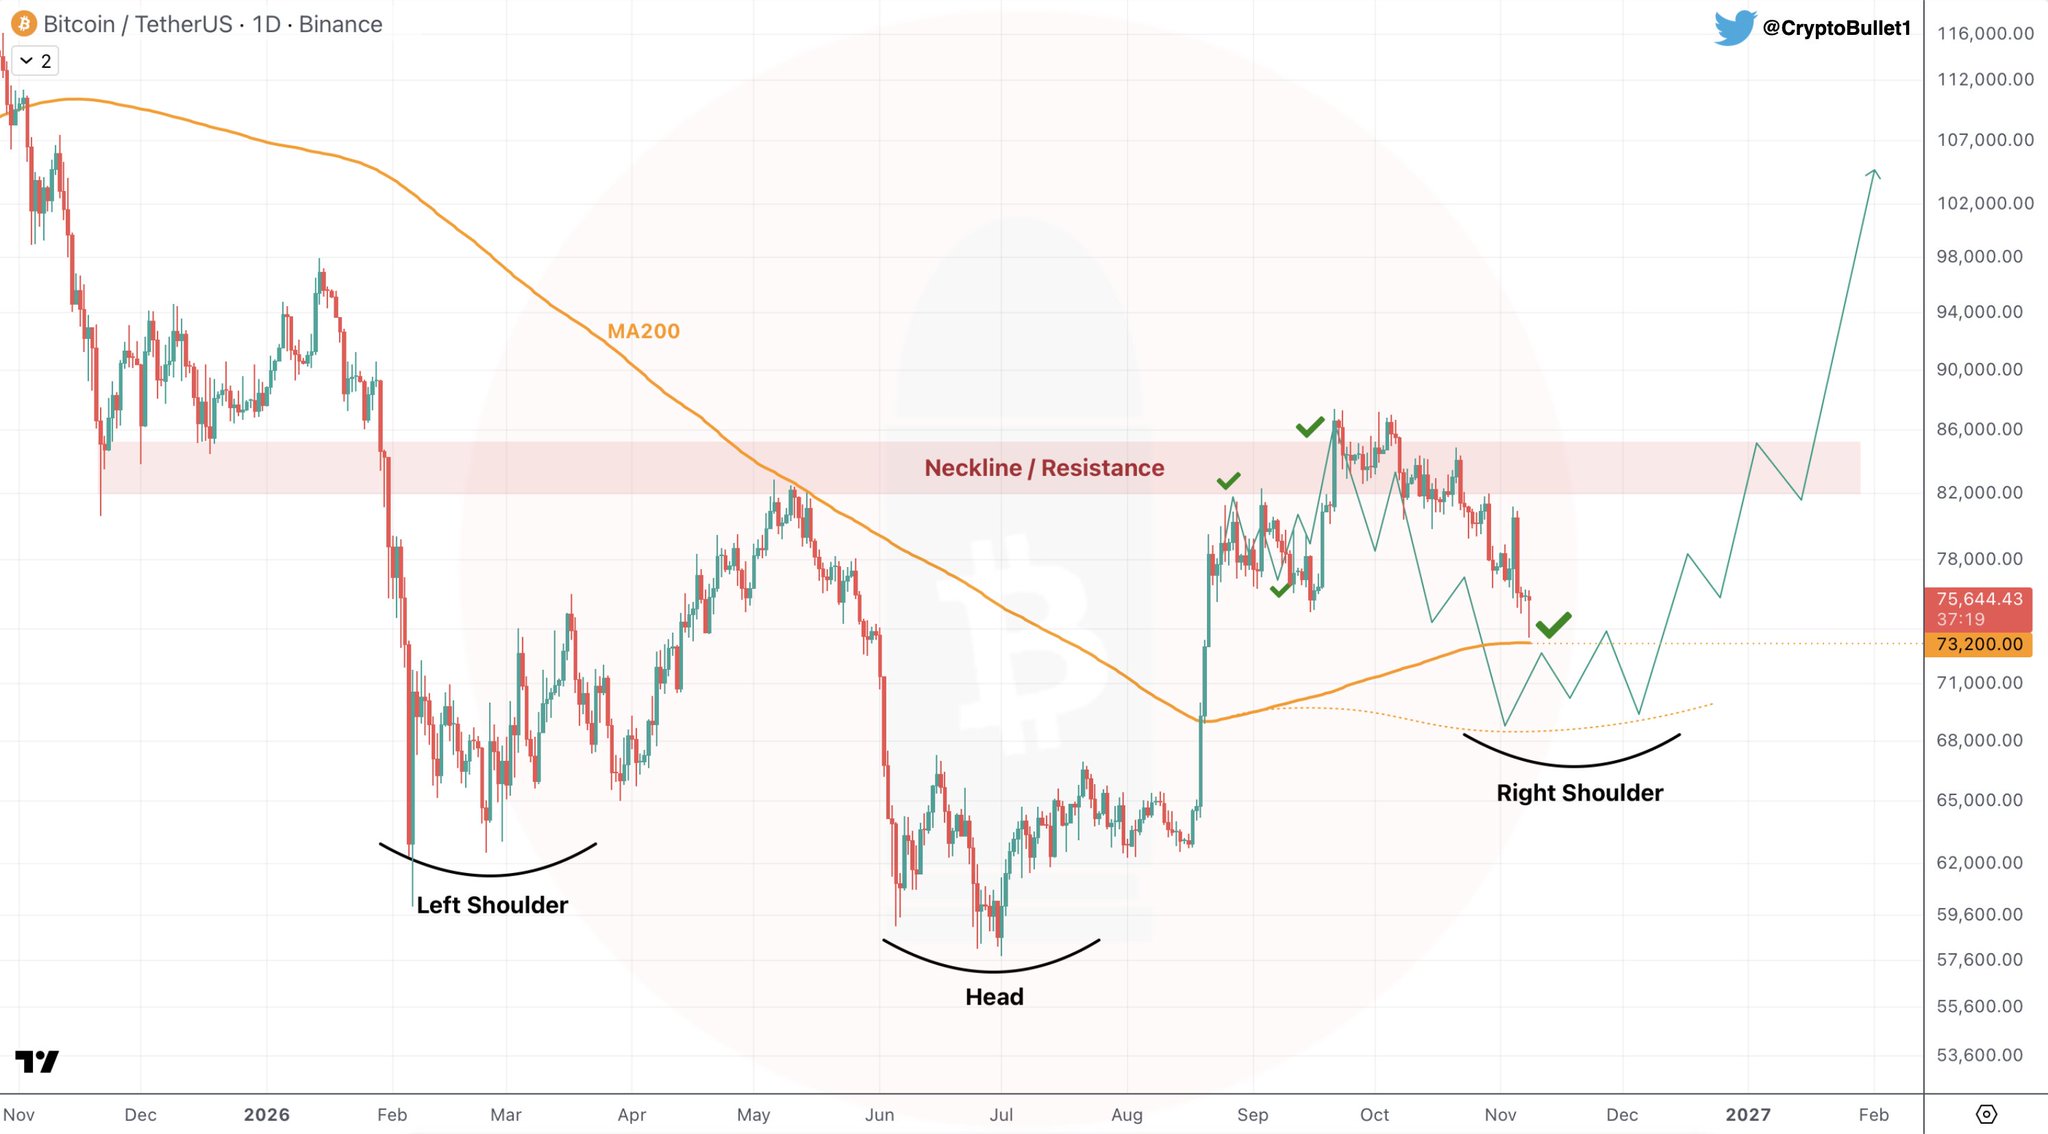
The chart shared by the analyst shows Bitcoin’s daily price action forming what appears to be an Inverse Head and Shoulders pattern — three rounded troughs with the middle trough deepest, flanked by shallower left and right shoulder structures. A horizontal neckline/resistance band sits above current price. The chart’s current price label reads $75,644 at chart time, with a secondary reference level at $73,200. The 200-day MA (displayed as an orange curve) intersects the current price action — confirming the analyst’s stated target has been reached. The pattern is still forming: price remains below the neckline, and no breakout has been confirmed. The projected upward move annotated on the chart represents a forward scenario, not a completed event.
The significance of the 200-day MA touch is mechanical, not emotional. Bitcoin’s correction from the August peak lasted approximately two months — a standard consolidation cycle in bull market structures. Each prior instance in this cycle where Bitcoin revisited the 200-day MA from above ultimately resolved with continuation of the broader uptrend, not reversal. The analyst’s framing aligns with that pattern: the dip is a retest, not a breakdown.
For further context on how Bitcoin has historically behaved at this moving average, see: Bitcoin Holds the 200-Day SMA — Is the Dip-Buying Window Closing? and Bitcoin Hits the EMA200 — Analyst’s Predicted Target Reached at $77,676.
ETF Flows Reflect the Tension — Not the Trend
Spot Bitcoin ETF data via SoSoValue adds an institutional dimension to this picture. The latest trading session logged a net outflow of $411.9M, with IBIT alone accounting for $403.0M in outflows. The past five trading days have seen a net $1.28B in outflows across four of five sessions. Total ETF net assets sit at $95.90B, against a cumulative net inflow since launch of $55.70B — the structural long position remains intact even as short-term flows turn negative.
This divergence — persistent institutional long exposure versus recent redemption pressure — is consistent with a correction phase rather than a macro reversal. Strategy (formerly MicroStrategy) reinforced that read, adding 811 BTC for $65.5M in its latest purchase and accumulating 1,328 BTC for $109.6M across the past three weeks. Total Strategy holdings now stand at 849,327 BTC as of November 2, 2026, per SoSoValue data.
The Macro Backdrop — Rate Hike Risk Is Real
One factor that complicates the clean bull market re-entry thesis is the FOMC rate outlook. Markets are currently pricing a 78.5% probability of a rate hike at the December 9, 2026 FOMC meeting — moving the federal funds rate from 3.75%–4.00% to 4.00%–4.25%, per SoSoValue data. For the January 27, 2027 meeting, cumulative tightening expectations reach 83.4% probability of at least one additional hike.
Rate hikes tighten financial conditions and historically compress risk asset multiples. If tightening expectations accelerate — particularly after the November 10 CPI and November 13 PPI releases — the 200-day MA could face a more sustained test rather than a brief touch-and-reverse. The analyst’s thesis is explicitly conditioned on the bull market framework remaining intact. Macro data this week will provide early evidence either way.
What the Setup Requires for Confirmation
The Inverse Head and Shoulders pattern flagged on the daily chart has a clear structural requirement: a confirmed breakout above the neckline/resistance zone. That has not happened yet. Price is below the neckline. The right shoulder appears to still be forming. The projected upside shown on the chart is conditional on that breakout completing with conviction.
What the 200-day MA touch confirms: the correction has reached the analyst’s pre-identified floor zone on schedule.
What it does not confirm: that the low is in. A second test of this zone, or a brief undercut to the $73,200 level visible on the chart, would not automatically invalidate the pattern — but a sustained daily close well below the 200-day MA would shift the structure materially. See also: Bitcoin Breaks Key Support — EMA200 Near $76K Now in Focus.
Bitcoin has arrived exactly where one analyst said it would, on a timeline that analyst pre-mapped in September. The 200-day MA is holding as a support reference. The Inverse Head and Shoulders pattern is intact but unconfirmed. ETF outflows of $1.28B over five days reflect the same uncertainty the chart does — sellers are active, but cumulative institutional exposure of $55.70B has not unwound. The neckline/resistance zone above current price is the level that separates a corrective dip from a confirmed resumption. Watch the neckline — a sustained daily close above it is the structural signal the bull market continuation thesis requires.
Frequently Asked Questions
What does the 200-day moving average signal for Bitcoin right now?
Is the Inverse Head and Shoulders pattern on Bitcoin’s daily chart confirmed?
How do the Bitcoin ETF outflows affect the bull market thesis?
What macro events could disrupt Bitcoin’s recovery from the 200-day MA?
Source: Cryptobullet1 · Published by CoinsProbe Markets Desk
The opinions and market insights shared on CoinsProbe represent the views of individual authors based on prevailing market conditions at the time of publication. Cryptocurrency investments carry significant risk and volatility. Readers are encouraged to conduct their own research and seek professional financial advice before making investment decisions. CoinsProbe and its contributors do not accept responsibility for financial losses or decisions made based on published content.
CoinsProbe may publish sponsored articles, affiliate links, or promotional collaborations. All sponsored material is clearly labeled to maintain transparency with our audience. Our editorial decisions remain fully independent, and advertising partnerships do not influence reviews, rankings, or published opinions.
Since 2023, CoinsProbe has delivered reliable insights on cryptocurrency, blockchain, and digital assets. Our content is created by experienced researchers and analysts who follow strict editorial standards focused on accuracy, transparency, and credibility. Every article is carefully reviewed and verified using trusted sources and current market data. We provide unbiased analysis and timely updates covering everything from emerging crypto projects to major industry developments.