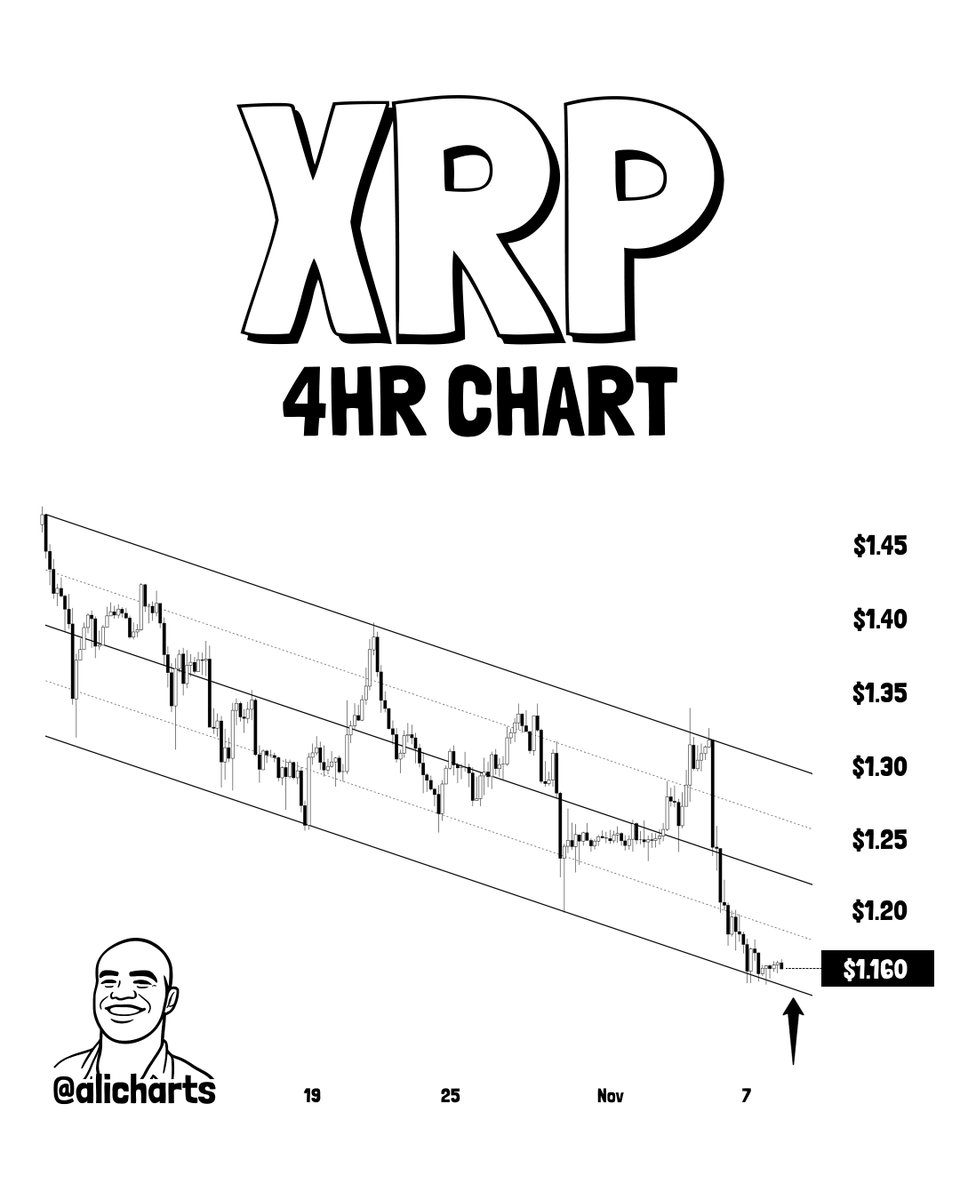
- XRP trades at $1.095, down 6.08% in 24 hours, touching the lower boundary of a one-month descending channel at $1.160
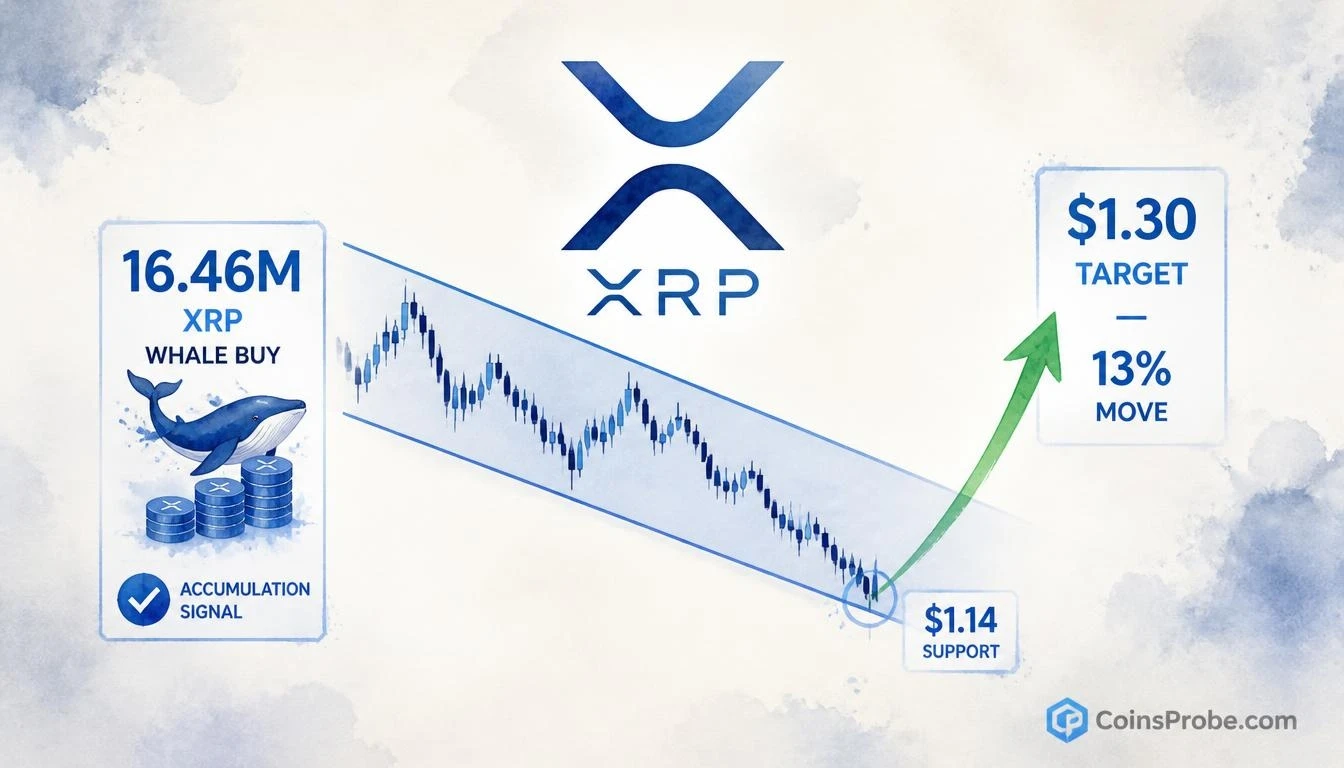
- Whales accumulated 16.46M XRP over 5 days as price fell from $1.34 to $1.15 — a bullish divergence
- Analyst targets $1.30 (13% from $1.14 support) if the $1.14 floor holds; a close below $1.14 invalidates the bounce thesis
XRP is trading at $1.095 — down 6.08% over the past 24 hours — with its market cap at $69.5 billion and 24-hour volume at $1.85 billion. Despite the decline, the asset has just reached a technically significant zone: the lower boundary of the descending parallel channel that has defined its price action over the past month. That contact, in isolation, is not a trade signal. Combined with simultaneous whale accumulation, it becomes a setup worth examining with precision.
An analyst identifying the setup notes that XRP has reached the lower boundary of this one-month descending channel. The stated thesis: if $1.14 holds as support, XRP could rebound toward the channel’s upper boundary at $1.30 — a potential 13% move from that support level. The chart shared by the analyst shows the lower channel trendline labeled at $1.160 on the 4-hour timeframe, with the analyst citing $1.14 as the critical support floor from the tweet text. Both figures matter here and must be read separately: $1.160 is the visual lower trendline contact on the chart; $1.14 is the analyst’s stated support threshold where the bounce thesis either holds or invalidates.
The Descending Channel — Structure and Current Position
A descending parallel channel is defined by two downward-sloping trendlines of equal gradient — an upper resistance line and a lower support line — containing price action between them. It is a pattern of sequential lower highs and lower lows, most commonly interpreted as a corrective structure within a broader trend. The critical inflection point in any channel is when price reaches either boundary: upper resistance typically triggers selling pressure; lower support typically precedes a bounce attempt back toward the midline or upper boundary.
The 4-hour chart covering approximately October 19 through November 7 shows XRP moving consistently lower within this channel. Price is currently at the lower trendline boundary — marked with an upward arrow at $1.160 on the chart. No confirmed breakdown below support has occurred. The pattern status is still forming, with price touching but not violating the lower channel support. The analyst’s stated floor of $1.14 sits approximately 2% below the current chart contact point, providing a defined invalidation zone: a sustained close below $1.14 would constitute a channel breakdown rather than a bounce.
Whale Accumulation — 16.46 Million XRP While Price Fell
The chart pattern does not exist in a vacuum. Quoted data in the original post flags a material divergence: whales accumulated more than 16.46 million XRP over the past five days while price fell from $1.34 to $1.15. That is a classic bearish-price / bullish-flow divergence — the type of setup where large holders absorb selling pressure from retail participants who interpret falling prices as a reason to exit.
The significance of this divergence is structural. When price declines and large wallets accumulate, the marginal seller is typically a smaller participant, while the marginal buyer is an entity with a longer time horizon. Whether that thesis plays out depends entirely on whether the $1.14 support level holds under continued selling pressure. The accumulation data alone does not guarantee a bounce — it confirms that well-capitalized participants are positioning as though one is likely.
This pattern of smart-money accumulation beneath surface-level weakness is not unique to XRP. Similar divergences have preceded bounces in other assets during corrective phases — for context on how whale behavior has historically resolved in crypto markets, see the analysis of Chainlink’s 18-day Binance outflow streak, where on-chain conviction persisted beneath price weakness before a directional resolution.
XRP Spot ETF Context
Institutional flow data via SoSoValue adds a nuanced layer. As of November 6, XRP spot ETFs posted zero daily net inflow on the most recent trading date, with cumulative net inflows since launch at $1.81 billion against total net assets of $1.34 billion. The past five trading days saw net outflows of $530,000 — five consecutive outflow days — though the current streak is recorded as four consecutive inflow days, suggesting a recent shift. Daily trading volume sits at $22.0 million. The ETF flow picture is mixed: cumulative inflows confirm sustained institutional interest since launch, but the near-term outflow trend is consistent with the broader price weakness XRP has experienced over the past month. A bounce from channel support, if confirmed, would likely need to coincide with a return of ETF inflow momentum to signal genuine institutional re-engagement at this level.
Macro Calendar — CPI and PPI This Week
Timing matters. CPI data is due November 10 and PPI on November 13 — both within the immediate bounce window the analyst is watching. If inflation data prints hotter than expected, risk assets including XRP face additional downward pressure that could test the $1.14 support with more force. If CPI and PPI come in at or below consensus, the macro backdrop becomes more supportive of a risk-asset recovery. The bounce setup the analyst identifies is technically valid — but macro data this week creates a binary overlay that traders cannot ignore. Bitcoin’s Fear & Greed index has already registered elevated stress following recent market events — a macro shock this week would amplify that pressure across altcoins.
The Levels That Define This Setup
Two numbers govern the entire thesis. First: $1.14 — the analyst’s stated support floor. A sustained hold above this level is the prerequisite for any bounce attempt. Second: $1.30 — the upper boundary of the descending channel and the stated target. The 13% figure the analyst cites is the distance from $1.14 to $1.30, not from the current price of $1.095. From current levels, the move to $1.30 would represent approximately 18.7%. Neither number is a guarantee — they are the coordinates of the setup as the analyst has drawn it.
The pattern is still forming. At $1.095, XRP is already trading below the chart’s lower trendline contact at $1.160, pressing toward the analyst’s stated $1.14 support. That compression means the setup is in its most critical phase right now. A close below $1.14 on the 4-hour timeframe would invalidate the channel bounce thesis and open the next leg lower. A hold and reversal above $1.14 sets the stage for the 13% move the analyst has mapped.
#### Bullish ScenarioXRP holds $1.14 as support and reverses higher. Price reclaims the channel midline and advances toward the upper channel boundary at $1.30 — a 13% move from support (approximately 18.7% from current $1.095). Bullish confirmation strengthens if XRP spot ETF inflows return alongside the technical bounce.
#### Bearish ScenarioA sustained 4-hour close below $1.14 constitutes a channel breakdown. In that case, the lower boundary is no longer support, and the next meaningful level would need to be identified from a wider timeframe chart. The whale accumulation thesis also weakens materially if price continues lower despite documented buying in the $1.15–$1.34 zone.
The setup is defined. $1.14 is the line the analyst is watching — a hold opens $1.30, a loss breaks the structure. CPI on November 10 and PPI on November 13 are the macro events most likely to determine which side resolves first.
Source: x.comFrequently Asked Questions
What is the significance of XRP touching the lower boundary of the descending channel?
Why are whales buying XRP while the price is falling?
What would invalidate the XRP bounce thesis?
How do the upcoming CPI and PPI releases affect the XRP setup?
Source: Ali Charts · Published by CoinsProbe Markets Desk
The opinions and market insights shared on CoinsProbe represent the views of individual authors based on prevailing market conditions at the time of publication. Cryptocurrency investments carry significant risk and volatility. Readers are encouraged to conduct their own research and seek professional financial advice before making investment decisions. CoinsProbe and its contributors do not accept responsibility for financial losses or decisions made based on published content.
CoinsProbe may publish sponsored articles, affiliate links, or promotional collaborations. All sponsored material is clearly labeled to maintain transparency with our audience. Our editorial decisions remain fully independent, and advertising partnerships do not influence reviews, rankings, or published opinions.
Since 2023, CoinsProbe has delivered reliable insights on cryptocurrency, blockchain, and digital assets. Our content is created by experienced researchers and analysts who follow strict editorial standards focused on accuracy, transparency, and credibility. Every article is carefully reviewed and verified using trusted sources and current market data. We provide unbiased analysis and timely updates covering everything from emerging crypto projects to major industry developments.