
- BTC is trading at $78,296 (+2.20% 24h) — the only midterm cycle to enter the vote with a gain (+20.4% in prior 3 months)
- All three prior post-midterm cycles closed higher 12 months later: +36.8% (2014), +45.8% (2018), +80.8% (2022) — per CryptoQuant
- Post-vote interim drawdowns reached −49.7% (2018) and −39.8% (2014) before 12-month gains materialized
- Spot BTC ETFs saw $115.6M net outflow on Nov 3 (IBIT: −$95.0M) with 3 consecutive outflow days per SoSoValue
Bitcoin is trading at $78,296 — up 2.20% in the past 24 hours — as a CryptoQuant analysis published November 3, 2026, frames the current moment as a historically anomalous one. In every prior U.S. midterm election year since 2010, Bitcoin declined in the three months leading into the vote. In 2026, it rose. That inversion is the core of what CryptoQuant’s research team is now examining.
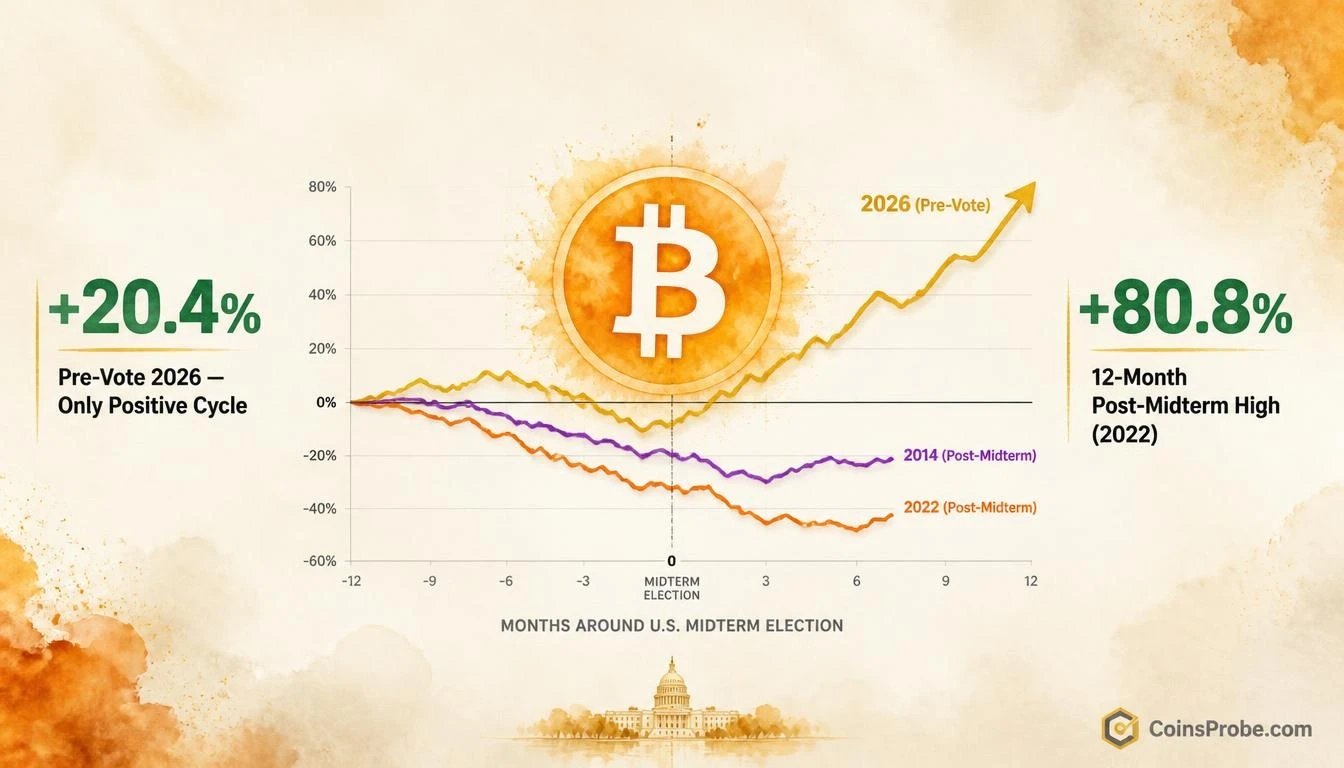
An analyst at CryptoQuant (@cryptoquant_com) published a seven-post thread on November 3, 2026, noting that Bitcoin sits at the same halving-cycle position as it did before the 2014, 2018, and 2022 midterms — approximately 17 months before the next scheduled halving. The difference this time: BTC entered the vote up +20.4% over the prior three months. The same window saw −44% (2014), −8.3% (2018), and −16.5% (2022). The analyst’s framing is deliberate: this is not primarily an election story. It is a halving-cycle story.
Signal 1 — The Pre-Vote Performance Inversion
Three months before each of the last three midterm elections, Bitcoin was under sustained selling pressure. In 2014, the drawdown was −44% heading into the vote — a cycle still in the shadow of the Mt. Gox collapse. In 2018, it fell −8.3% as the market digested the aftermath of the ICO bubble. In 2022, the FTX implosion drove a −16.5% decline in the final quarter before the election. Each time, Bitcoin entered the midterm period already wounded.
In 2026, the same pre-vote window produced a +20.4% gain. The divergence is not marginal. The 2026 line on CryptoQuant’s comparative chart rises sharply from the shared starting cluster near the left of the chart — above all prior cycle lines, above the zero baseline — and terminates at day 0 (election day) well above every historical analog. Per the chart analysis, the 2026 trajectory represents a confirmed departure from every prior midterm pattern at the terminal data point.
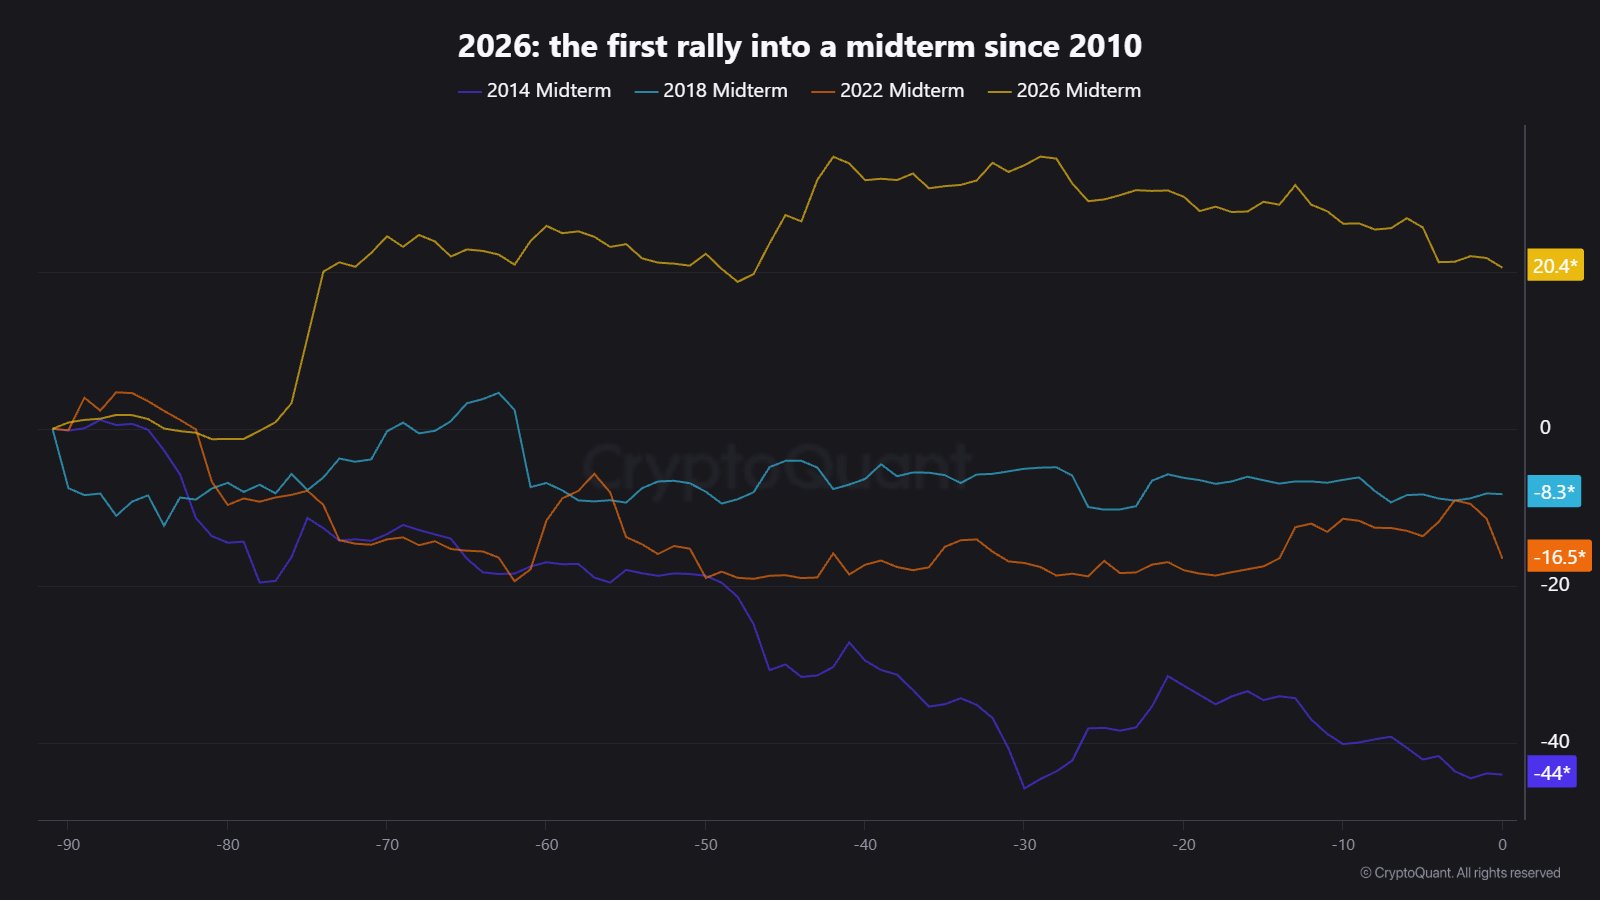
The significance of this inversion runs in both directions. If the prior cycles saw post-vote volatility partly because Bitcoin was already in drawdown, the 2026 entry point is structurally different — elevated. That could mean post-vote resilience. It could equally mean a larger surface area for a correction if sentiment turns. CryptoQuant’s note is careful not to resolve this tension into a price call. The pre-vote performance data is a descriptor, not a forecast.
Signal 2 — 4/4 Post-Midterm Gains, Party Control Irrelevant
The more consistent data point is what happens after the vote. In each of the four measurable midterm cycles, Bitcoin closed higher twelve months later — regardless of which party gained or lost congressional control.
| Midterm Year | Congressional Outcome | 12-Month BTC Return |
|---|---|---|
| 2014 | House R held, Senate D→R | +36.8% |
| 2018 | House R→D, Senate R held | +45.8% |
| 2022 | House D→R, Senate D held | +80.8% |
| 2026 | Pending | Pending |
Post-midterm 12-month BTC returns | Source: @cryptoquant_com (X)
The median 12-month return across the three completed cycles is +45.8%. The minimum was +36.8%. These are large numbers — but CryptoQuant’s analyst is explicit about the sample size caveat: n=4 is tiny. Bitcoin was also higher a year later on most days regardless of election timing. The pattern may be entirely attributable to halving-cycle positioning rather than the election calendar itself, which is precisely how CryptoQuant frames it.
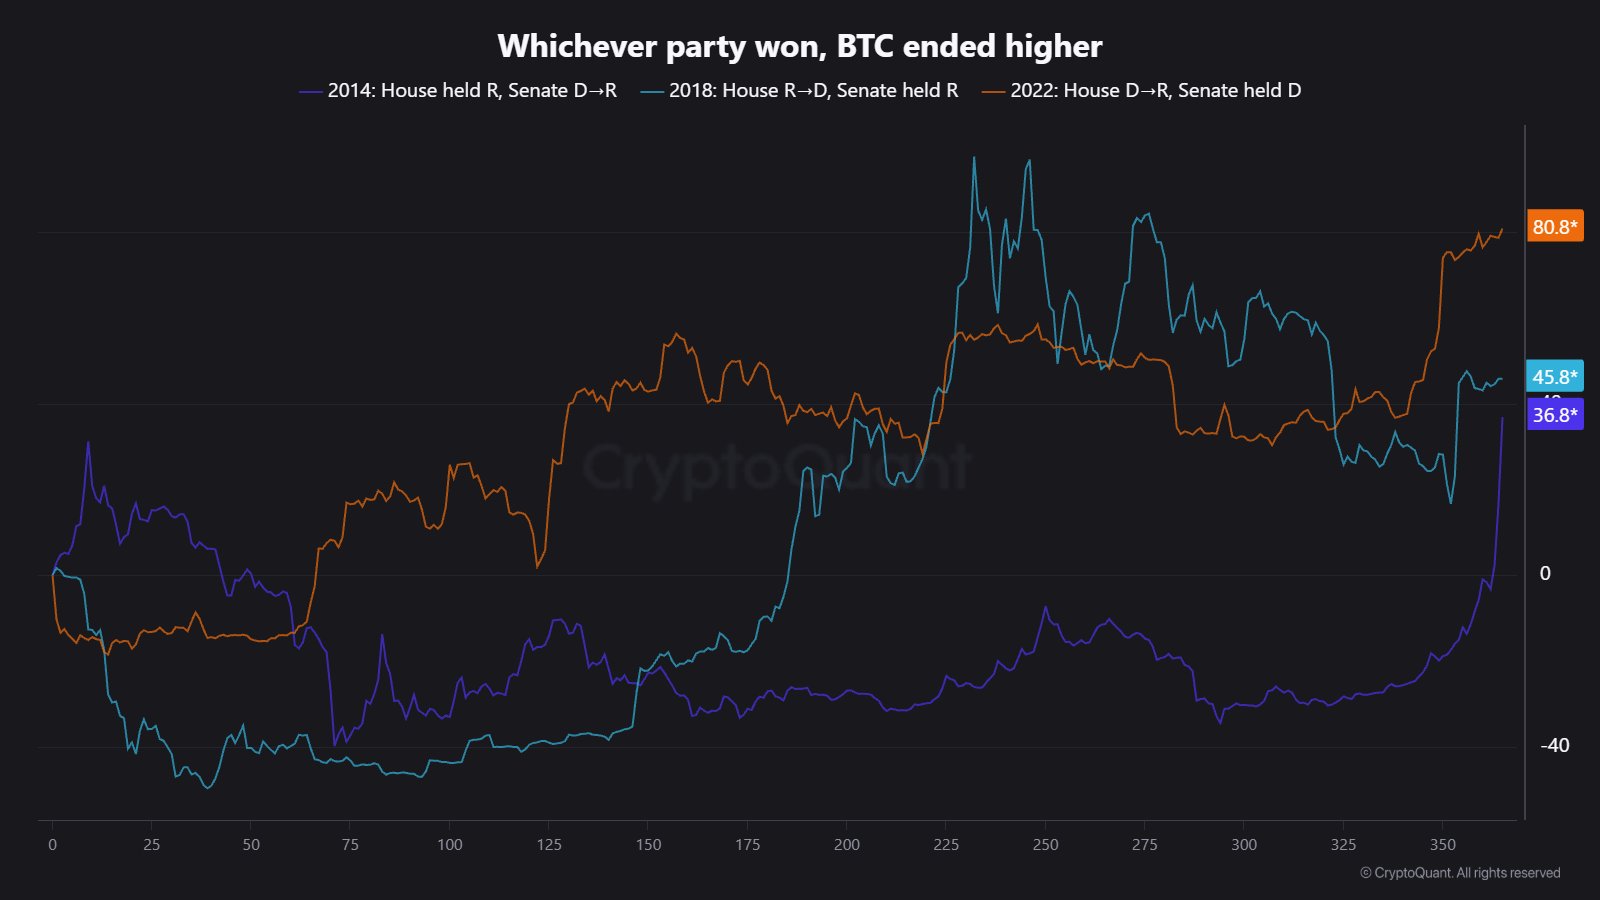
The post-vote charts from CryptoQuant show that the path to those annual gains was not linear. In 2018, BTC fell −49.7% within roughly six weeks of the midterm vote before recovering to close the year-long window up +45.8%. In 2014, the drawdown reached −39.8% within ten weeks. In 2022, −18.5% within two weeks. In other words, the 12-month return was real — but so was the interim pain. Investors who exited into those post-vote drawdowns did not capture the eventual gain.
The Halving Cycle Reframe — Why CryptoQuant Calls This a Structural Question
CryptoQuant’s thread explicitly repositions the midterm analysis as a halving-cycle phenomenon. All four midterm years — 2014, 2018, 2022, and 2026 — occur at approximately the same point in the four-year halving schedule: roughly 17 months before the next supply reduction event. The correlation between midterms and BTC performance may therefore be an artifact of this alignment rather than any genuine connection to U.S. political outcomes.
The implication the analyst draws is structural: if the four-year halving cycle weakens or loses its historical relevance as the percentage of newly minted supply shrinks with each halving, the midterm pattern weakens with it. CryptoQuant uses the 2026 anomaly — the first pre-vote gain in the dataset — as a potential early signal that the cycle’s influence on price behavior may already be evolving. That is a caveat the analyst includes explicitly, not a conclusion — but it is not a minor footnote. It is the article’s organizing question.
This matters for how the post-vote outcome is interpreted. If Bitcoin closes higher twelve months from now, it will be tempting to credit the midterm pattern. CryptoQuant’s framing suggests the right attribution may be the halving cycle converging with 2026’s particular macro context — not the election itself. As a point of institutional context, spot Bitcoin ETFs recorded a daily net outflow of $115.6M on November 3, with IBIT alone accounting for $95.0M of that outflow, per data via SoSoValue. Total ETF net assets remain at $99.16B with cumulative inflows of $56.47B since launch, suggesting institutional positioning remains substantial despite near-term outflow pressure.
Macro context adds another layer of complexity. Markets are currently pricing a 77.2% probability of a rate hike at the December 9, 2026 FOMC meeting — a tightening signal that has historically weighed on risk assets. CPI data drops November 9, with PPI following on November 12, per upcoming macro events tracked via FRED. These releases will shape the near-term environment Bitcoin navigates as the post-midterm window opens. For context on the broader risk environment this cycle, crypto losses hit $9B in 2026 across 750 incidents — a structural risk factor that did not exist at this scale in prior midterm cycles.
What the Data Confirms — And What It Doesn’t
What the 4/4 post-midterm record confirms: Bitcoin has ended higher twelve months after every measured midterm election year. The minimum return in that window is +36.8%. Party control of Congress has shown zero predictive value for the direction of that return.
What it does not confirm: the path to those returns was smooth, the magnitude in 2026 will resemble prior cycles, or that the halving cycle will continue to function as a primary price driver. CryptoQuant’s analyst states directly that n=4 is too small for high-confidence statistical inference, and that Bitcoin was higher a year later on most days regardless of election timing — which dilutes the apparent edge of the midterm signal itself.
What to watch for continuation: whether Bitcoin sustains its current level or traces the post-vote drawdown pattern seen in 2018 (−49.7%) and 2014 (−39.8%) before the annual window closes. Those drawdowns were real and deep. The eventual 12-month gains did not negate them — they followed them. Strategy (MSTR) holds 849,327 BTC as of November 2, 2026, and acquired 811 BTC for $65.5M most recently — a data point suggesting at least one institutional accumulator is not exiting into the post-election period. ETH, SOL, and ADA have also recently flashed TD Sequential buy signals on 3-day charts, suggesting broader market exhaustion signals are present simultaneously.
Bitcoin at $78,296 enters the post-midterm window in a structurally unique position: the only cycle in the dataset where it arrived at the vote with a gain. Whether that inversion is a bullish structural shift or simply a larger setup for the interim drawdown that preceded every prior 12-month recovery is the question the next six weeks will begin to answer. CryptoQuant identifies no price levels or targets — the analysis is calendar and cycle-based, not level-based. The number to track is not a price. It is the 12-month close from election day.
Source: x.comFrequently Asked Questions
What happened to Bitcoin after every U.S. midterm election historically?
Why did Bitcoin fall sharply after some midterms even though it ended higher a year later?
Is Bitcoin’s post-midterm pattern driven by elections or the halving cycle?
What makes 2026 different from every prior midterm cycle for Bitcoin?
Source: CryptoQuant · Published by CoinsProbe Markets Desk
The opinions and market insights shared on CoinsProbe represent the views of individual authors based on prevailing market conditions at the time of publication. Cryptocurrency investments carry significant risk and volatility. Readers are encouraged to conduct their own research and seek professional financial advice before making investment decisions. CoinsProbe and its contributors do not accept responsibility for financial losses or decisions made based on published content.
CoinsProbe may publish sponsored articles, affiliate links, or promotional collaborations. All sponsored material is clearly labeled to maintain transparency with our audience. Our editorial decisions remain fully independent, and advertising partnerships do not influence reviews, rankings, or published opinions.
Since 2023, CoinsProbe has delivered reliable insights on cryptocurrency, blockchain, and digital assets. Our content is created by experienced researchers and analysts who follow strict editorial standards focused on accuracy, transparency, and credibility. Every article is carefully reviewed and verified using trusted sources and current market data. We provide unbiased analysis and timely updates covering everything from emerging crypto projects to major industry developments.