
- BTC supply velocity collapses to 1.97 — lowest recorded level in over a decade, per Alphractal analysis dated November 7, 2026
- 20.11 million BTC already mined — 95.76% of the 21M hard cap — as circulating supply approaches its mathematical ceiling
- ETH supply velocity at 6.88 remains well above BTC's floor but far below prior cycle peaks of ~15.26, with supply growth structurally stalled post-Merge at 122.19M ETH
- Bitcoin spot ETFs logged $411.9M in daily outflows on Nov 6 with $1.28B outflow over 5 days, per SoSoValue — a near-term headwind against the structural accumulation signal
Bitcoin is trading at $76,004 — down 0.12% in the last 24 hours — with a market cap of $1.53 trillion. Beneath that price action sits a structural signal that has preceded every major Bitcoin price appreciation cycle: supply velocity has collapsed to 1.97, its lowest recorded level in over a decade, meaning Bitcoin is being HODLed at a historically extreme rate and is effectively being removed from active circulation.
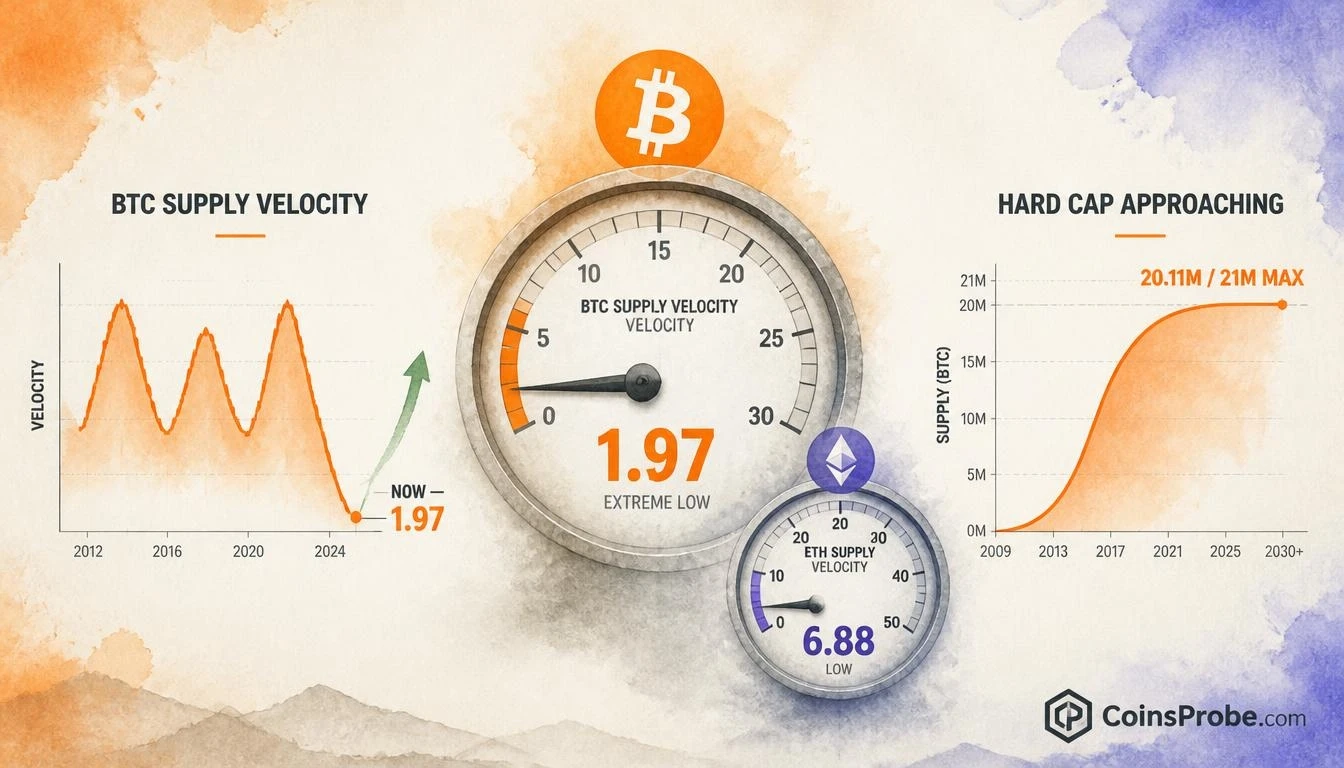
Analysts at Alphractal published a comparative analysis of BTC and ETH supply and circulation dynamics, flagging that BTC’s 1-Year Supply Velocity has collapsed to 1.97 — a reading that places current HODLing behavior in the same category as the deepest accumulation troughs preceding prior cycle peaks. Simultaneously, 20.11 million BTC have already been mined, pushing circulating supply to 95.76% of the 21 million hard cap. The two data points together — near-maximum supply issuance and near-minimum velocity — present a structural picture that is historically unusual.
Signal 1 — BTC 1-Year Supply Velocity: 1.97, A Multi-Decade Low
Supply velocity measures how actively the existing supply of an asset is circulating. Specifically, the 1-Year Supply Velocity divides the volume of coins that have moved on-chain within the past year by the total current supply — producing a ratio that shows what fraction of the supply is actively changing hands versus sitting dormant in long-term holder wallets. A declining velocity means holders are refusing to sell. A reading near zero means the network’s coins are, for practical purposes, locked away.
At 1.97, Bitcoin’s supply velocity has reached its lowest level in over a decade. The Alphractal chart covering approximately 2010 to November 2026 shows three distinct bell-curve peaks in velocity: one around 2011, one around 2017, and one around 2021 — each declining in height relative to the last. What follows each peak is a deep trough, and it is in those troughs — when velocity is at its most suppressed — that price appreciation has historically been most acute. The current reading of 1.97 sits at the bottom of the deepest, most prolonged trough in Bitcoin’s recorded history.
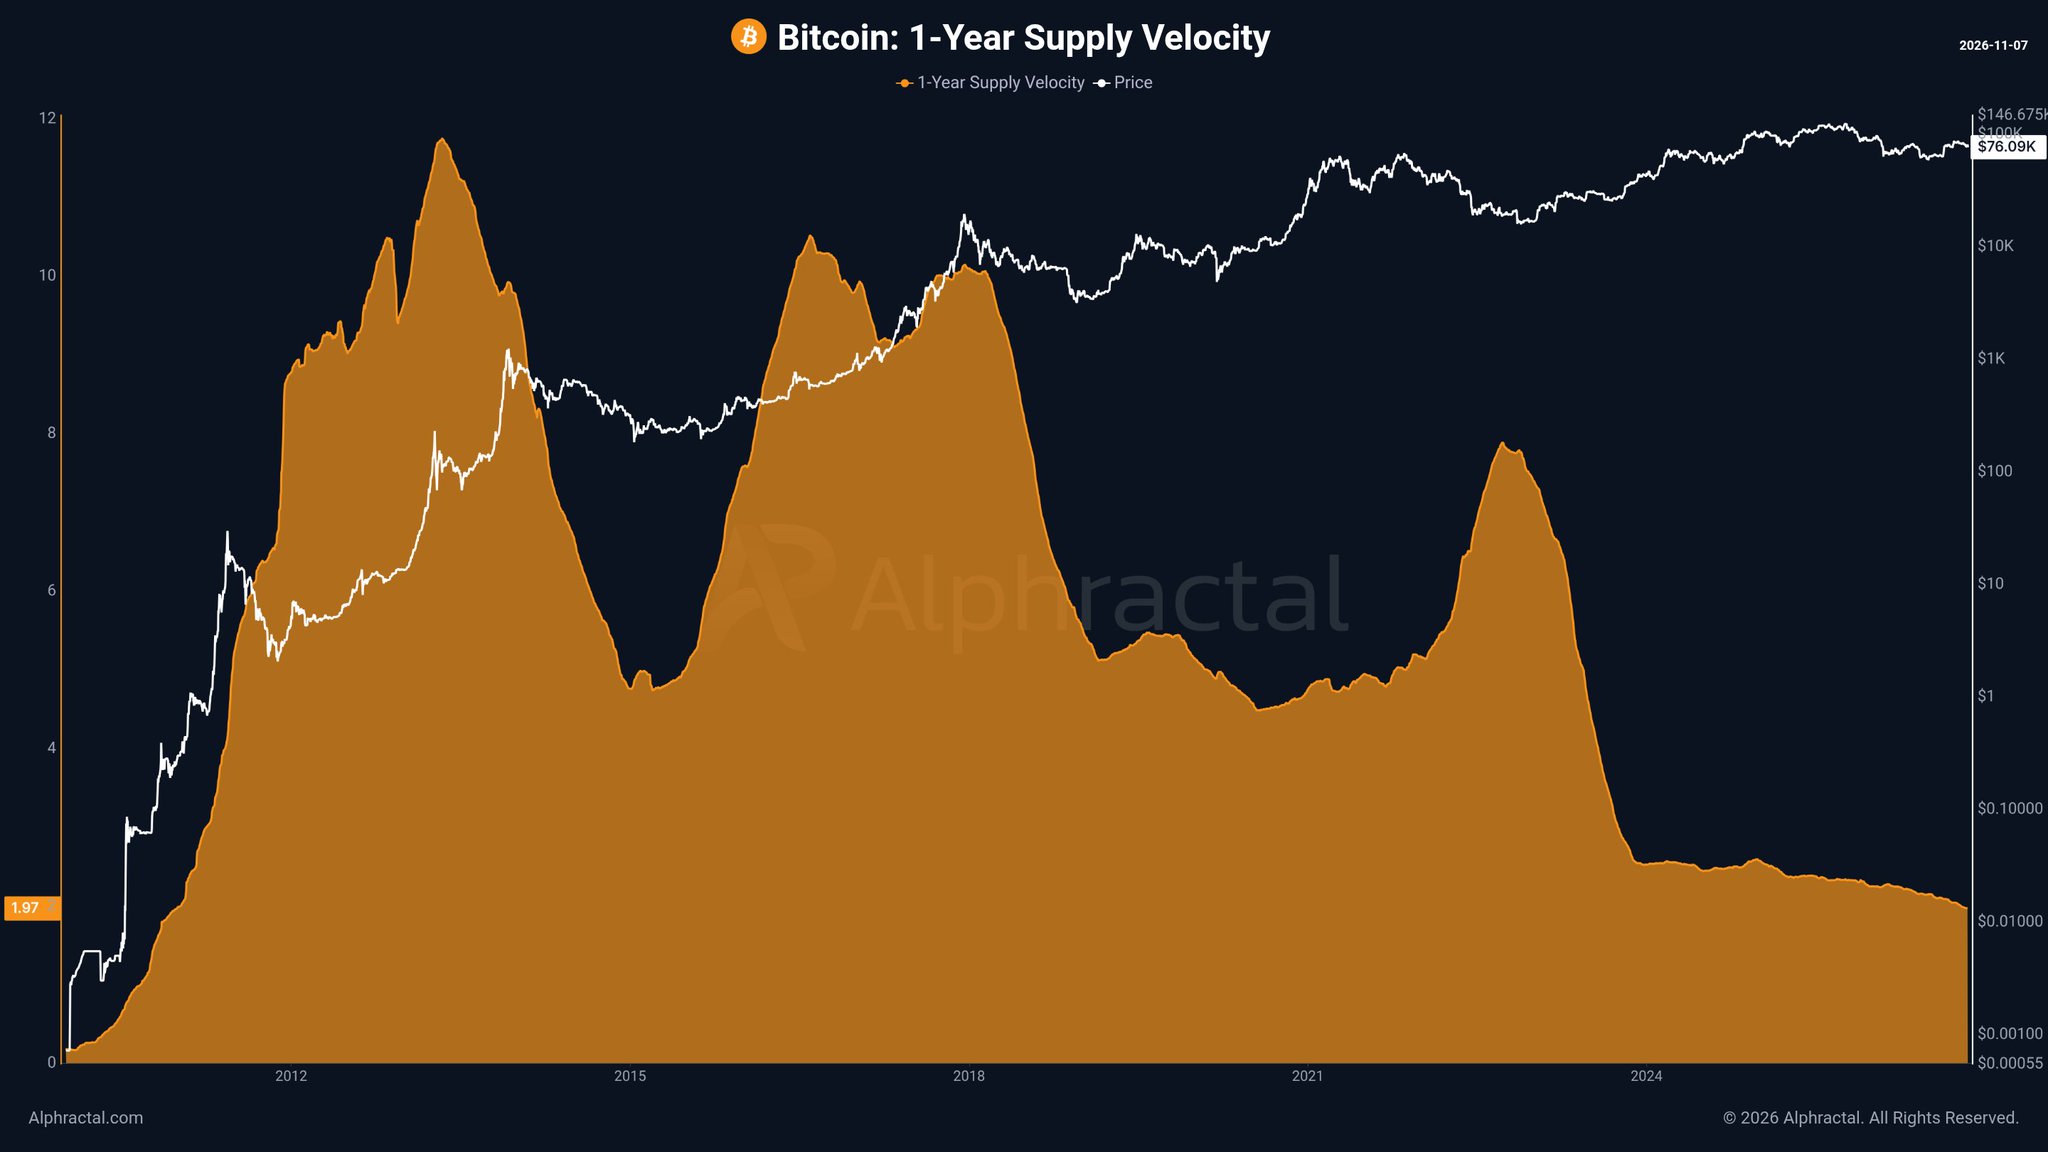
The mechanism is straightforward: when long-term holders are not selling, the available float for buyers shrinks. Any demand — whether from spot ETF inflows, institutional buyers, or retail accumulation — must be absorbed by a smaller pool of willing sellers. This supply constraint, when it coincides with any demand catalyst, produces outsized price moves. The velocity chart does not predict when demand arrives. It quantifies how tight the supply side has become.
Signal 2 — ETH Supply Velocity: Structurally Different Dynamics
Ethereum’s supply velocity tells a different story — not worse, but structurally distinct. The ETH velocity chart covering 2017 to 2026 shows a current reading of 6.88, well above Bitcoin’s 1.97 but historically suppressed relative to ETH’s own prior cycle peaks of approximately 15.26 (the recorded high) and double-digit readings during the 2018 and 2021–2022 peaks. The pattern shows two large mountain peaks in velocity followed by a prolonged trough through 2023–2024, then a modest partial recovery forming a smaller, lower hill shape through 2025–2026.
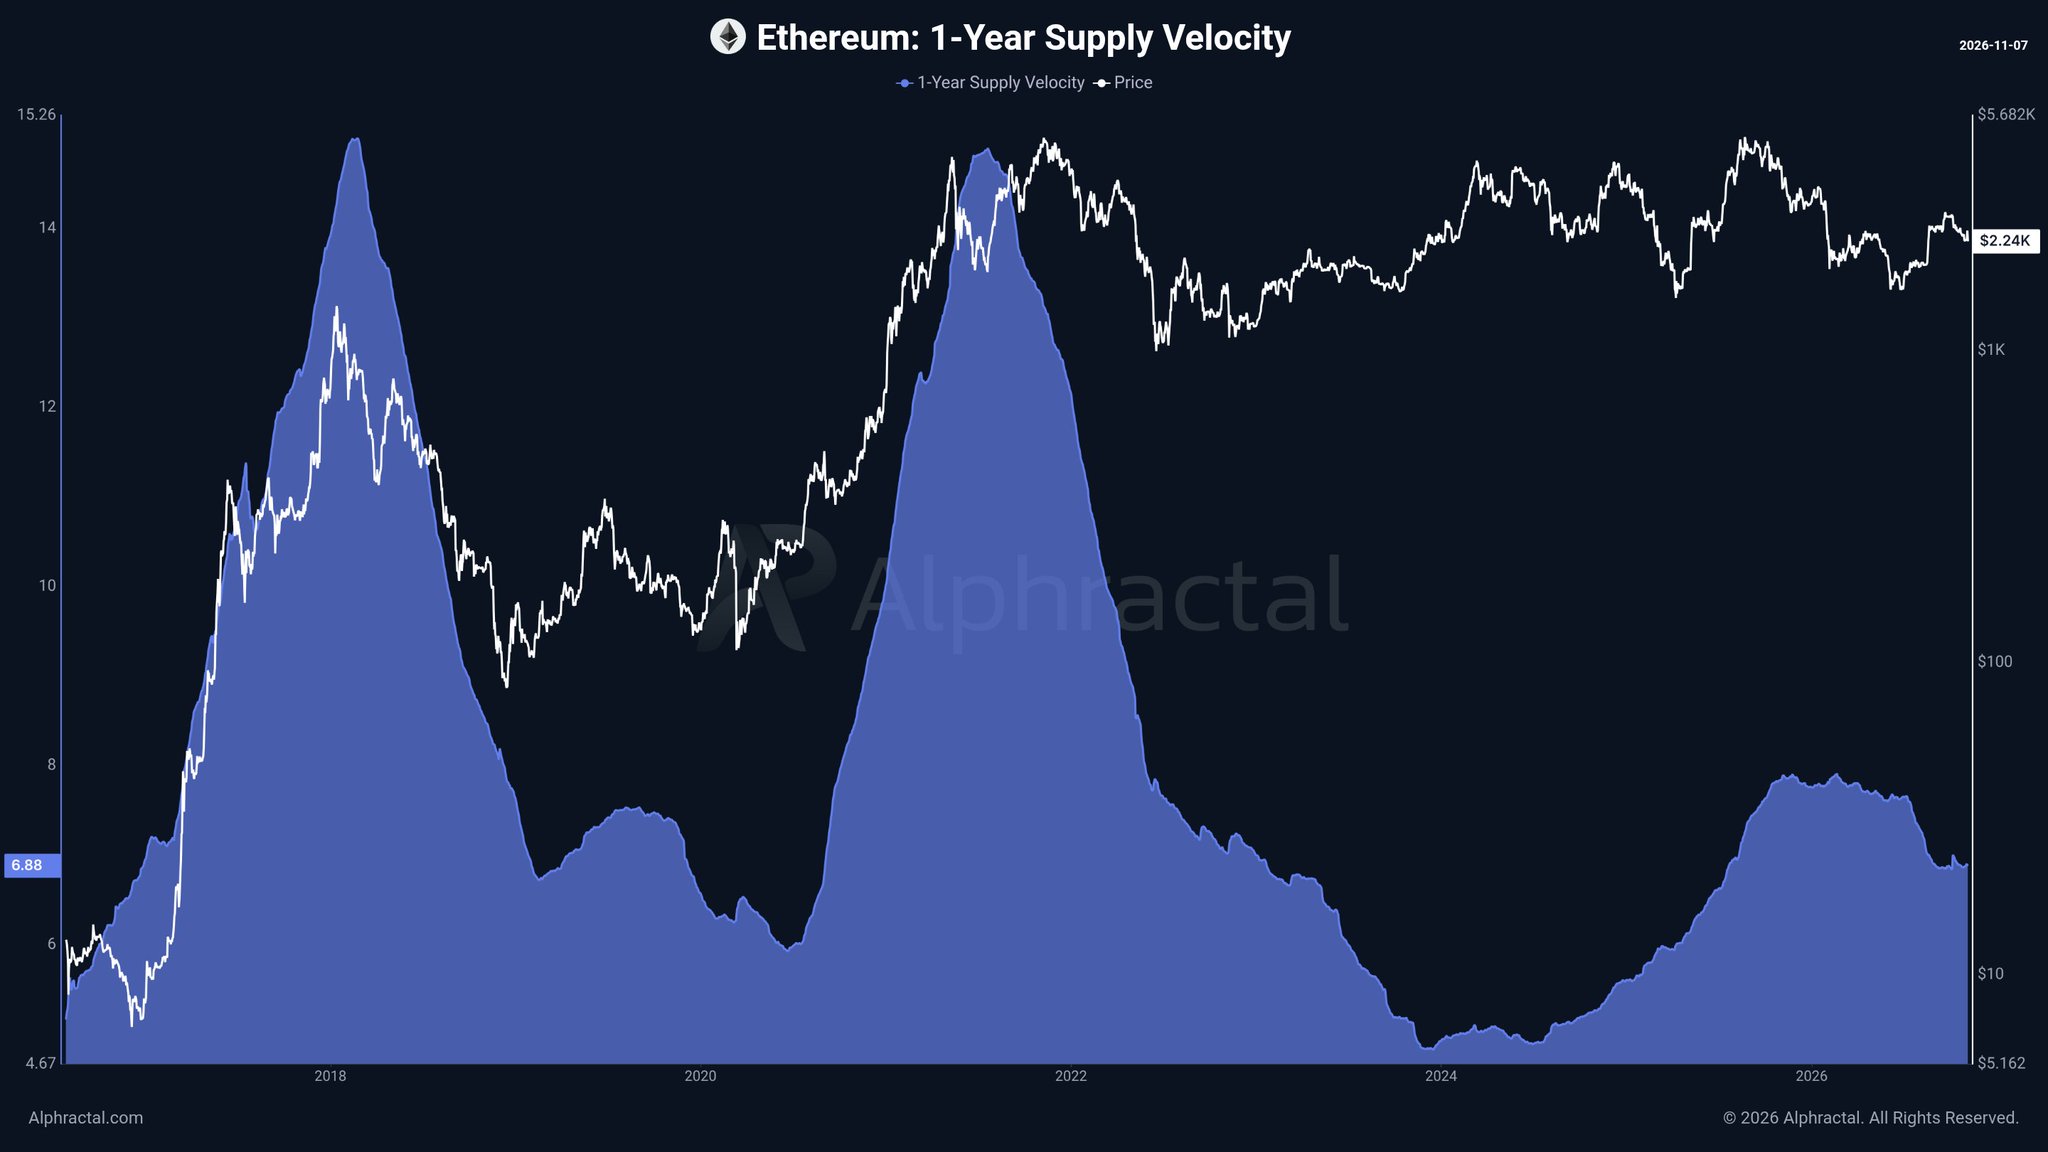
The divergence between the two assets is the core analytical point. Bitcoin’s velocity has collapsed to multi-decade lows, suggesting aggressive, conviction-driven HODLing. Ethereum’s velocity at 6.88 remains in a historically suppressed range but has not reached the same extreme floor — the circulating supply continues to turn over at a meaningfully higher rate. Part of this divergence reflects structural differences in how the two networks are used: Ethereum’s DeFi and smart contract ecosystem requires ETH to move as gas and collateral, creating a natural velocity floor that Bitcoin — primarily a store-of-value asset — does not have.
Signal 3 — BTC Supply Approaching the Hard Cap: 20.11M of 21M Mined
The third data point from the Alphractal analysis is the absolute supply figure: 20.11 million BTC have already been mined, representing 95.76% of the 21 million hard cap. The BTC current supply chart shows the classic S-curve of Bitcoin’s issuance — a steep initial rise from 2010 to approximately 2017, then a decelerating curve flattening asymptotically as block rewards halve every four years. The curve is now approaching its mathematical ceiling, with new supply issuance progressively insignificant relative to existing float.
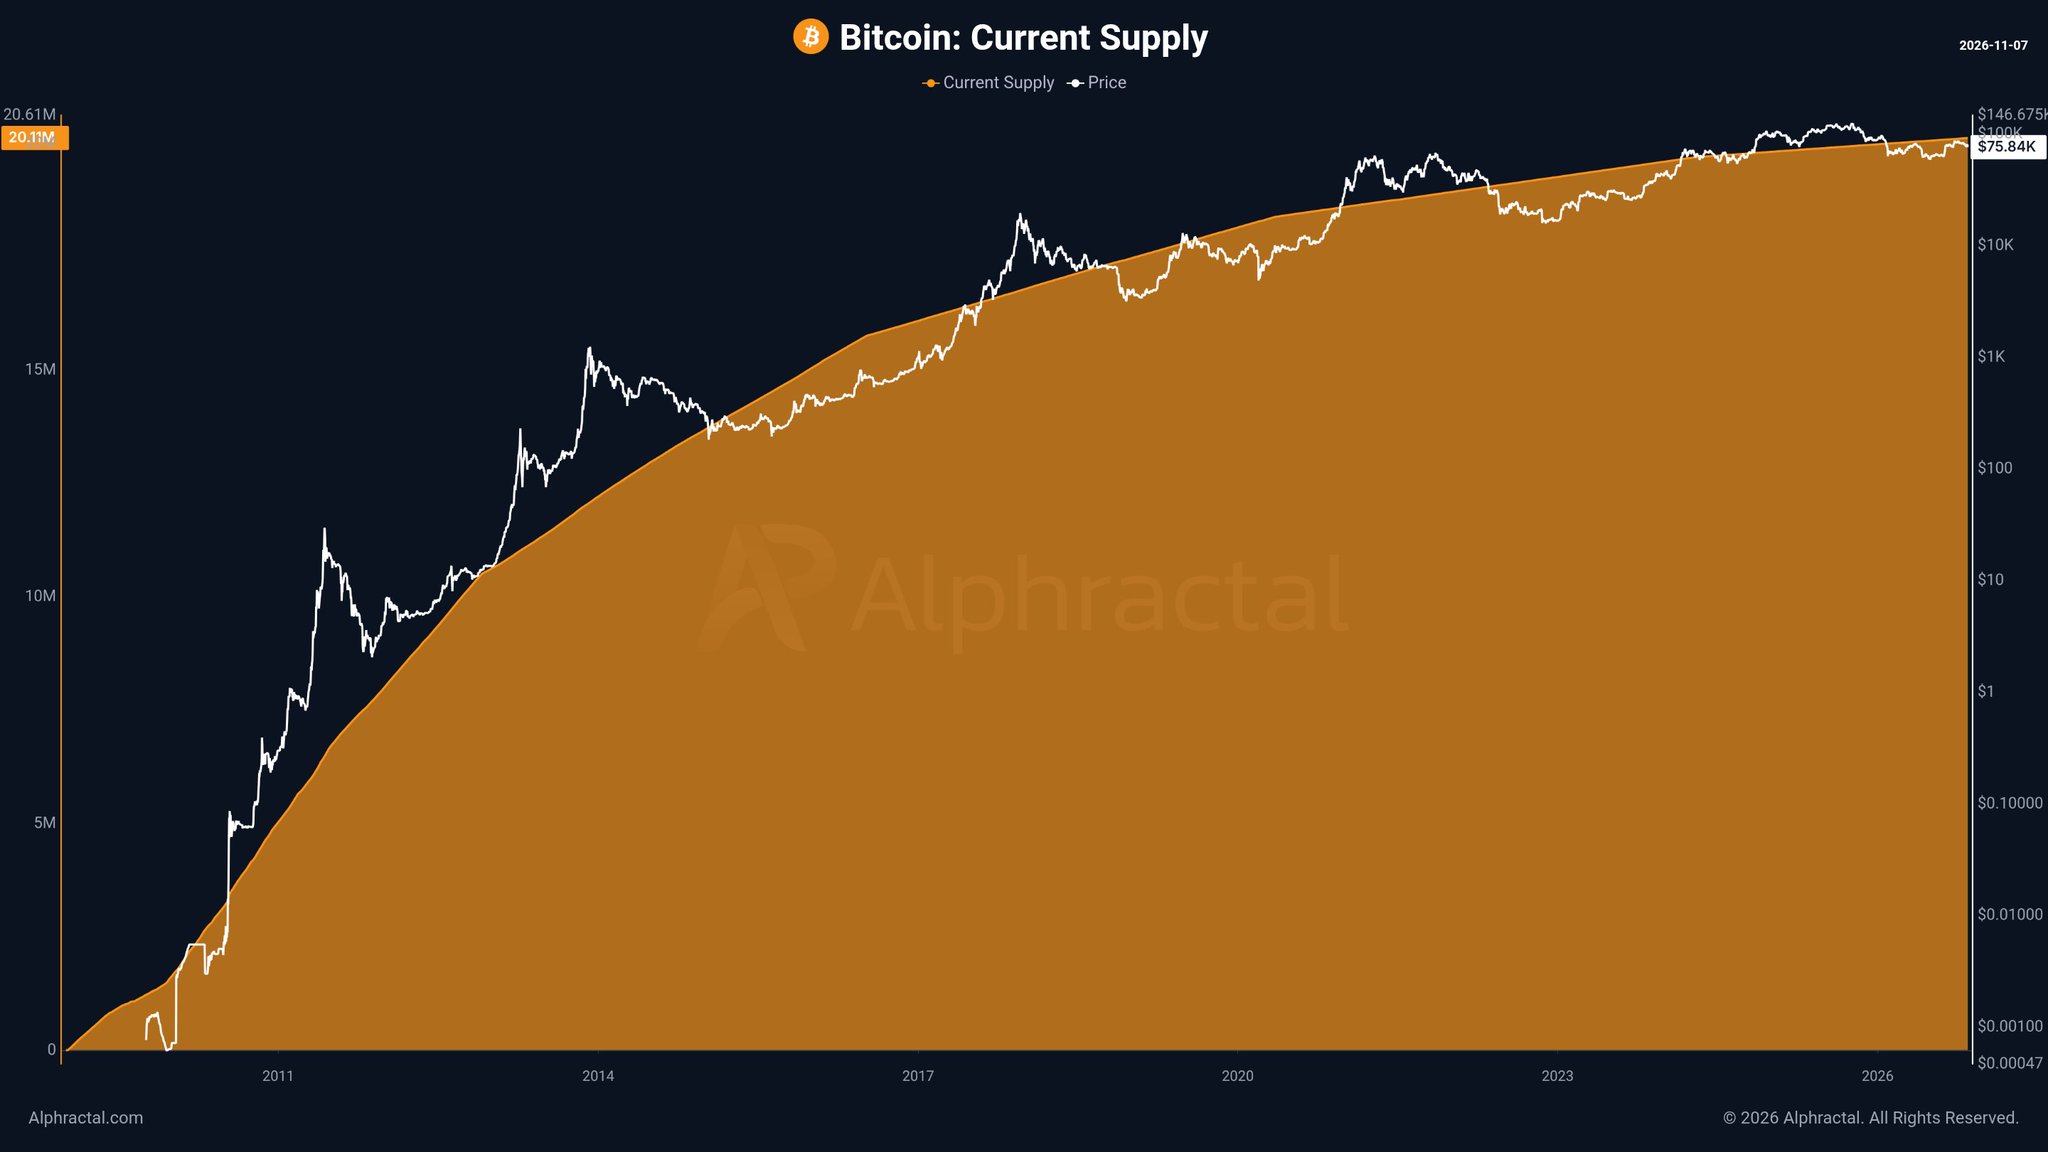
This matters because the supply constraint compounds over time. With 889,000 BTC remaining to be mined across multiple future halvings — and with velocity data showing that existing holders are HODLing at record rates — the available liquid supply is a shrinking denominator. Any sustained demand increase from institutions, spot ETFs, or retail buyers must be absorbed by an increasingly illiquid market. The full structural context of this supply dynamic has been documented in prior analysis.
Signal 4 — ETH Post-Merge Supply: Growth Structurally Stalled
Ethereum’s supply chart covering 2016 to 2026 shows a starkly different issuance profile. Supply rose steeply from approximately 71.3 million ETH at inception to a peak before the Merge, then flattened sharply post-2022 as the proof-of-stake transition introduced deflationary pressure through EIP-1559 fee burning. The current supply of 122.19 million ETH reflects a near-plateau — a structural change that has no equivalent in Bitcoin’s hard-cap model but produces its own form of supply constraint in high-fee environments.
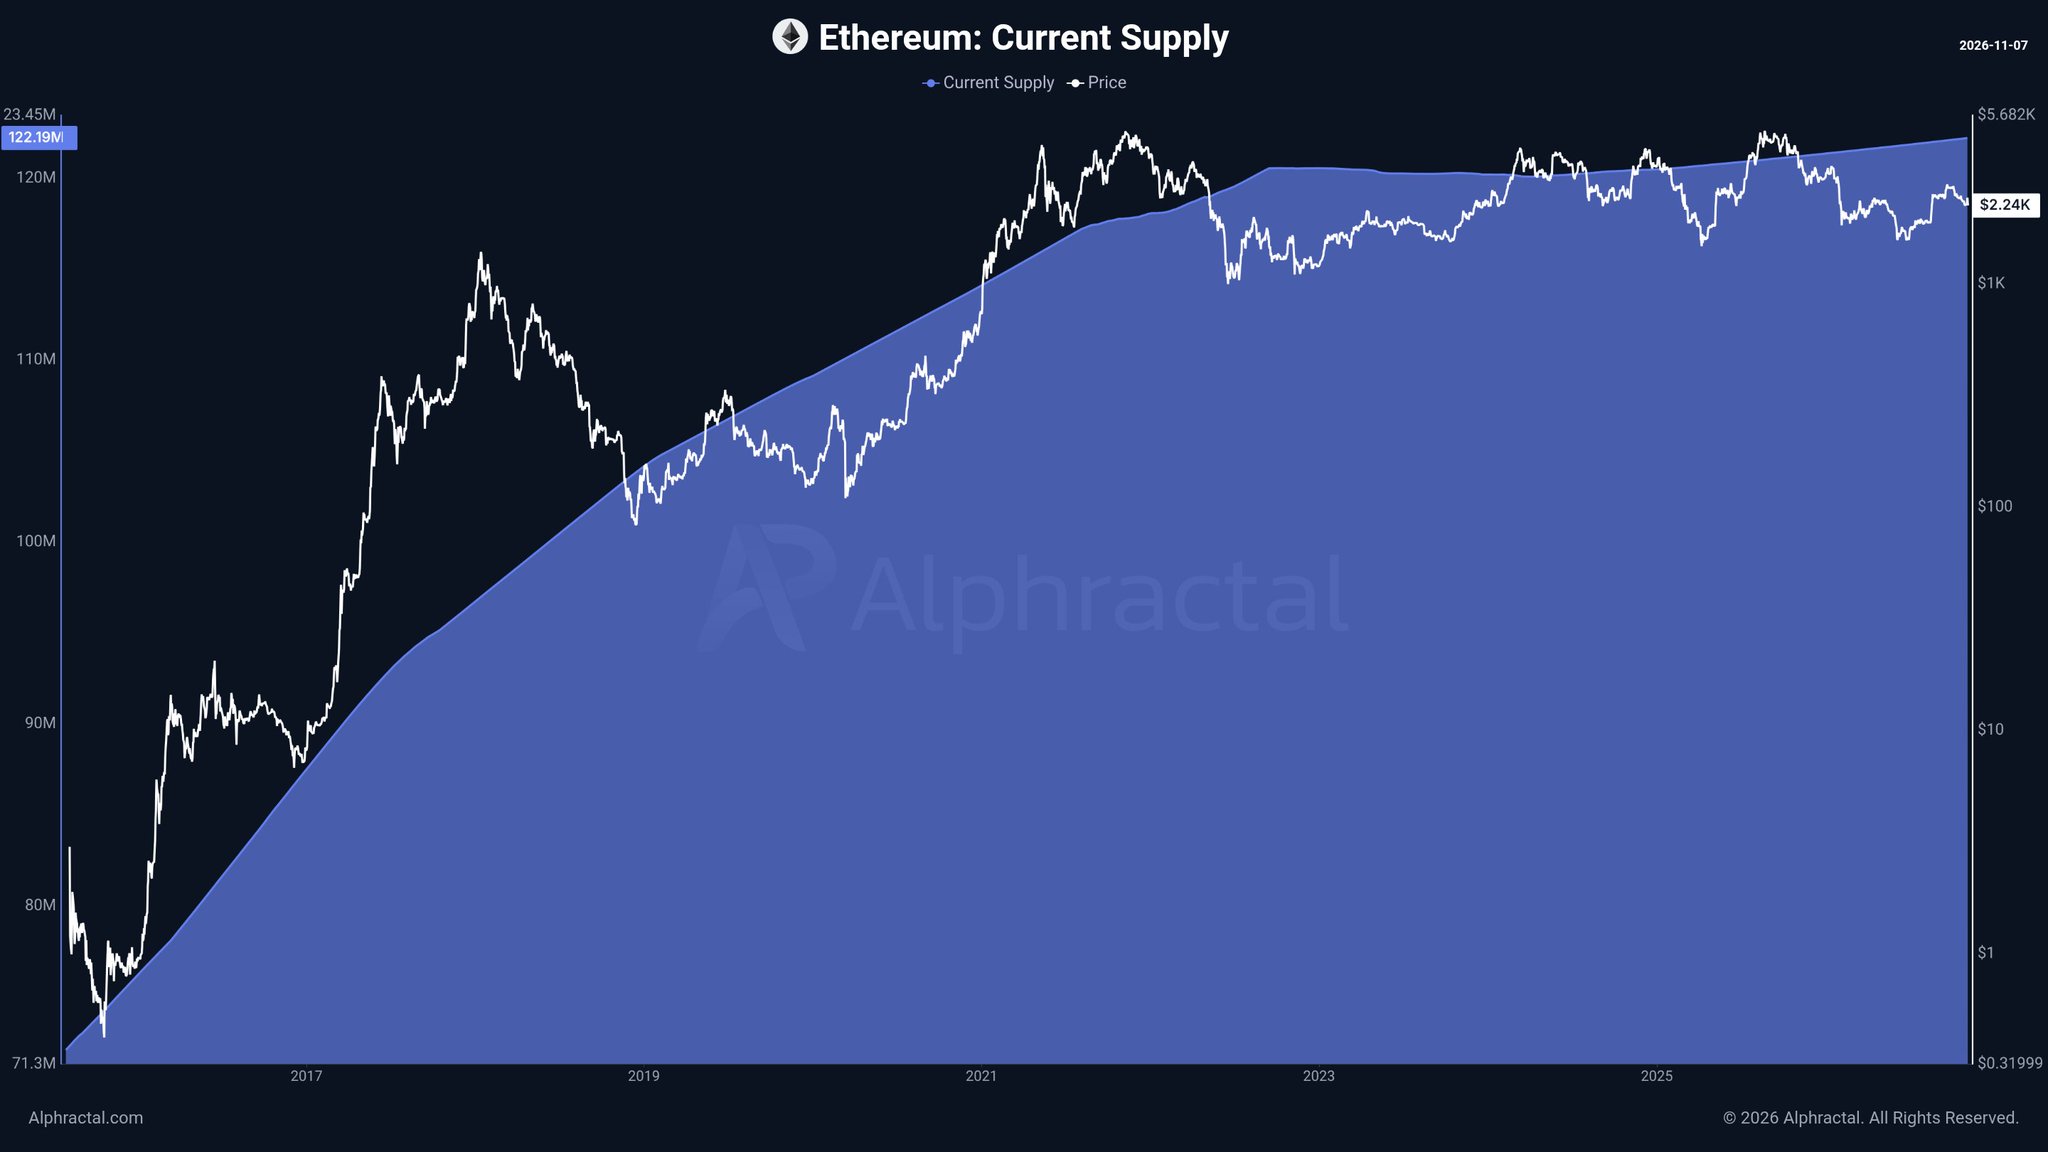
ETH price at time of writing stands at $2,240 — well below the 2021 all-time high peak region visible on the supply chart. The Merge’s deflationary mechanism has not yet produced the sustained price appreciation many modeled it to deliver, but the supply structure has fundamentally changed: unlike Bitcoin’s predictable issuance schedule, ETH’s net supply growth is now tied directly to network fee activity. High usage burns more ETH; low usage allows modest inflation. At current price and fee levels, supply growth is effectively stalled.
ETF Flows and Macro Context
The on-chain accumulation signal arrives against a challenging short-term institutional flow backdrop. Data via SoSoValue shows Bitcoin spot ETFs recorded a daily net outflow of $411.9M on November 6, with $1.28 billion in net outflows across the past five trading days — four of which saw net selling. IBIT led the outflows at $403.0M on that date, while FBTC bucked the trend with $42.8M in inflows. Total ETF net assets remain at $95.90 billion, with cumulative inflows since launch at $55.70 billion — indicating the outflows represent a rotation or profit-taking event, not a structural reversal of institutional positioning.
The macro backdrop adds complexity. Markets are pricing a 76.3% probability of a rate hike to 4.00%–4.25% at the December 9 FOMC meeting, per SoSoValue data — a tightening bias that historically pressures risk assets. CPI data is due November 9, with PPI following on November 12 and retail sales on November 16. The near-term macro environment creates a headwind that the velocity signal — a structural, slow-moving indicator — does not resolve on a weekly basis. Strategy (MSTR) has continued accumulating, adding 811 BTC for $65.5 million in its latest purchase, bringing total holdings to 849,327 BTC. That represents a different timeframe of conviction.
For broader context on where Bitcoin finds critical price support amid current conditions, the analysis in How Low Can BTC, ETH, and XRP Go? Key Levels to Watch Now maps the key levels that matter structurally. And for the most recent demand-side context, Bitcoin’s retreat to $75,522 as spot demand failed to support the $80K recovery provides the immediate price-action backdrop against which today’s supply data should be read.
What the Velocity Signal Confirms — and What It Doesn’t
The 1.97 supply velocity reading confirms one thing with precision: Bitcoin holders are not selling. At 95.76% of maximum supply already issued, and with on-chain velocity at multi-decade lows, the structural supply constraint is real and measurable. What the signal does not confirm is timing. Supply velocity is a non-directional, structural indicator. It says nothing about when demand arrives or at what price level the cycle inflects. Prior velocity troughs have preceded major price appreciation — but the lag between trough and price breakout has varied across cycles. The indicator identifies the compressed spring. It does not tell you when it releases.
Bitcoin at $76,004 sits 48.1% below the chart’s labeled prior cycle reference of $146,675 visible on the supply velocity chart’s right axis — a figure that represents the annotated upper range of the chart’s price scale, not an analyst price target. The current price position is documented at $76,090 on the velocity chart and $75,840 on the supply chart — both chart annotations consistent with the live price at time of writing.
Source: x.comFrequently Asked Questions
What is Bitcoin’s 1-Year Supply Velocity and why does a reading of 1.97 matter?
How does Bitcoin’s supply velocity of 1.97 compare to Ethereum’s current reading?
Does BTC approaching 20.11 million of 21 million mined coins affect price?
Why are Bitcoin spot ETFs seeing outflows even as supply velocity hits multi-decade lows?
Source: Alphractal · Published by CoinsProbe Markets Desk
The opinions and market insights shared on CoinsProbe represent the views of individual authors based on prevailing market conditions at the time of publication. Cryptocurrency investments carry significant risk and volatility. Readers are encouraged to conduct their own research and seek professional financial advice before making investment decisions. CoinsProbe and its contributors do not accept responsibility for financial losses or decisions made based on published content.
CoinsProbe may publish sponsored articles, affiliate links, or promotional collaborations. All sponsored material is clearly labeled to maintain transparency with our audience. Our editorial decisions remain fully independent, and advertising partnerships do not influence reviews, rankings, or published opinions.
Since 2023, CoinsProbe has delivered reliable insights on cryptocurrency, blockchain, and digital assets. Our content is created by experienced researchers and analysts who follow strict editorial standards focused on accuracy, transparency, and credibility. Every article is carefully reviewed and verified using trusted sources and current market data. We provide unbiased analysis and timely updates covering everything from emerging crypto projects to major industry developments.