- Bitcoin trades at $77,676 — down 3.01% in 24h — after hitting the EMA200 exactly as predicted by @CryptoBullet1 on Oct 23
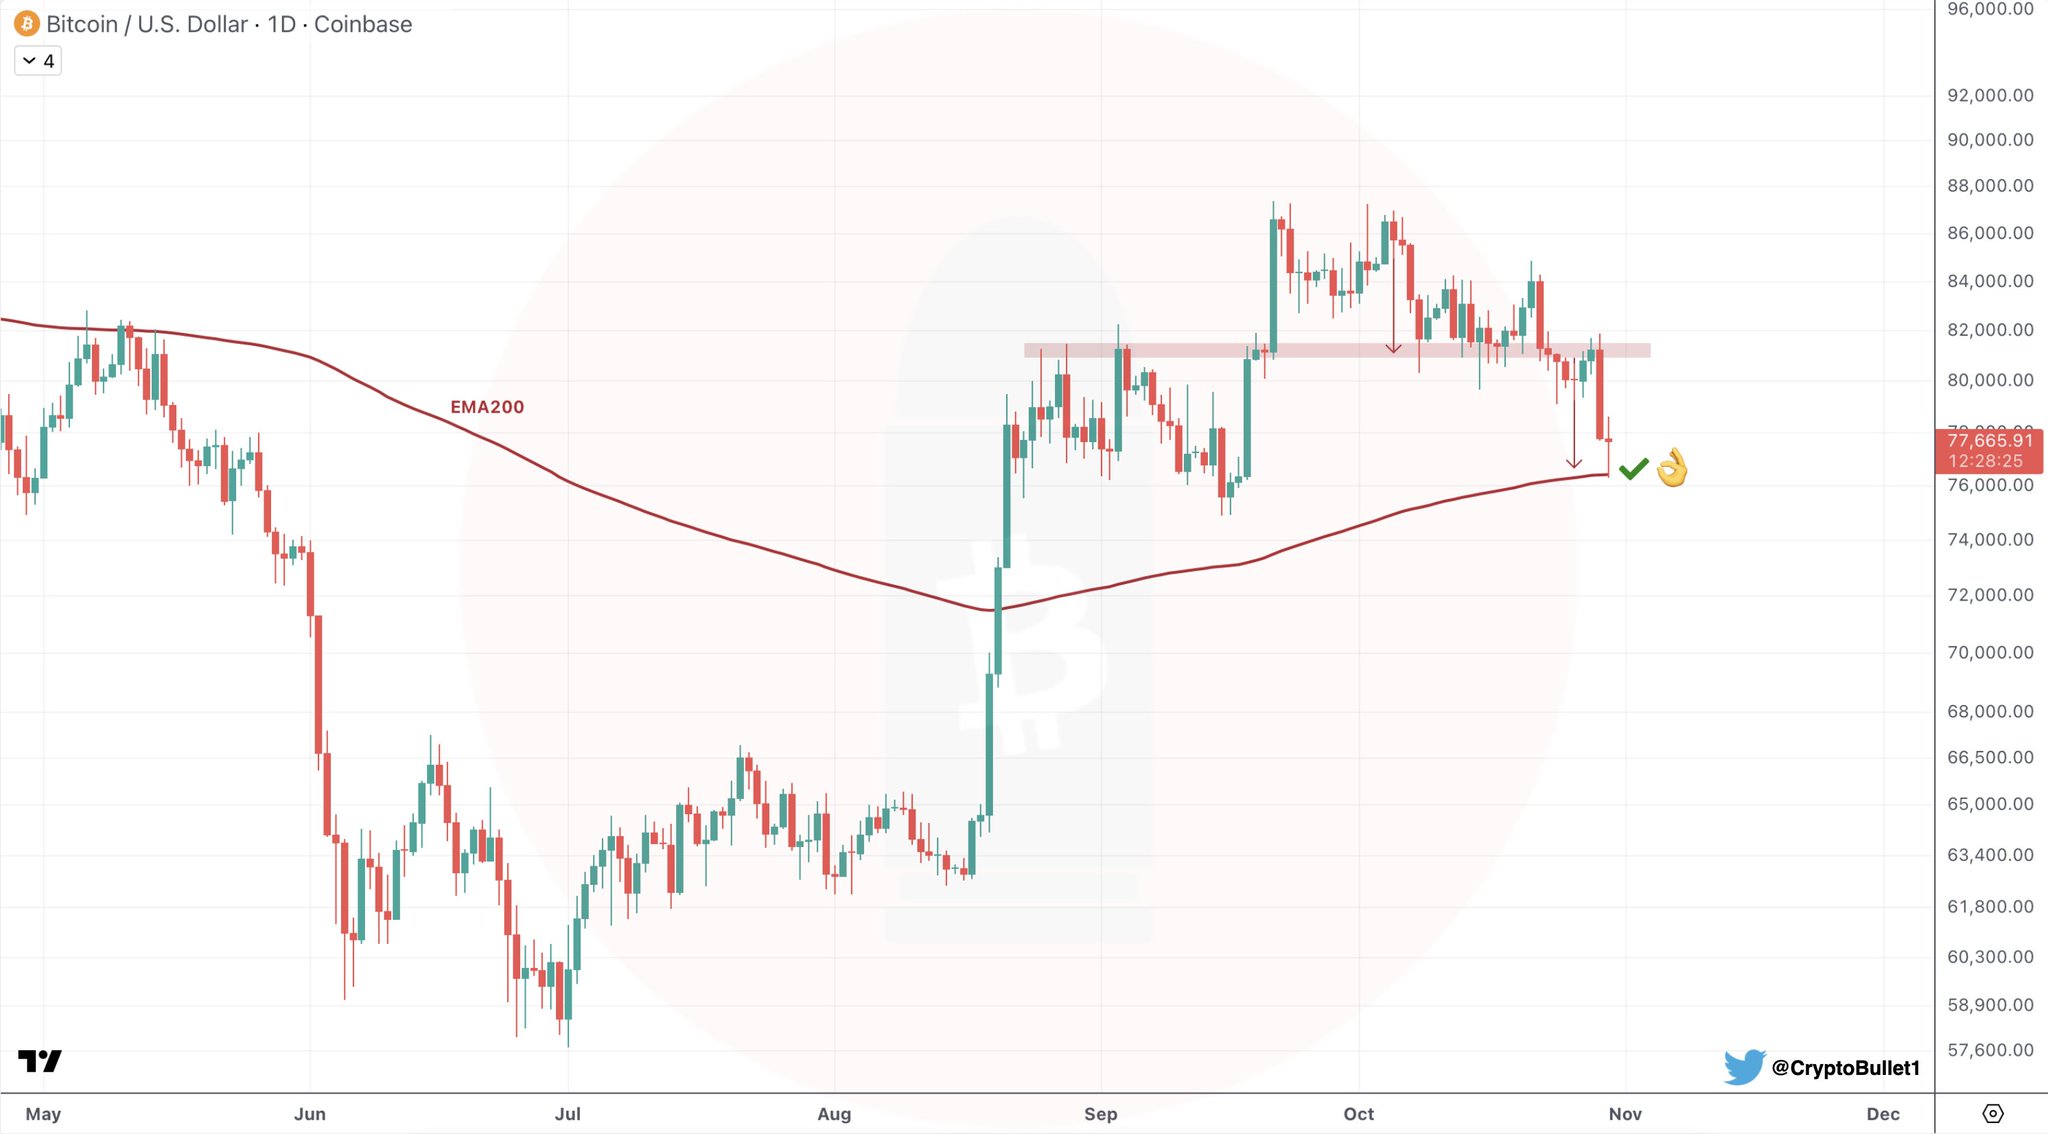
- EMA200 on the Coinbase daily chart reads 77,665.91; price broke down from the prior pink supply zone, confirming the breakdown
- Spot BTC ETFs recorded +$17.1M net inflow on Oct 29, extending a 4-day streak with $104.27B in total ETF net assets
Bitcoin is trading at $77,676 — down 3.01% in the past 24 hours — and has touched a level that one analyst called with precision a week before it happened. The 200-day Exponential Moving Average (EMA200) on the daily Coinbase chart is not a coincidence. It is a confirmed technical target, now fulfilled.
Analyst @CryptoBullet1 posted the original bearish warning on October 23, 2026, writing: “$BTC is hanging by a thread here 👀 I’m expecting 📉” — flagging a deteriorating setup in the chart with no ambiguity about direction. Seven days later, on October 30, the follow-up landed: “$BTC hit the EMA200 as expected ✅ 😎 You’re welcome.” The call played out to the letter.
What the EMA200 Is — and Why It Matters Here
The 200-day Exponential Moving Average is the most-watched long-term trend indicator in traditional and crypto markets. Unlike the Simple Moving Average (SMA200), the EMA200 assigns exponentially greater weight to recent price data — making it more responsive to current momentum. In practice, it functions as a dynamic support/resistance line that major institutions and algorithmic systems track in real time.
When Bitcoin is trading above the EMA200, it is broadly considered in a bullish macro regime. When it trades below, that regime flips. The significance of the current touch is twofold: price has broken down from its prior horizontal consolidation range (the shaded pink supply zone visible in the Coinbase daily chart) and declined precisely to the EMA200, which was rising from below to meet it. The convergence was not accidental — it was the predicted destination.
According to the daily chart shared by @CryptoBullet1, Bitcoin’s EMA200 is currently sitting at approximately $77,665.91 — the chart’s price readout at the time of the post. The live price at time of writing is $77,676, confirming the touch is live, not historical. Price remains below the horizontal pink resistance/supply zone that capped the prior rally — meaning the breakdown from that consolidation range is confirmed, not pending.
This is a structurally important position. As we covered previously, Bitcoin breaking key support with the EMA200 near $76K had already come into focus as a critical reference point for this leg of the move.
The Breakdown — What the Chart Actually Shows
The chart from @CryptoBullet1 tells a clear sequence. Bitcoin rallied sharply from August lows, pushed into a horizontal resistance/supply zone (the pink-shaded band on the chart), failed to break above it with conviction, and reversed. The pullback has now erased that entire attempted breakout and brought price back to the rising EMA200 — which has been curling upward from below throughout the decline.
This is a classic structure: failed breakout above resistance → breakdown → mean reversion to the dynamic long-term average. The EMA200 touch is where the breakdown’s first phase ends and the market must decide: is this a support hold or a continuation of the slide? That question is now open.
For additional context on the structure: the channel breakdown scenario, which flagged $82K as resistance and $72.5K as the potential buy zone, remains relevant backdrop to the current decline.
Institutional Context — ETF Flows Hold Despite the Drop
Despite Bitcoin’s 3% slide, spot ETF data from SoSoValue shows institutional demand has not collapsed. The latest available trading day (October 29, 2026) recorded a net inflow of +$17.1M across Bitcoin spot ETFs, extending a four-consecutive-day inflow streak. Total ETF net assets stand at $104.27 billion, with cumulative inflows since launch reaching $57.62 billion.
The per-fund breakdown: IBIT logged +$12.8M (AUM $65.79B), FBTC logged +$10.5M (AUM $14.24B), and GBTC saw zero net flow (AUM $10.11B). The past five trading days combined for +$302.8M in net inflows — suggesting institutional allocation has not reversed despite the price breakdown. Strategy (formerly MicroStrategy) continues accumulating: their total holdings now stand at 848,517 BTC, with a latest purchase of 267 BTC for $22.1 million and 851 BTC acquired over the past three weeks for $72.8 million.
ETF inflows do not override technical structure, but the divergence between price action and institutional buying is a data point that complicates a pure bearish read. Persistent ETF demand at a technically critical level does not guarantee a bounce — but it does confirm that the buyer base has not stepped away.
Macro Backdrop — What Comes Next Week
Markets price a 70.4% probability that the Fed holds rates at the 4.00%–4.25% band at the December 9, 2026 FOMC meeting, per SoSoValue data. The 29.6% minority case is for a cut to 3.75%–4.00%. In the near term, macro data drops that could move Bitcoin: ISM Manufacturing PMI on November 1, ISM Non-Manufacturing PMI on November 3, and critically, CPI (MoM and YoY) on November 9. Any inflation surprise on November 9 lands directly into a Bitcoin sitting at a technical inflection.
The EMA200 Hold — or Breakdown
The EMA200 touch is confirmed. What happens next is binary. Either this level absorbs the selling — as it has historically during Bitcoin bull market corrections — or it fails, and the next reference zone becomes relevant. The prior breakdown analysis from CoinsProbe flagged $72.5K as the next buy zone if EMA200 does not hold.
@CryptoBullet1’s call has been fully vindicated. The EMA200 touch at ~$77,665 has happened exactly as forecast. The question the market must now answer is whether this is a floor or a waypoint — and price action in the sessions immediately ahead will resolve it. Bitcoin’s daily close relative to the EMA200 is the exact level every participant should be watching.
Frequently Asked Questions
What does the EMA200 touch mean for Bitcoin’s price right now?
Did Bitcoin break below the EMA200 or just touch it?
Are institutional investors still buying Bitcoin during this decline?
What macro events could move Bitcoin in the coming days?
Source: Cryptobullet1 · Published by CoinsProbe Markets Desk
The opinions and market insights shared on CoinsProbe represent the views of individual authors based on prevailing market conditions at the time of publication. Cryptocurrency investments carry significant risk and volatility. Readers are encouraged to conduct their own research and seek professional financial advice before making investment decisions. CoinsProbe and its contributors do not accept responsibility for financial losses or decisions made based on published content.
CoinsProbe may publish sponsored articles, affiliate links, or promotional collaborations. All sponsored material is clearly labeled to maintain transparency with our audience. Our editorial decisions remain fully independent, and advertising partnerships do not influence reviews, rankings, or published opinions.
Since 2023, CoinsProbe has delivered reliable insights on cryptocurrency, blockchain, and digital assets. Our content is created by experienced researchers and analysts who follow strict editorial standards focused on accuracy, transparency, and credibility. Every article is carefully reviewed and verified using trusted sources and current market data. We provide unbiased analysis and timely updates covering everything from emerging crypto projects to major industry developments.