
- Bitcoin is trading at $78,264 (+2.03%) and has converged with the Trader Realized Price — the average cost basis of BTC moved on-chain in the past 1–3 months
- CryptoQuant analyst: if BTC holds and moves away, recent participants' cost basis is confirmed as support; a break below flips it to resistance
- Spot Bitcoin ETFs saw $115.6M net outflow on Nov 3, with 3 consecutive outflow days totaling $1.0B — IBIT led with $95.0M in outflows per SoSoValue
- Key forward risk: CPI data releases November 9; markets price 83.2% probability of a December FOMC rate hike per SoSoValue
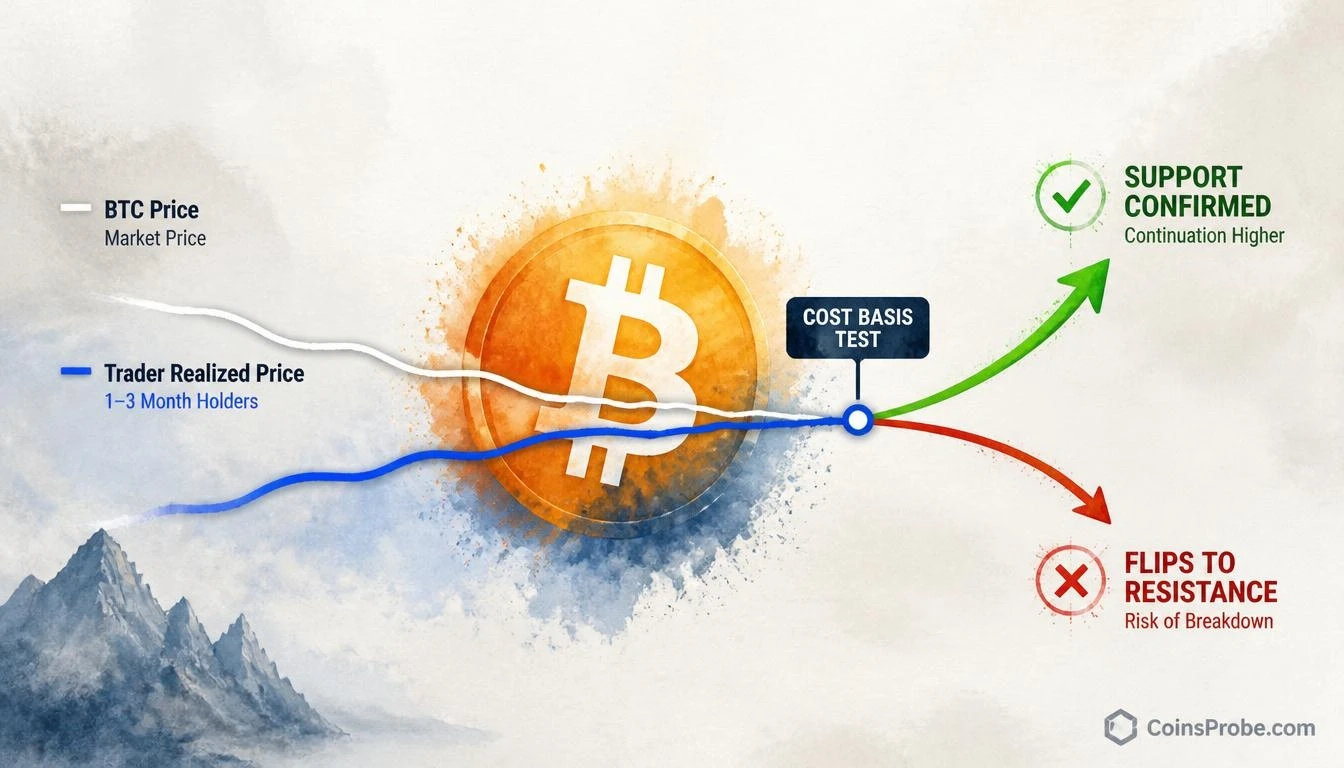
Bitcoin is trading at approximately $78,264 — up 2.03% in the past 24 hours — but the number that matters most right now is not on the price ticker. It is on-chain. According to a CryptoQuant Quicktake published on November 4, 2026, Bitcoin has converged almost exactly with its Trader Realized Price, an on-chain level that has historically acted as either a critical support floor or a hard resistance ceiling — depending entirely on which side of it price settles.
An on-chain analyst publishing through CryptoQuant identifies this convergence as the most consequential test of the current correction. “If BTC successfully holds around the Trader Realized Price and begins to move away from it again, it would suggest that the average cost basis of recent participants is still functioning as support,” the analyst writes in the full CryptoQuant Quicktake note. The framing is deliberate: this is not a declaration of a bottom. It is a framework for reading what the market’s reaction at this level will tell us about where pressure comes from next.
What the Trader Realized Price Actually Measures
The Trader Realized Price is not a moving average. It is not a trendline drawn on a chart. It is an on-chain derived metric that represents the average acquisition price of Bitcoin that last moved on-chain between one and three months ago. In other words: it is the average cost basis of relatively recent market participants — the cohort that bought within the past quarter and has not yet moved their coins again.
That definition carries a specific implication. When Bitcoin trades above this level, the recent-buyer cohort sits in unrealized profit. Pullbacks toward the Trader Realized Price in that environment tend to attract support — buyers near breakeven have little incentive to sell, and others see the dip as a re-entry near a known cost cluster. When Bitcoin trades below this level, the same cohort moves into unrealized loss. The cost basis that previously attracted buyers now becomes a ceiling: traders waiting to exit at breakeven provide supply every time price attempts a recovery toward that level.
That dual nature — support above, resistance below — is precisely what makes the current test significant. Price and cost basis have met. The reaction from here will distinguish between two structurally different outcomes.
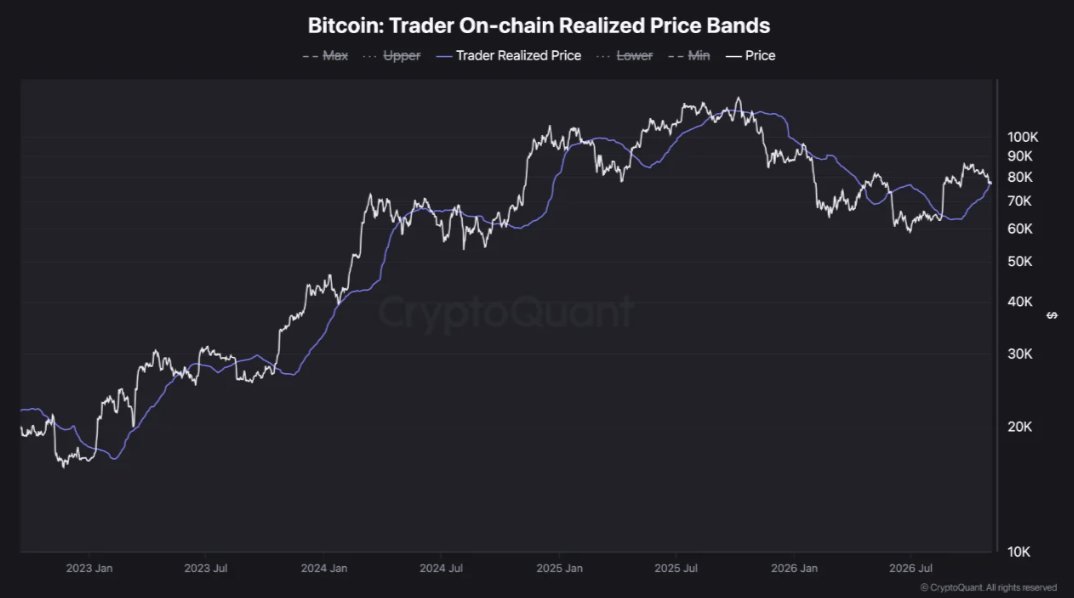
The Current Test — What the Chart Shows
The on-chain chart shared by CryptoQuant spans approximately January 2023 through late 2026 and plots Bitcoin’s price alongside the Trader Realized Price in blue. Both lines trended upward together from early 2023 through mid-2025, then both declined and converged at the chart’s right edge. At the time of writing, the white price line is touching and fluctuating directly around the blue Trader Realized Price line. The test is ongoing — no confirmed hold above or breakdown below has yet occurred. This is an active, unresolved test at a historically significant level.
The chart’s visual message reinforces the analyst’s written note precisely: price and cost basis are meeting. What happens next is the question the market is currently answering in real time.
Why the Outcome Here Is Binary
The CryptoQuant analyst is explicit that this level does not guarantee a bottom. The interesting question, as stated in the published note, is whether the market can actually defend it. The analyst lays out both interpretations with equal weight:
If price holds and moves away: The average cost basis of recent participants is confirmed as support. The correction found buyers at a logical on-chain level. Upside continuation becomes the structural read.
If price breaks below and fails to reclaim: Recent market participants move increasingly into unrealized losses. The Trader Realized Price transitions from a support reference to a resistance reference. Sellers who bought in the past one-to-three months will use any recovery toward that level as a breakeven exit — adding supply into any bounce.
That transition — from support to resistance — is not theoretical. It is the documented historical behavior of this metric. According to the CryptoQuant note, once price loses the Trader Realized Price and fails to reclaim it, the same cost basis can later become resistance as traders use a return to breakeven as an opportunity to exit. The mechanism is straightforward: unrealized loss creates incentive to sell into recovery, not hold through it.
ETF Flows Add Context to the Pressure
The on-chain test does not exist in a vacuum. Spot Bitcoin ETF data via SoSoValue shows a $115.6M net outflow on the latest trading day (November 3, 2026), with three consecutive outflow days totaling a net $1.0 billion over the past five sessions. IBIT led outflows at $95.0M, while FBTC recorded a modest $6.8M inflow. Total ETF net assets stand at $99.16B against a cumulative net inflow of $56.47B since launch.
The ETF outflow streak is relevant context here: institutional selling pressure through the ETF wrapper is one structural reason Bitcoin has converged downward toward the Trader Realized Price rather than bouncing from above it. Strategy (MSTR) continues to accumulate — adding 811 BTC for $65.5M most recently, bringing total holdings to 849,327 BTC — but that corporate buying has not been sufficient to absorb the institutional outflow trend over the past week.
Separately, markets are currently pricing an 83.2% probability of a rate hike at the December 9 FOMC meeting, per SoSoValue data. A tightening macro backdrop — rising rate expectations combined with ETF outflows — creates the external pressure environment within which this on-chain test is occurring. For context on how Bitcoin has historically navigated macro inflection points, see Bitcoin’s 2026 Midterm Anomaly — +20.4% Pre-Vote, 4/4 Post-Vote Gains and Bitcoin Is Higher 1 Year After Every Midterm — But the Sample Size Is 4.
CPI data drops November 9, followed by PPI on November 12 and Retail Sales on November 16. Any upside inflation surprise would reinforce rate-hike expectations and intensify the pressure on risk assets — including at exactly the level Bitcoin is currently testing.
What Confirmation Requires
The analyst does not name a specific price level in dollar terms as the Trader Realized Price — the metric is dynamic and updates with on-chain activity. What the note does specify is the behavioral confirmation required for each scenario:
For the support thesis to be confirmed: Bitcoin must hold around the Trader Realized Price and begin to move away from it with momentum. A flat hold at the level without directional separation does not confirm support — it prolongs the test.
For the resistance thesis to become operative: Price must break below the Trader Realized Price and fail to reclaim it on a subsequent recovery attempt. The failure to reclaim — not just the break — is what converts the level from support to resistance in the analyst’s framework.
Upcoming macro data releases this week — particularly CPI on November 9 — represent a near-term catalyst that could force resolution of this test in either direction.
Bullish Scenario
Bitcoin holds the Trader Realized Price and begins printing higher closes above it. The recent-participant cohort remains in unrealized profit, removing breakeven selling pressure. The on-chain structure reads as a corrective pullback finding support at a logical cost-basis level, with the path of least resistance shifting upward.
Bearish Scenario
Bitcoin breaks below the Trader Realized Price and fails to reclaim it on a recovery attempt. The recent-participant cohort moves into unrealized loss. Every subsequent bounce toward the Trader Realized Price generates breakeven selling pressure from that cohort — turning a former support cluster into a resistance ceiling. The structural read shifts to distribution, not accumulation.
The Trader Realized Price is the single most important on-chain level Bitcoin is facing right now. Price and the average cost basis of recent market participants have converged — a collision that, per CryptoQuant’s published analysis, has historically resolved in one of two structurally opposite ways. Three consecutive days of ETF outflows totaling $1.0 billion, an 83.2% market-implied probability of a December rate hike, and CPI data due November 9 all frame the external environment. The on-chain test is active and unresolved. Watch whether Bitcoin can hold and separate from the Trader Realized Price — or whether it breaks below and returns to test it from underneath.
Frequently Asked Questions
What is the Trader Realized Price and why does it matter for Bitcoin right now?
What specific conditions does the CryptoQuant analyst require to confirm support?
How do current Bitcoin ETF flows affect this on-chain test?
What macro events could force a resolution of the Trader Realized Price test?
Source: CryptoQuant · Published by CoinsProbe Markets Desk
The opinions and market insights shared on CoinsProbe represent the views of individual authors based on prevailing market conditions at the time of publication. Cryptocurrency investments carry significant risk and volatility. Readers are encouraged to conduct their own research and seek professional financial advice before making investment decisions. CoinsProbe and its contributors do not accept responsibility for financial losses or decisions made based on published content.
CoinsProbe may publish sponsored articles, affiliate links, or promotional collaborations. All sponsored material is clearly labeled to maintain transparency with our audience. Our editorial decisions remain fully independent, and advertising partnerships do not influence reviews, rankings, or published opinions.
Since 2023, CoinsProbe has delivered reliable insights on cryptocurrency, blockchain, and digital assets. Our content is created by experienced researchers and analysts who follow strict editorial standards focused on accuracy, transparency, and credibility. Every article is carefully reviewed and verified using trusted sources and current market data. We provide unbiased analysis and timely updates covering everything from emerging crypto projects to major industry developments.