
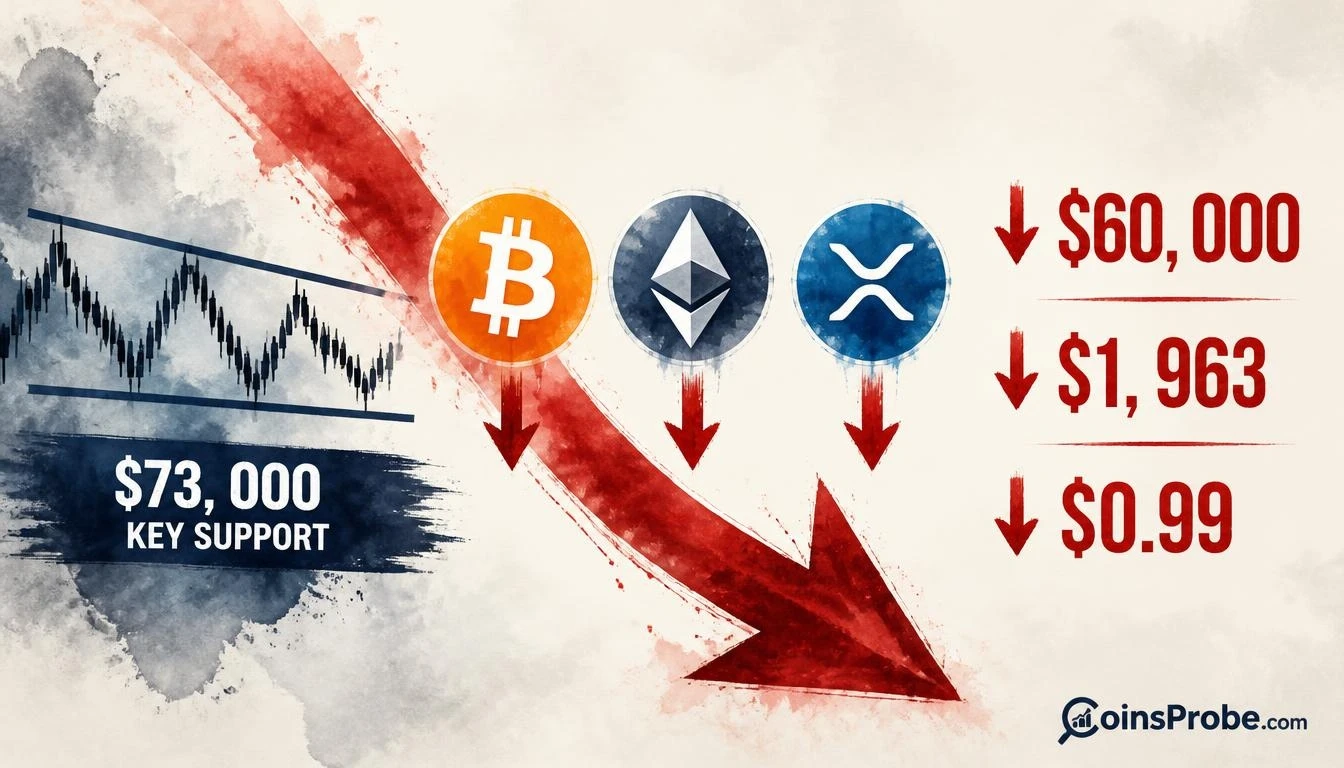
- XRP trades at $1.17 (-1.27% 24h) after breaking below mid-channel $1.42 support; next target is $0.99 lower boundary
- Bitcoin holds above $73,000 mid-channel support on the 3-day chart — a close below targets the $60,000 lower boundary
- Ethereum breakdown already confirmed below $2,385; measured downside target is $1,963 per daily chart structure
- XRP spot ETFs saw net outflows across 5 consecutive trading days totaling -$530K, per SoSoValue data
XRP is trading at $1.17 — down 1.27% in the past 24 hours — with a market cap of $74.35 billion, as a broad risk-off selloff drags the entire crypto market lower. Bitcoin, Ethereum, and XRP are each approaching critical technical levels that will determine whether the decline stays contained or accelerates into a deeper flush.
An analyst has published a five-part thread mapping the precise downside targets for all three assets, flagging the exact levels where the selling could either pause or intensify. The macro context is clear: weakness in AI and chipmaker equities has spilled into crypto, compounded by regulatory uncertainty following a shift in the congressional balance of power and persistent damage to sentiment from the reported $6.3 billion Binance security incident.
Signal 1 — Bitcoin: Channel Support at $73,000, Lower Boundary at $60,000
On the three-day chart, Bitcoin is trading within a defined horizontal channel with a flat upper boundary near $87,000, a mid-range support near $73,000, and a lower boundary near $60,000. At the time of writing, BTC is priced at approximately $75,908 per the chart — sitting above the $73,000 mid-range line but well below the $80,000 and $87,000 upper resistance levels. The pattern is still forming: price has not broken below $73,000, but it has not reclaimed the upper half of the channel either.
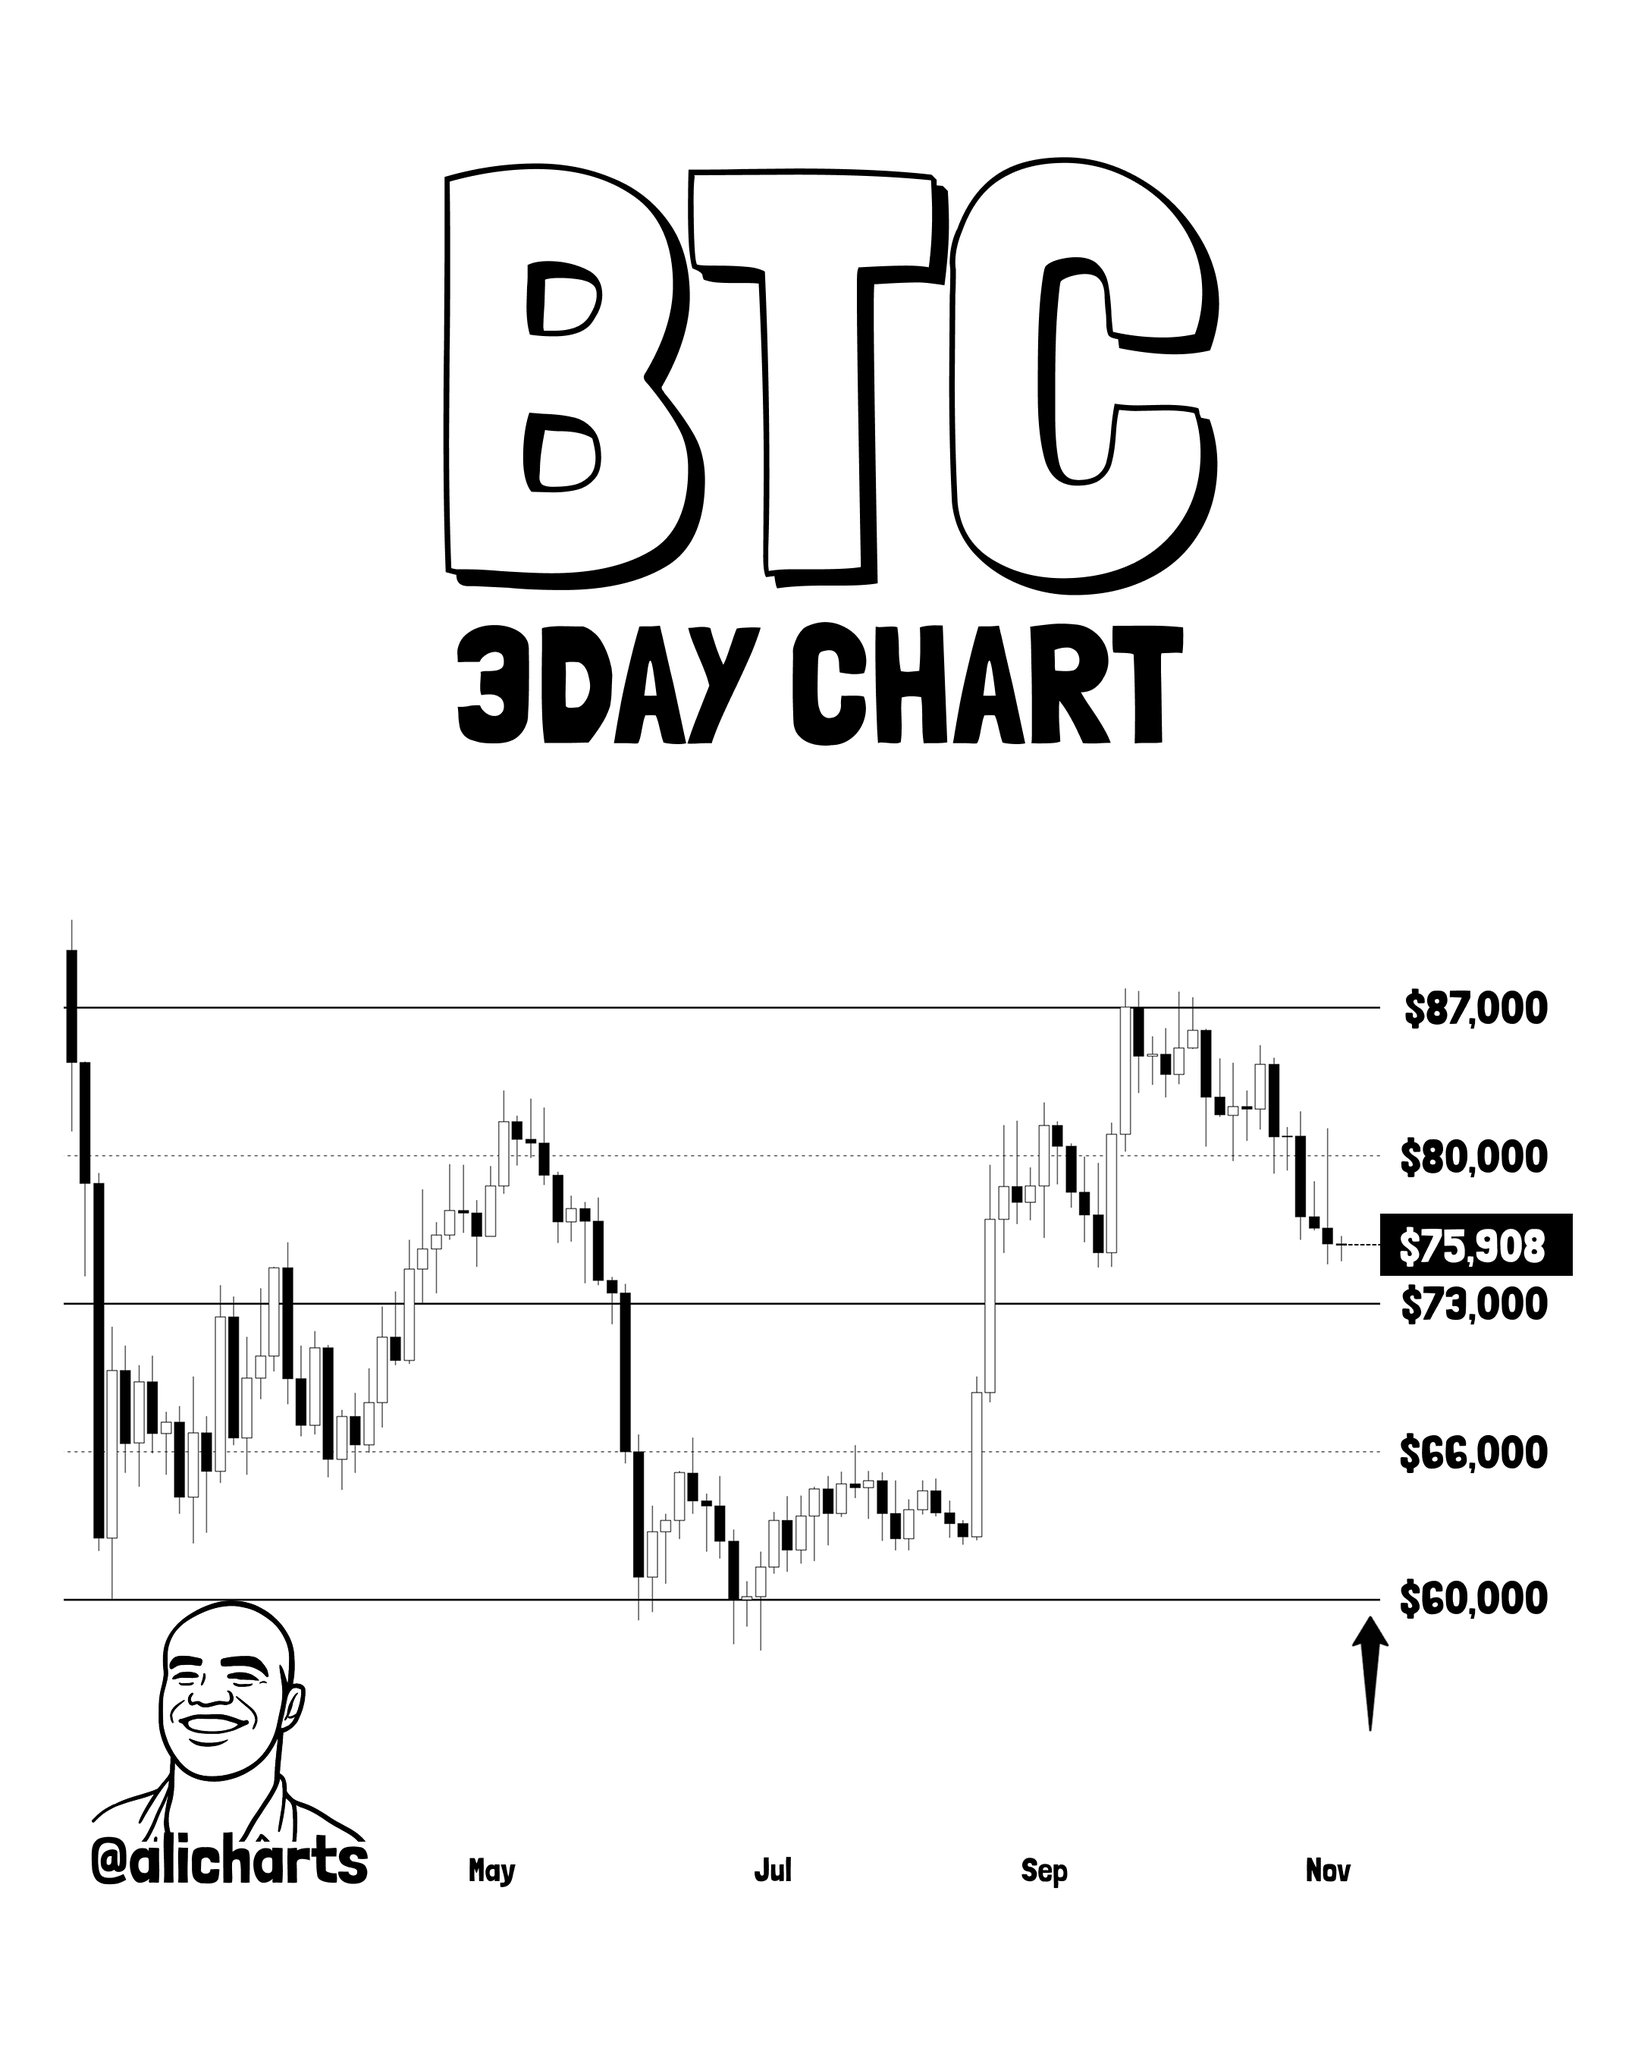
The critical variable is whether Bitcoin holds $73,000 on a closing basis. Per the analyst’s thread, a confirmed close beneath that mid-range level would remove the floor that has kept this a consolidation rather than a breakdown — and shift attention immediately to the lower channel boundary near $60,000. That is not a speculative target. It is the channel’s lower structural limit, visible across the full April–November price range on the three-day chart. The analyst places an upward arrow near the $60,000 zone, flagging it as a potential bounce area should the lower boundary be tested.
The takeaway for Bitcoin: the structure is neutral while $73,000 holds. Loss of that level on a three-day close converts the current consolidation into a confirmed breakdown with $60,000 as the next reference point.
Signal 2 — Ethereum: Breakdown Already Confirmed, $1,963 Is the Target
Ethereum’s setup is structurally more bearish than Bitcoin’s. On the daily chart, ETH has already broken down from a right-angled ascending broadening pattern — a formation where the lower boundary rises while the upper boundary remains flat, creating a widening wedge that resolved to the downside. The breakdown trigger was the loss of $2,385, which had served as the pattern’s lower support. The current price on the chart reads $2,227, confirming that price is now below $2,385, below $2,475, and well below the $2,807 upper resistance zone.
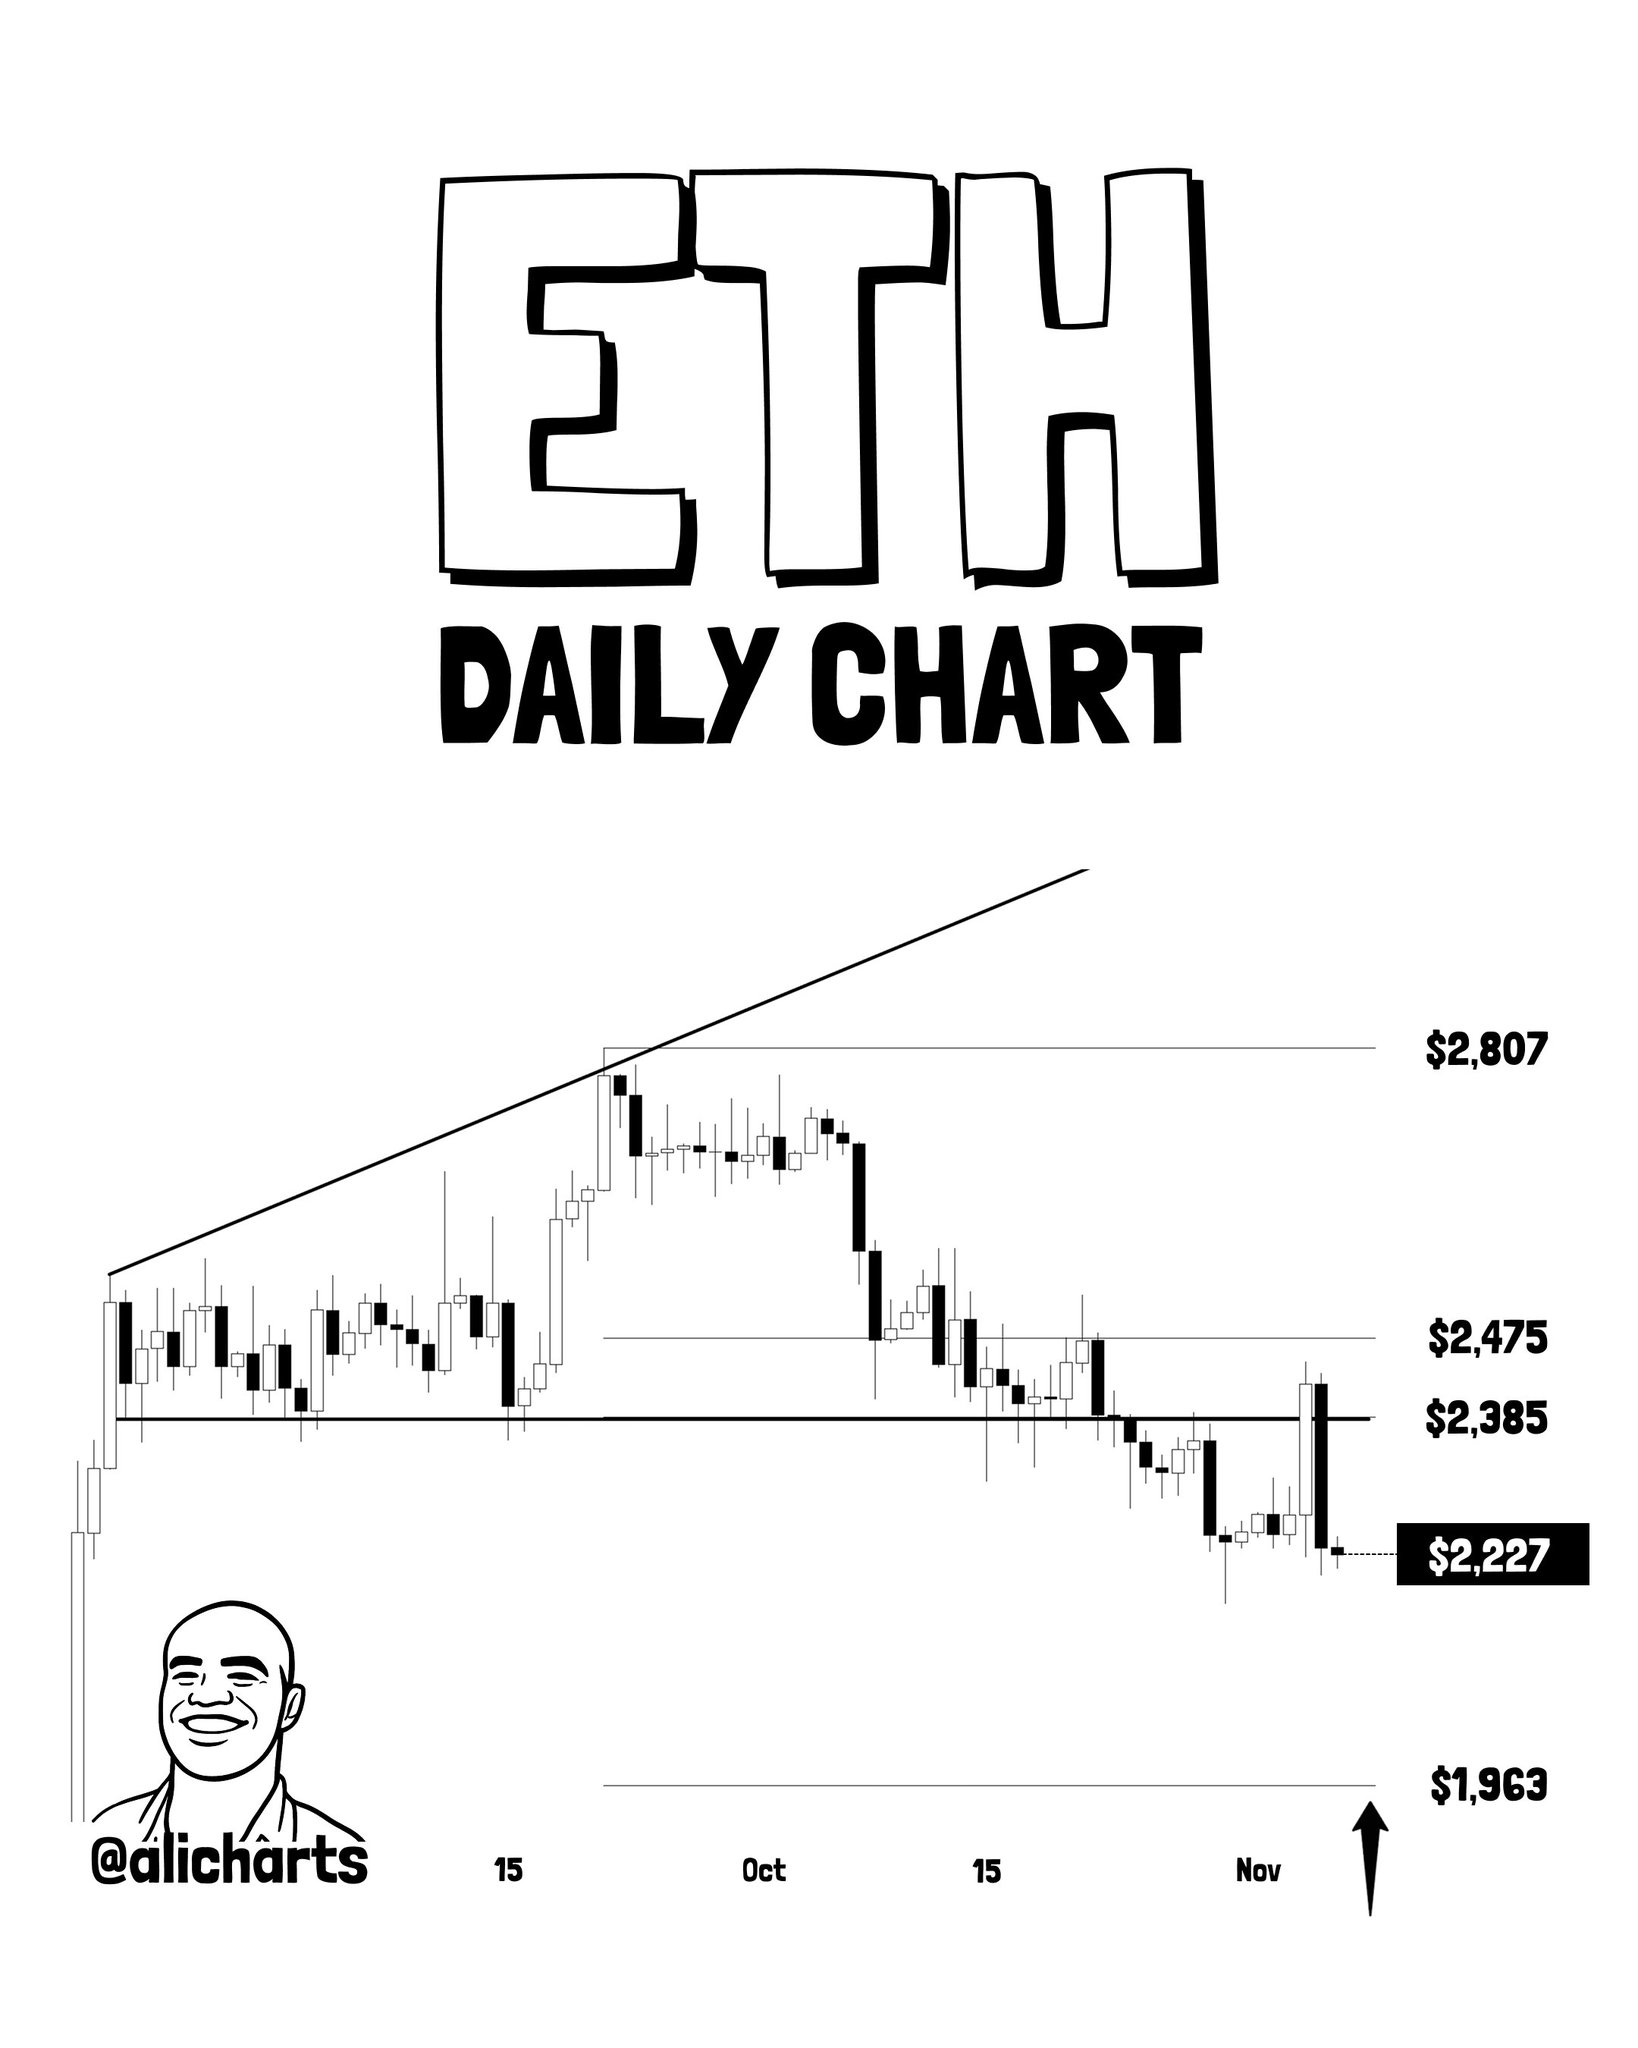
With the pattern breakdown confirmed and the rising trendline lower boundary also violated, the implied measured target from this structure is $1,963. That level is explicitly labeled on the analyst’s daily chart and represents the next area of structural significance. There is no near-term support flagged between $2,227 and $1,963 in the chart analysis. For Ethereum, the breakdown has already occurred — the question now is whether $1,963 acts as a floor or becomes the next level to give way if macro pressure persists.
It is worth noting that the broader market conditions amplifying this move — reduced expectations for aggressive Fed easing, weak chipmaker earnings, and the Binance security overhang — are not ETH-specific. They are systemic. That does not change the technical picture, but it does mean a macro stabilization could interrupt the measured target before it is fully reached. For now, the technical structure says $1,963.
Signal 3 — XRP: Mid-Channel Broken, Lower Boundary at $0.99
XRP’s three-day chart presents a situation that mirrors Bitcoin’s structure but with the breakdown already further along. The asset has been trading within a defined horizontal channel with an upper boundary, a lower boundary near $0.99, and a mid-range dotted reference line near $1.42. The current chart price reads $1.182 — which places XRP below the mid-channel support at $1.42, below the $1.29 level, but still above both the $1.13 label and the lower boundary at $0.99.
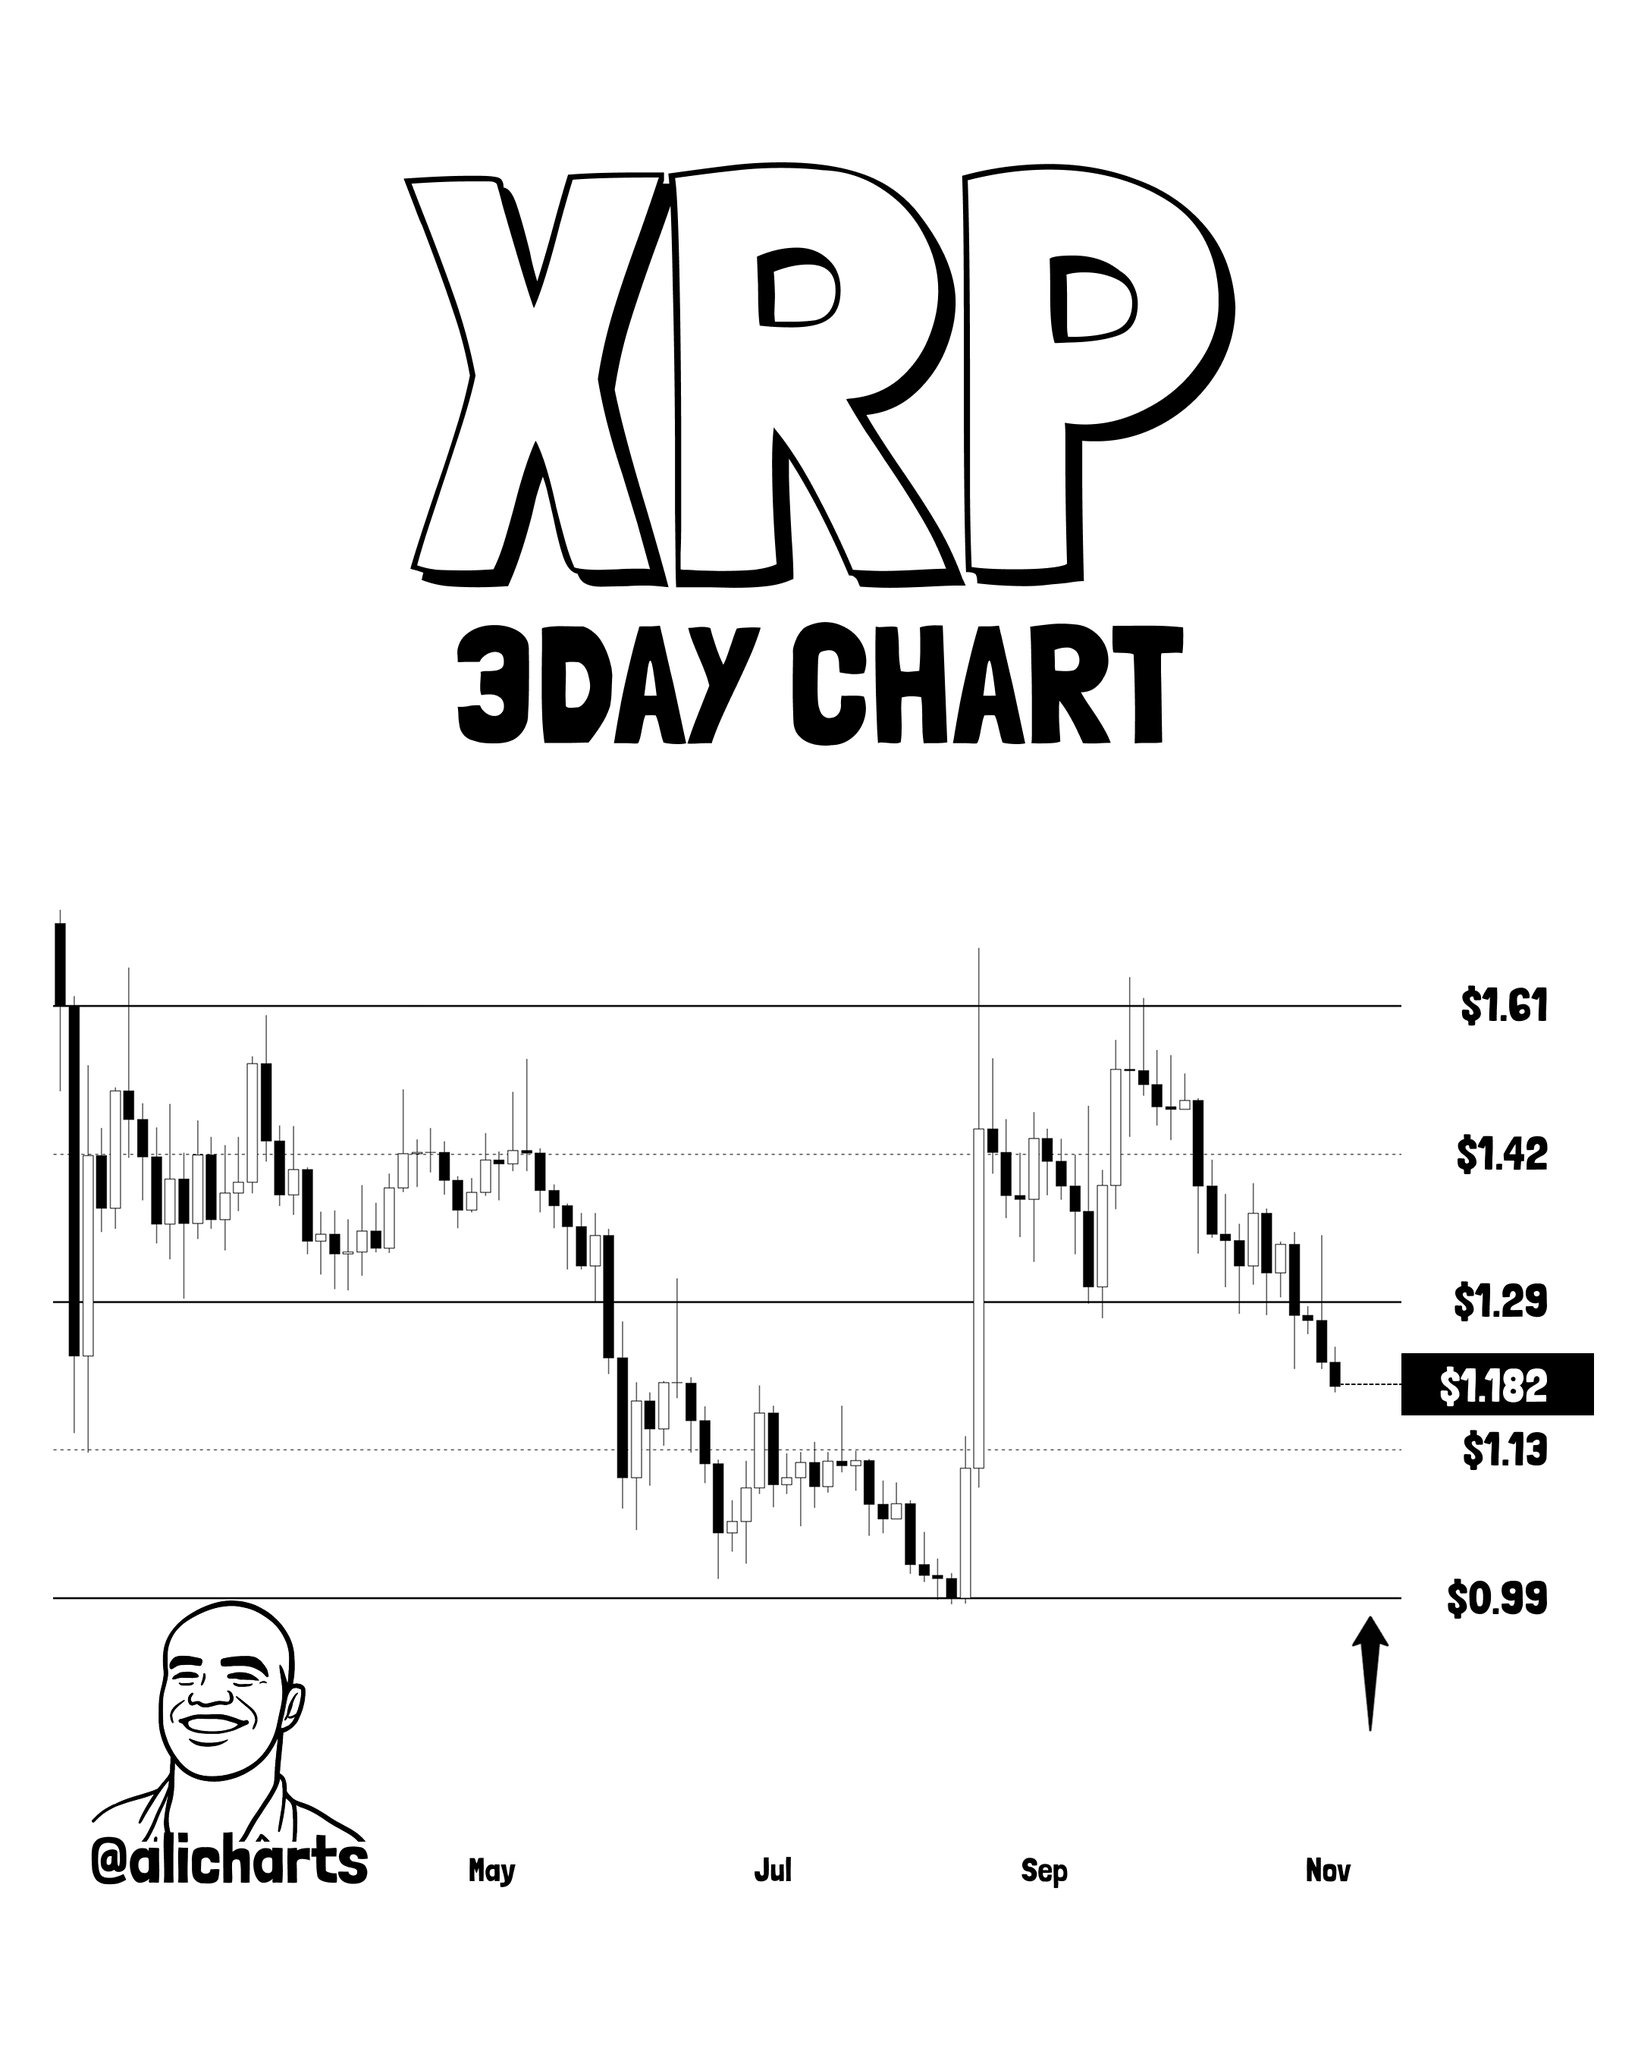
The breakdown from $1.42 and subsequently from $1.29 has already been confirmed. XRP is now in the lower half of its channel, trading between $1.13 and $1.29, with the analyst’s upward arrow near $0.99 indicating that the lower channel boundary is the next area under watch. As with the other assets, the structural risk is straightforward: if $0.99 fails to hold on a three-day closing basis, the channel itself is invalidated and the downside becomes structurally undefined.
XRP’s macro picture adds pressure of its own. The CLARITY Act and other crypto-friendly legislation are facing reassessment by traders following the congressional shift, and regulatory uncertainty has historically weighed disproportionately on XRP given its legal history. Meanwhile, XRP spot ETF data via SoSoValue shows the past five trading days produced net outflows of $530,000, with zero inflow days over that stretch — a sign that institutional demand from that channel is not currently providing a floor. Total ETF net assets stand at $1.34 billion, with cumulative net inflows of $1.81 billion since launch.
The Macro Context Driving All Three Lower
These are not isolated technical breakdowns. The research context is specific: a risk-off contagion wave originating in AI and semiconductor equities has spread into crypto, combined with reduced expectations for aggressive Federal Reserve rate cuts, the ongoing sentiment damage from the reported Binance security incident, and regulatory reassessment tied to the new congressional landscape. None of these catalysts point to an imminent reversal — which makes the technical levels flagged by the analyst genuinely consequential rather than hypothetical.
Key macro data to watch this week includes CPI (MoM and YoY) on November 9, Initial Jobless Claims on November 11, and PPI on November 12, per upcoming FRED releases. Any inflation surprise to the upside would further reduce rate-cut expectations and add macro headwind across all three assets. For those tracking whether this selloff deepens or stabilizes, those data points are as relevant as the chart levels themselves.
It is also worth noting that the TD Sequential buy signals that have recently appeared across other altcoins — covered separately for ENA, TAO, ATOM, and VVV — have not yet materialized for BTC, ETH, or XRP, meaning no momentum exhaustion signal is currently contradicting the bearish channel readings for these three majors.
The Three Levels That Define This Market
| Asset | Current Chart Price | Key Support | Lower Target if Lost |
|---|---|---|---|
| Bitcoin (BTC) | $75,908 | $73,000 | $60,000 |
| Ethereum (ETH) | $2,227 | Broken ($2,385) | $1,963 |
| XRP | $1.182 | $1.13 | $0.99 |
Key support and lower target levels | Source: @alicharts (X)
Ethereum has the least protection — its pattern breakdown is already confirmed and the measured target at $1,963 is active. Bitcoin retains structural neutrality as long as $73,000 holds on a three-day close. XRP sits in the most ambiguous position: mid-channel support is gone, the $1.29 level has failed, but the lower boundary at $0.99 has not yet been tested. Traders watching the broader altcoin market may also want to reference the SOL 200-day MA analysis for context on how oversold conditions are registering across the altcoin complex.
The current environment has produced the kind of multi-asset technical deterioration that tends to resolve in one direction simultaneously. Bitcoin’s $73,000 is the pivot. If it holds, the broader damage stays contained. If it fails, Ethereum’s $1,963 and XRP’s $0.99 become the working targets — and the next question becomes whether those levels hold or become the new breakdown triggers. Watch Bitcoin’s three-day close at $73,000 as the single most consequential data point in this setup.
Frequently Asked Questions
What happens to Bitcoin if it closes below $73,000 on the three-day chart?
Why is Ethereum’s downside target $1,963 specifically?
Has XRP already broken down, or is it still holding support?
What macro events could change this downside setup for all three assets?
Source: Ali Charts · Published by CoinsProbe Markets Desk
The opinions and market insights shared on CoinsProbe represent the views of individual authors based on prevailing market conditions at the time of publication. Cryptocurrency investments carry significant risk and volatility. Readers are encouraged to conduct their own research and seek professional financial advice before making investment decisions. CoinsProbe and its contributors do not accept responsibility for financial losses or decisions made based on published content.
CoinsProbe may publish sponsored articles, affiliate links, or promotional collaborations. All sponsored material is clearly labeled to maintain transparency with our audience. Our editorial decisions remain fully independent, and advertising partnerships do not influence reviews, rankings, or published opinions.
Since 2023, CoinsProbe has delivered reliable insights on cryptocurrency, blockchain, and digital assets. Our content is created by experienced researchers and analysts who follow strict editorial standards focused on accuracy, transparency, and credibility. Every article is carefully reviewed and verified using trusted sources and current market data. We provide unbiased analysis and timely updates covering everything from emerging crypto projects to major industry developments.