
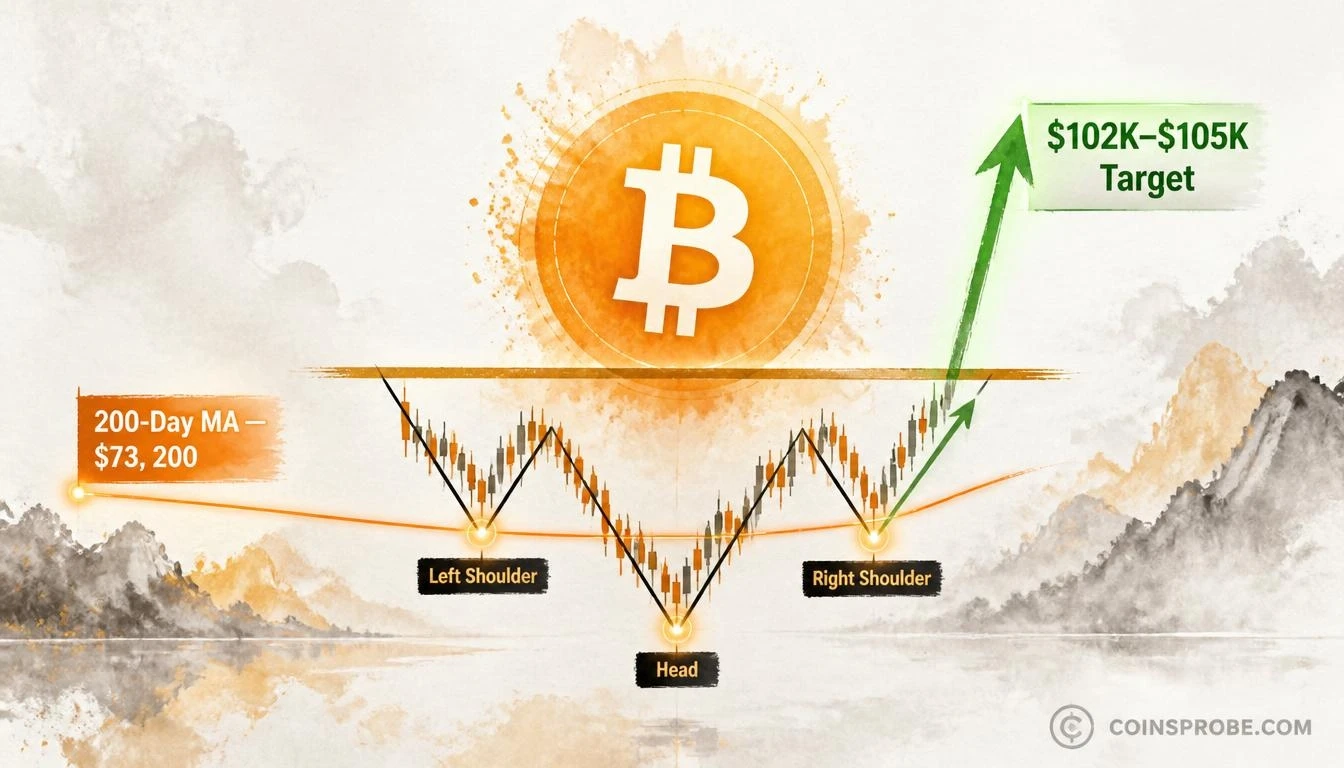
- Bitcoin trades at $75,912 — above MA200 at $73,200 but below the inverse H&S neckline resistance
- Analyst flagged this setup in September 2026: Higher High → 2-month correction → Right Shoulder near MA200 → December breakout window
- Neckline breakout target: $102,000–$105,000 measured move; MA200 at $73,200 is the structural invalidation level
- Spot ETFs saw -$411.9M net outflow on Nov 6, with -$1.28B over 5 days — institutional flow is the key variable to monitor
Bitcoin is trading at $75,912 — down 0.25% over the past 24 hours — with one structural level dominating the daily chart: the 200-day moving average, currently sitting at exactly $73,200. That level is not just a technical reference. According to one crypto analyst, it is the foundation of the Right Shoulder in an inverse Head and Shoulders pattern that has been building for months — and the neckline breakout, once confirmed, would complete the formation.
An analyst posting under @CryptoBullet1 updated followers on November 7, 2026, with a direct assessment of Bitcoin’s daily structure: “We’re almost there” — signaling that the current price action is approaching a critical inflection. The MA200 at $73,200 is the specific anchor cited. This update traces back to a call made on September 21, 2026, where the analyst had identified a Higher High confirmation and warned of a potential two-month correction window — a correction that appears to now be completing near the MA200 support zone.
The Inverse Head and Shoulders — Pattern Still Forming
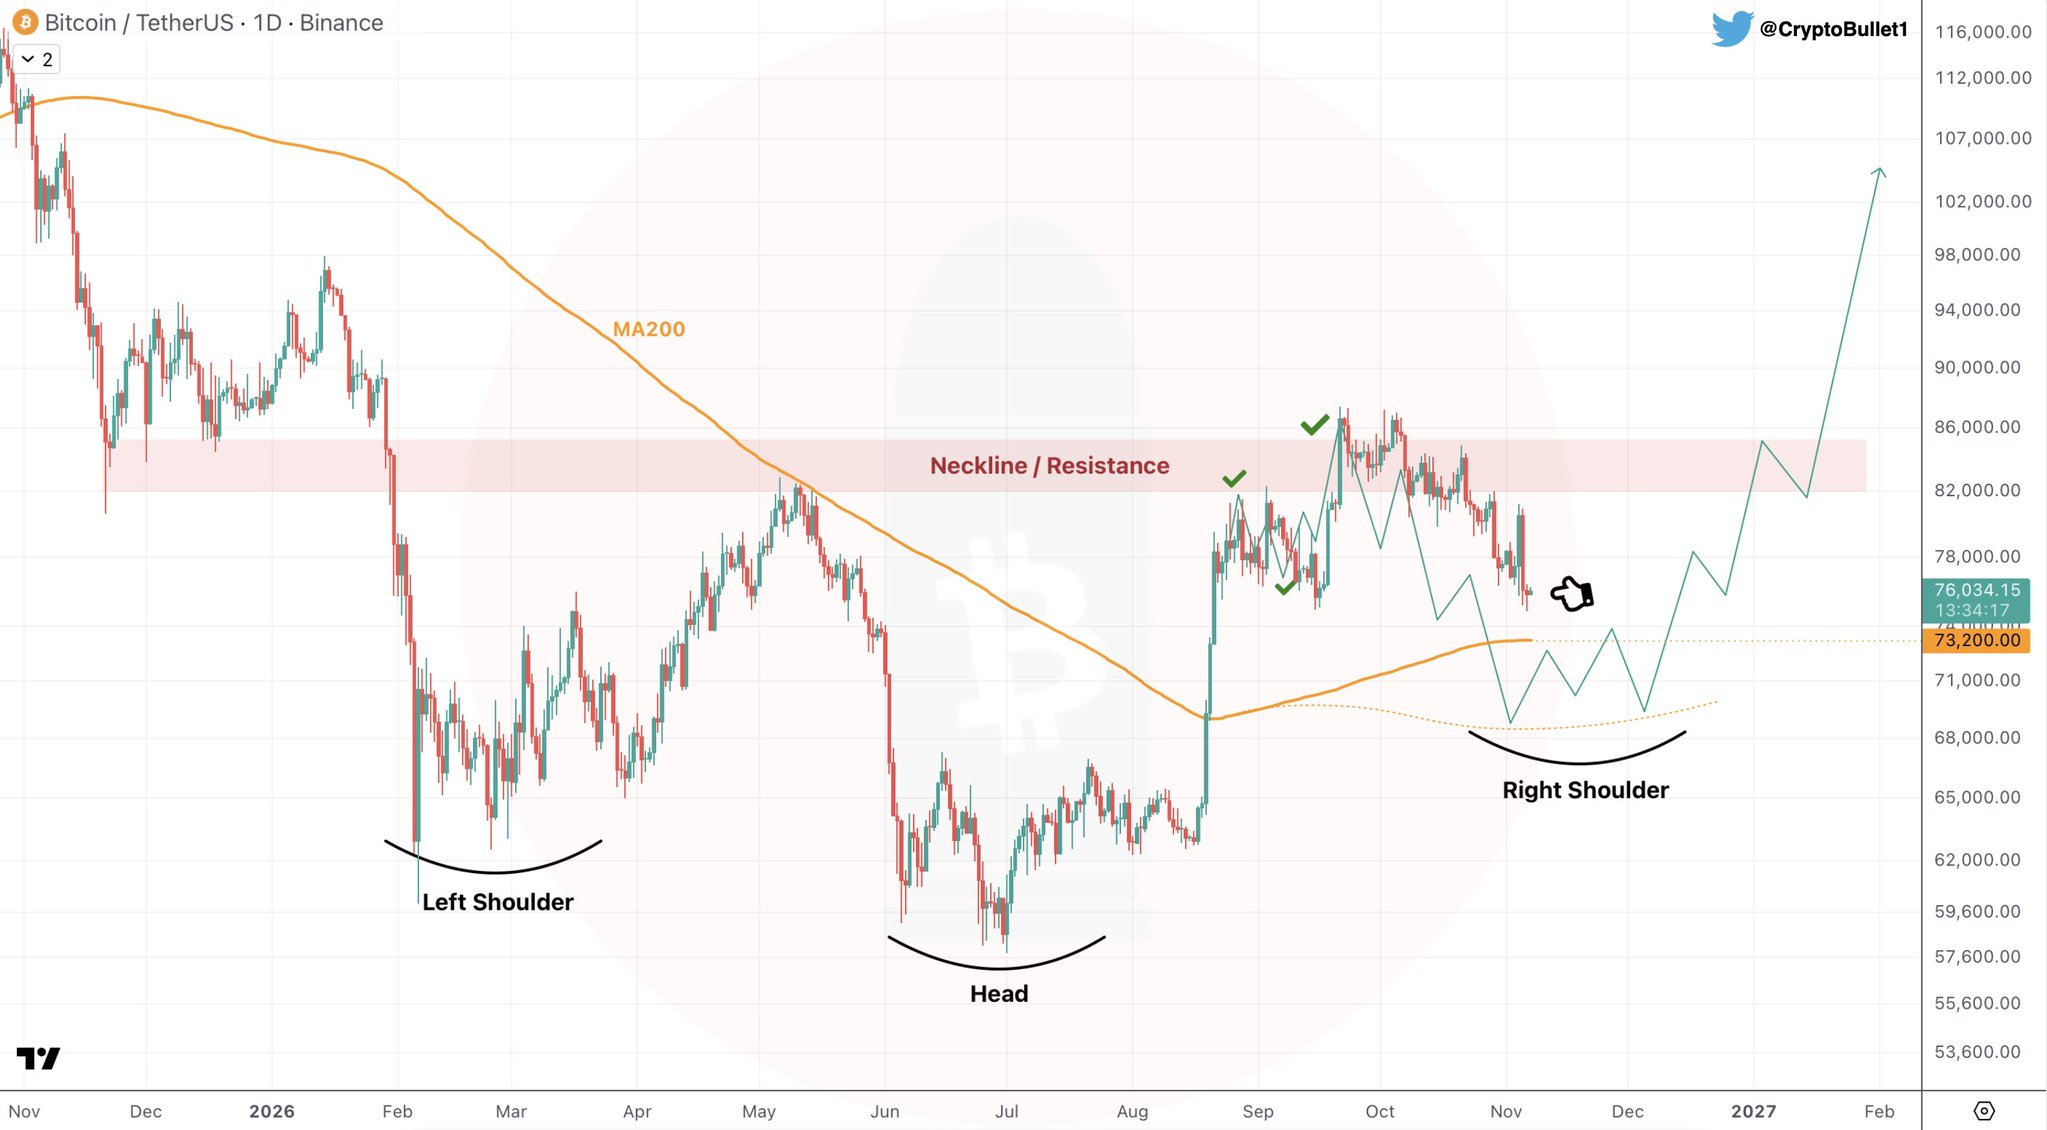
The daily chart shared by the analyst reveals an Inverse Head and Shoulders structure across three distinct troughs. The Left Shoulder and Head are fully formed, with the Head representing the deepest trough. The Right Shoulder is currently developing near the MA200 at $73,200 — with Bitcoin’s current price of $75,912 sitting above that moving average but still below the neckline resistance zone. This is a critical distinction: the pattern is not complete. Price has not broken the neckline. What the chart shows is the Right Shoulder forming with the MA200 as its structural floor.
The chart also marks two prior neckline tests — annotated with green checkmarks — where Bitcoin briefly spiked into the resistance zone but reversed back below it. These are fakeouts, not breakouts. The analyst’s projected breakout, once confirmed, points toward the $102,000–$105,000 range based on the arrow drawn on the chart. That is the measured-move target if and when the neckline gives way with conviction. The neckline has not been broken at the time of this writing.
The Road Here — September Call Revisited
The analyst’s September 21, 2026 post had flagged a Higher High confirmation and explicitly warned of a two-month correction to follow. That post itself referenced an earlier August 24, 2026 note which expressed skepticism about a mid-cycle pump — citing the CVDD and Realized Price levels as not yet aligned — before turning “100% bullish” from December 1, 2026 onward. The sequence laid out was: skepticism → Higher High → correction → possible Higher Low → inverse H&S breakout in the December–January window.
Bitcoin’s price action since September has tracked that roadmap. The two-month correction window is now closing, the Right Shoulder is forming near the MA200, and the analyst’s November 7 update — “We’re almost there” — signals that the pattern is approaching the phase where the correction ends and the breakout attempt begins. This context matters: the current dip to MA200 territory is the anticipated base of the Right Shoulder, not a breakdown signal. For more on how this target was established, see Bitcoin Hits the EMA200 — Analyst’s Predicted Target Reached at $77,676.
The MA200 at $73,200 — Why This Level Is Structural
The 200-day moving average is the most widely referenced long-term trend indicator in traditional and crypto markets. When Bitcoin trades above it, the market is in a structural uptrend. When it dips to test it — as it is doing now — the question is whether the level holds as support or breaks down. The analyst’s framing is explicit: at $73,200, the MA200 is not just a technical line. It is the Right Shoulder’s low. A sustained close below $73,200 would structurally damage the inverse H&S thesis. Prior to this setup developing, traders were watching this exact zone — as covered in Bitcoin Breaks Key Support — EMA200 Near $76K Now in Focus.
ETF Flows Add a Complicating Layer
Institutional data via SoSoValue adds important context. Bitcoin spot ETFs logged a net outflow of $411.9M on November 6 — the second consecutive day of outflows — with cumulative five-day net flows reaching -$1.28B across four of the last five trading sessions. IBIT alone accounted for $403.0M of the most recent day’s outflows, while FBTC bucked the trend with a $42.8M inflow. Total ETF net assets stand at $95.90B, with cumulative net inflows since launch at $55.70B.
The outflow context matters: sustained institutional selling into this price zone creates friction for any Right Shoulder base to hold. If outflows reverse as the pattern matures — particularly if IBIT sees inflows above $200M on a single day — that would constitute a meaningful signal that institutional demand is re-engaging near the MA200. That metric is worth tracking in real time via SoSoValue’s daily ETF flow data.
Separately, Strategy (formerly MicroStrategy) added 811 BTC for $65.5M in its latest purchase, bringing total holdings to 849,327 BTC as of November 2, 2026 — a steady accumulation signal that has not wavered through the correction.
Macro Overhang — FOMC Rate Path Pricing
Markets are pricing a 76.3% probability of a rate hike to 4.00%–4.25% at the December 9, 2026 FOMC meeting, per SoSoValue data. For January 27, 2027, the probability of a hike to 4.25%–4.50% stands at 15.8%, with a further 65.4% chance of a hold at 4.00%–4.25%. This rate path — tilted toward continued tightening — is the macro environment within which the inverse H&S breakout would need to occur. CPI data drops November 9, with PPI following on November 12, and Retail Sales on November 16. Any upside surprise in inflation data could extend the Right Shoulder base formation by pushing BTC lower toward — or potentially below — the $73,200 MA200.
The Level That Decides Everything
The structure is clear. The neckline resistance — where two prior fakeouts have already occurred — is the singular level that determines whether the inverse H&S resolves as a full breakout or stalls again. The analyst’s measured-move target of $102,000–$105,000 is contingent on a confirmed neckline break, not a touch. The MA200 at $73,200 is the Right Shoulder’s floor — the level that, if lost on a daily close, structurally invalidates the formation. At $75,912, Bitcoin sits in the zone the analyst has been anticipating: above MA200, below neckline, with the December–January breakout window approaching.
Watch $73,200 as the Right Shoulder’s invalidation floor — and the neckline as the only barrier between the current pattern and a measured move toward $102,000–$105,000.
Frequently Asked Questions
What is the MA200 for Bitcoin right now and why does it matter?
What is the price target if Bitcoin breaks the inverse H&S neckline?
What is the December 1 significance mentioned in the analyst’s prior posts?
How do the Bitcoin ETF outflows affect this chart setup?
Source: Cryptobullet1 · Published by CoinsProbe Markets Desk
The opinions and market insights shared on CoinsProbe represent the views of individual authors based on prevailing market conditions at the time of publication. Cryptocurrency investments carry significant risk and volatility. Readers are encouraged to conduct their own research and seek professional financial advice before making investment decisions. CoinsProbe and its contributors do not accept responsibility for financial losses or decisions made based on published content.
CoinsProbe may publish sponsored articles, affiliate links, or promotional collaborations. All sponsored material is clearly labeled to maintain transparency with our audience. Our editorial decisions remain fully independent, and advertising partnerships do not influence reviews, rankings, or published opinions.
Since 2023, CoinsProbe has delivered reliable insights on cryptocurrency, blockchain, and digital assets. Our content is created by experienced researchers and analysts who follow strict editorial standards focused on accuracy, transparency, and credibility. Every article is carefully reviewed and verified using trusted sources and current market data. We provide unbiased analysis and timely updates covering everything from emerging crypto projects to major industry developments.