- BTC trades at $79,766 (-0.72% 24h) after confirming a support zone breakdown flagged by @CryptoBullet1 on Oct 23
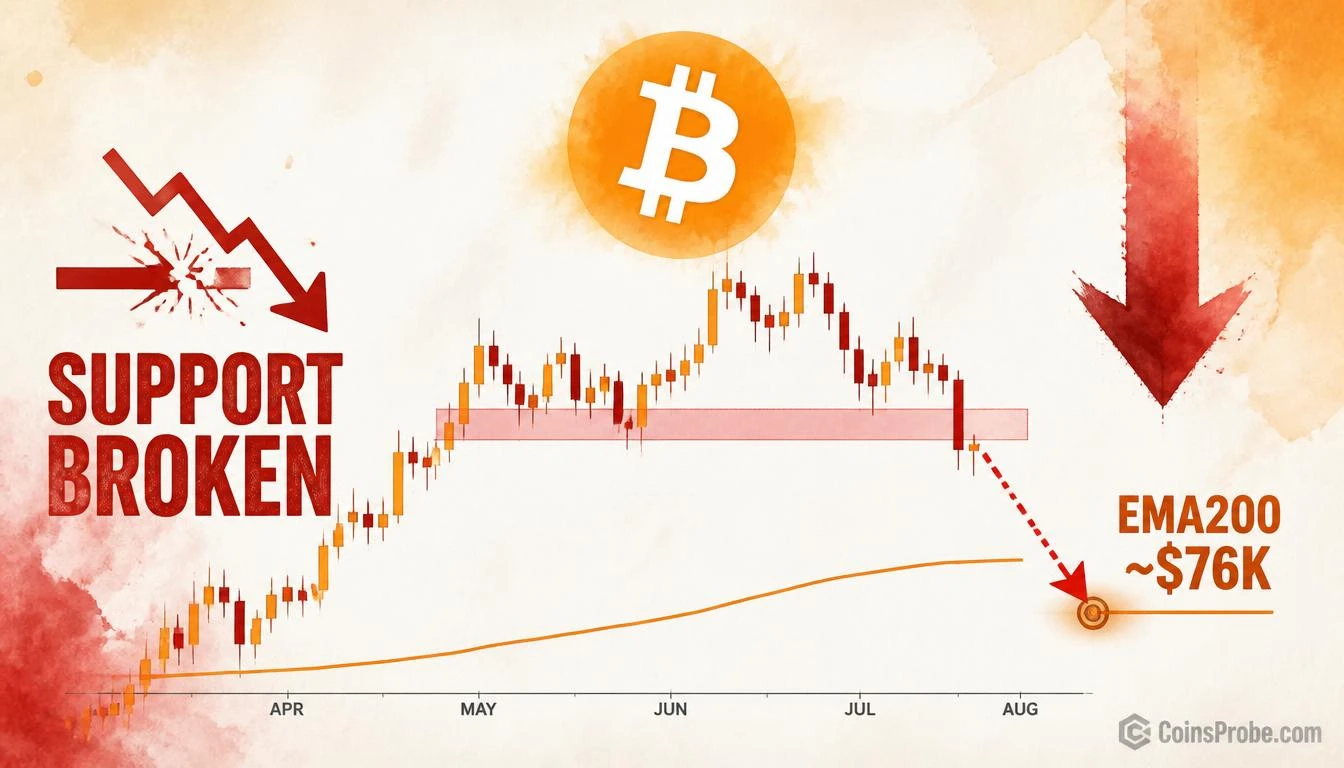
- EMA200 near $76,000 is the next structural target per the annotated chart — no printed numeric target, directional call is structural
- Spot BTC ETFs recorded $137.9M net outflow on Oct 23, led by IBIT (-$110.3M) — two consecutive outflow days per SoSoValue
- Core PCE and GDP data drop Oct 28 alongside FOMC meeting (90.6% hold probability) — highest-risk macro window of the week
Bitcoin is trading at $79,766 — down 0.72% in the past 24 hours and carrying a market cap of $1.60 trillion — after confirming a breakdown that analyst @CryptoBullet1 had flagged three days in advance. The support zone that had held price since late September is now a confirmed failure, with the 200-day Exponential Moving Average (EMA200) emerging as the next structural reference point to the downside.
On October 23, 2026, @CryptoBullet1 posted that Bitcoin was “hanging by a thread” and explicitly called for a bearish resolution. On October 26, the follow-up confirmation arrived: “$BTC broke the support as expected.” The breakdown was not a surprise — it was a forecast fulfilled.
The Breakdown — What the Chart Shows
The daily Coinbase BTC/USD chart shared by @CryptoBullet1 tells a straightforward story. A horizontal pink-shaded support zone had acted as a ceiling and then a floor through the May–December visible range. Price peaked, consolidated near the upper boundary of that zone, and has now closed below it — confirming the breakdown. A dotted arrow on the chart points downward from the current price label of $79,819.68 toward the EMA200, which sits visually near the $76,000 area on the chart. No specific percentage target is printed on the chart — the directional call is structural, not a precise number.
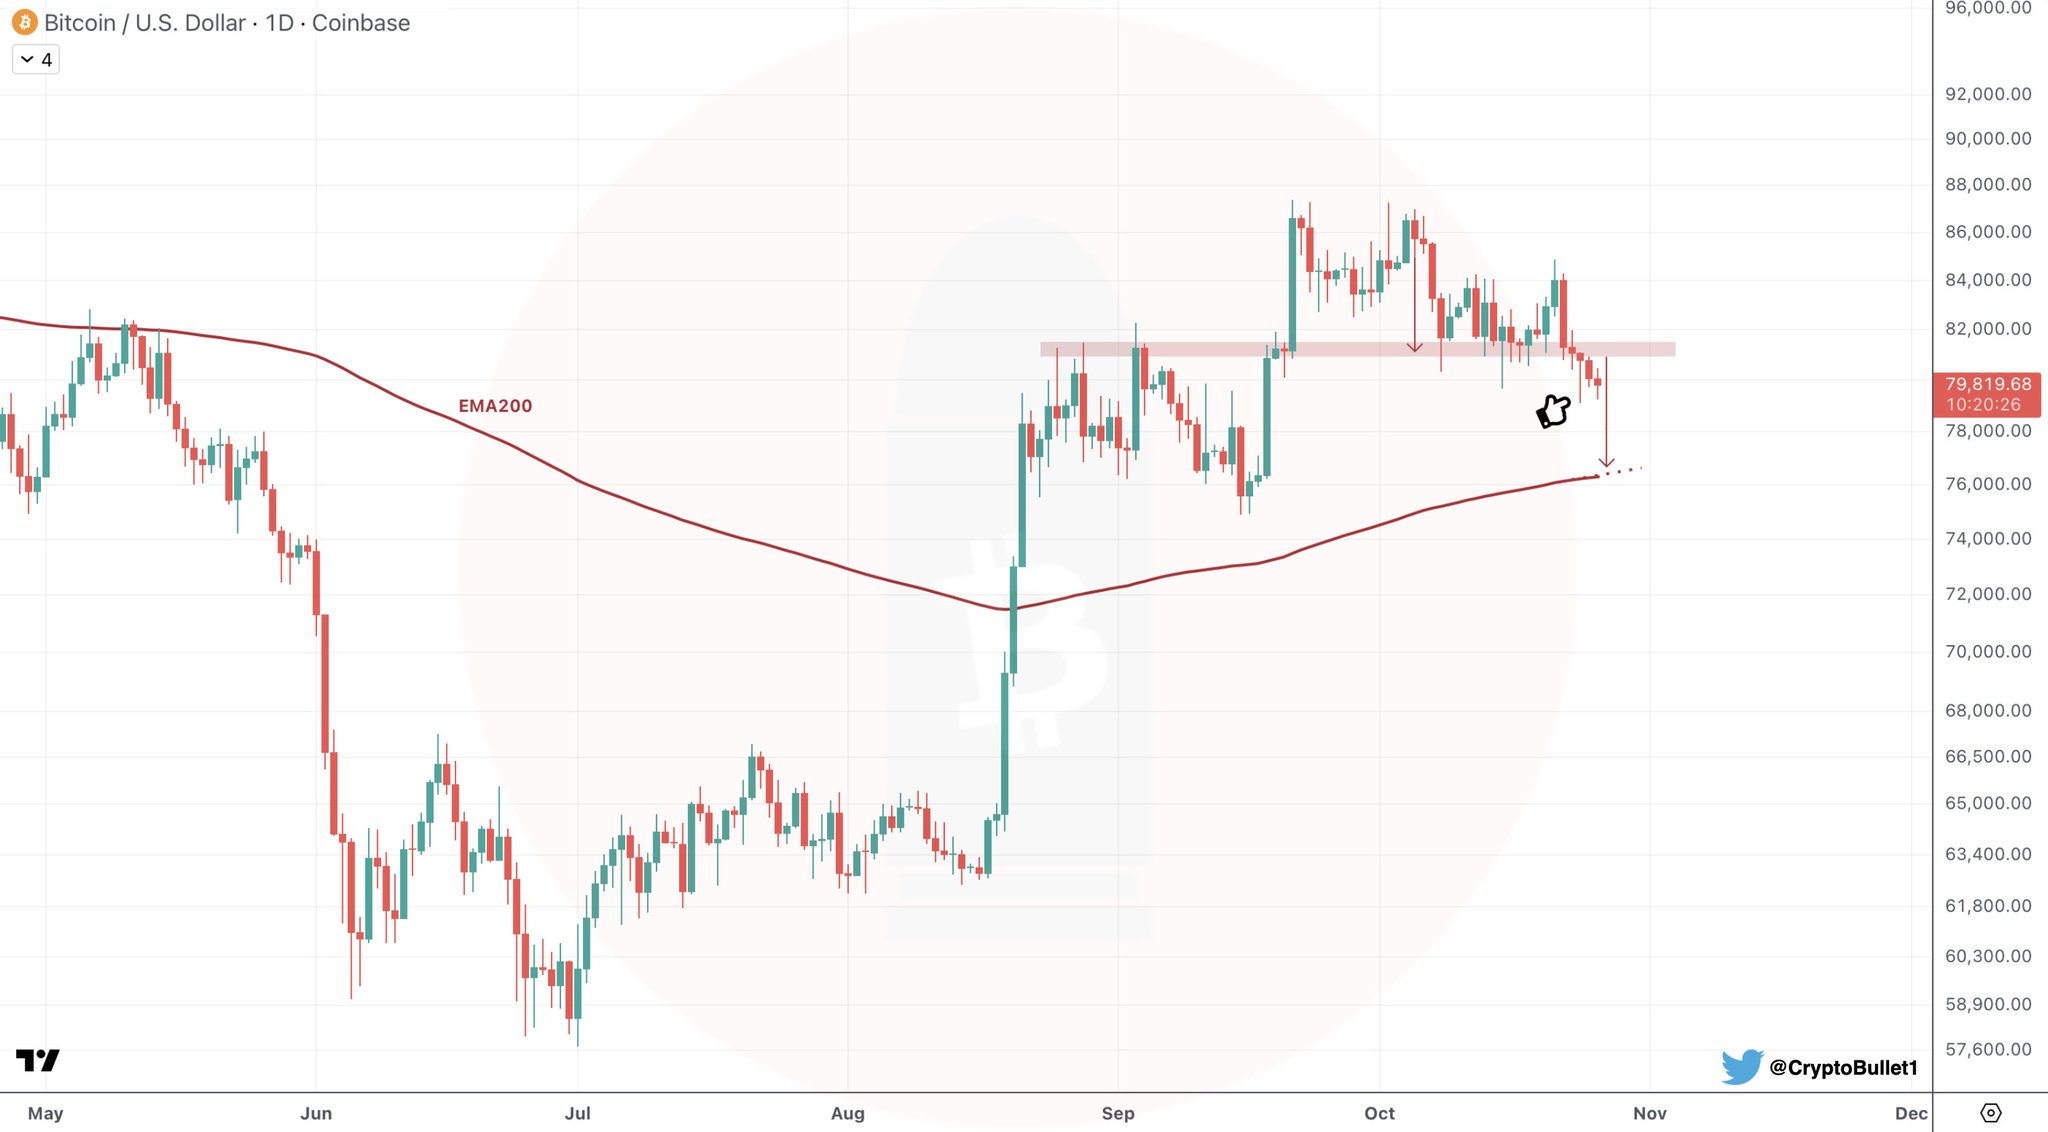
The EMA200 is a widely watched long-term trend filter. When price trades above the EMA200, the broad trend is considered bullish. When price breaks below it, the regime shifts. Bitcoin is currently above the EMA200 — but the chart’s dotted arrow signals that @CryptoBullet1 views continued downside toward that level as the base case. A close below the EMA200 would represent a materially different technical environment than what has prevailed through most of 2026. For additional context on the broader channel structure that preceded this breakdown, see Bitcoin Channel Breakdown — $82K Resistance, $72.5K Buy Zone.
ETF Flows Add Institutional Pressure
The technical breakdown is not occurring in a vacuum. Spot Bitcoin ETF data via SoSoValue shows a $137.9M net outflow on the latest trading date (October 23), with two consecutive outflow days now on record. BlackRock’s IBIT led the exit with $110.3M in outflows, followed by Fidelity’s FBTC at $31.8M. Total ETF net assets stand at $104.43B — still substantial, but the two-day streak of institutional selling aligns directly with the support failure seen on the chart. The past five trading days produced a net $304.7M inflow when averaged across all sessions, but the directional shift in the final two days carries more timing relevance to this week’s price action.
Strategy (formerly MicroStrategy) remains a counterweight. The firm holds 848,517 BTC as of October 19 and added 267 BTC for $22.1M in its most recent purchase — signaling that at least one large structural buyer continues to accumulate. But corporate treasury demand has not been enough to prevent the technical support from breaking.
Macro Events This Week Could Determine the Follow-Through
The week of October 26 carries significant macro weight. Core PCE Price Index data — the Federal Reserve’s preferred inflation gauge — drops on October 28 alongside Q3 GDP (QoQ). These are the two most market-sensitive data releases remaining before the October 28 FOMC meeting, where markets currently price a 90.6% probability of rates holding at the 3.75%–4.00% target range, per SoSoValue. A hotter-than-expected Core PCE print would compress rate-cut expectations further and introduce additional risk-off pressure into an already technically weakened BTC structure. GDP surprise in either direction adds to the volatility profile. The November 1 ISM Manufacturing PMI and November 3 Services PMI follow shortly after — this is a dense macro calendar landing directly on a broken-support BTC chart.
Bearish Scenario
If Bitcoin fails to reclaim the broken support zone (approximately the $80,000–$82,000 band visible on the chart) on a daily closing basis, the EMA200 near the $76,000 area becomes the next logical destination. A close below the EMA200 would shift the dominant trend structure bearish for the first time in this cycle leg. A broader retest of the $72,500 buy zone flagged by prior analysts cannot be ruled out in that scenario.
Bullish Scenario
A swift reclaim of the broken support zone on a daily close — accompanied by a reversal in ETF flows back to net positive — would invalidate the breakdown and shift the near-term bias back toward neutral-to-bullish. @CryptoBullet1’s October 23 call was premised on the support failing; if that failure is rapidly absorbed and reversed, the bearish thesis loses its structural basis. Reclaiming the zone would put the prior range highs back in play.
The setup is mechanical at this stage. Bitcoin broke where @CryptoBullet1 said it would break, and the EMA200 — sitting approximately 5% below current prices — is now the most watched structural level on the chart. This week’s Core PCE and GDP data arrive on October 28: a risk-on macro read could provide the bid needed to reclaim support; a risk-off read amplifies the breakdown. Watch the daily close relative to the broken support zone as the first line of confirmation in either direction.
Frequently Asked Questions
What does it mean that Bitcoin broke its support zone?
Where is Bitcoin’s EMA200 and why does it matter here?
Are Bitcoin ETF outflows connected to this breakdown?
What would invalidate the bearish breakdown thesis?
Source: Cryptobullet1 · Published by CoinsProbe Markets Desk
The opinions and market insights shared on CoinsProbe represent the views of individual authors based on prevailing market conditions at the time of publication. Cryptocurrency investments carry significant risk and volatility. Readers are encouraged to conduct their own research and seek professional financial advice before making investment decisions. CoinsProbe and its contributors do not accept responsibility for financial losses or decisions made based on published content.
CoinsProbe may publish sponsored articles, affiliate links, or promotional collaborations. All sponsored material is clearly labeled to maintain transparency with our audience. Our editorial decisions remain fully independent, and advertising partnerships do not influence reviews, rankings, or published opinions.
Since 2023, CoinsProbe has delivered reliable insights on cryptocurrency, blockchain, and digital assets. Our content is created by experienced researchers and analysts who follow strict editorial standards focused on accuracy, transparency, and credibility. Every article is carefully reviewed and verified using trusted sources and current market data. We provide unbiased analysis and timely updates covering everything from emerging crypto projects to major industry developments.