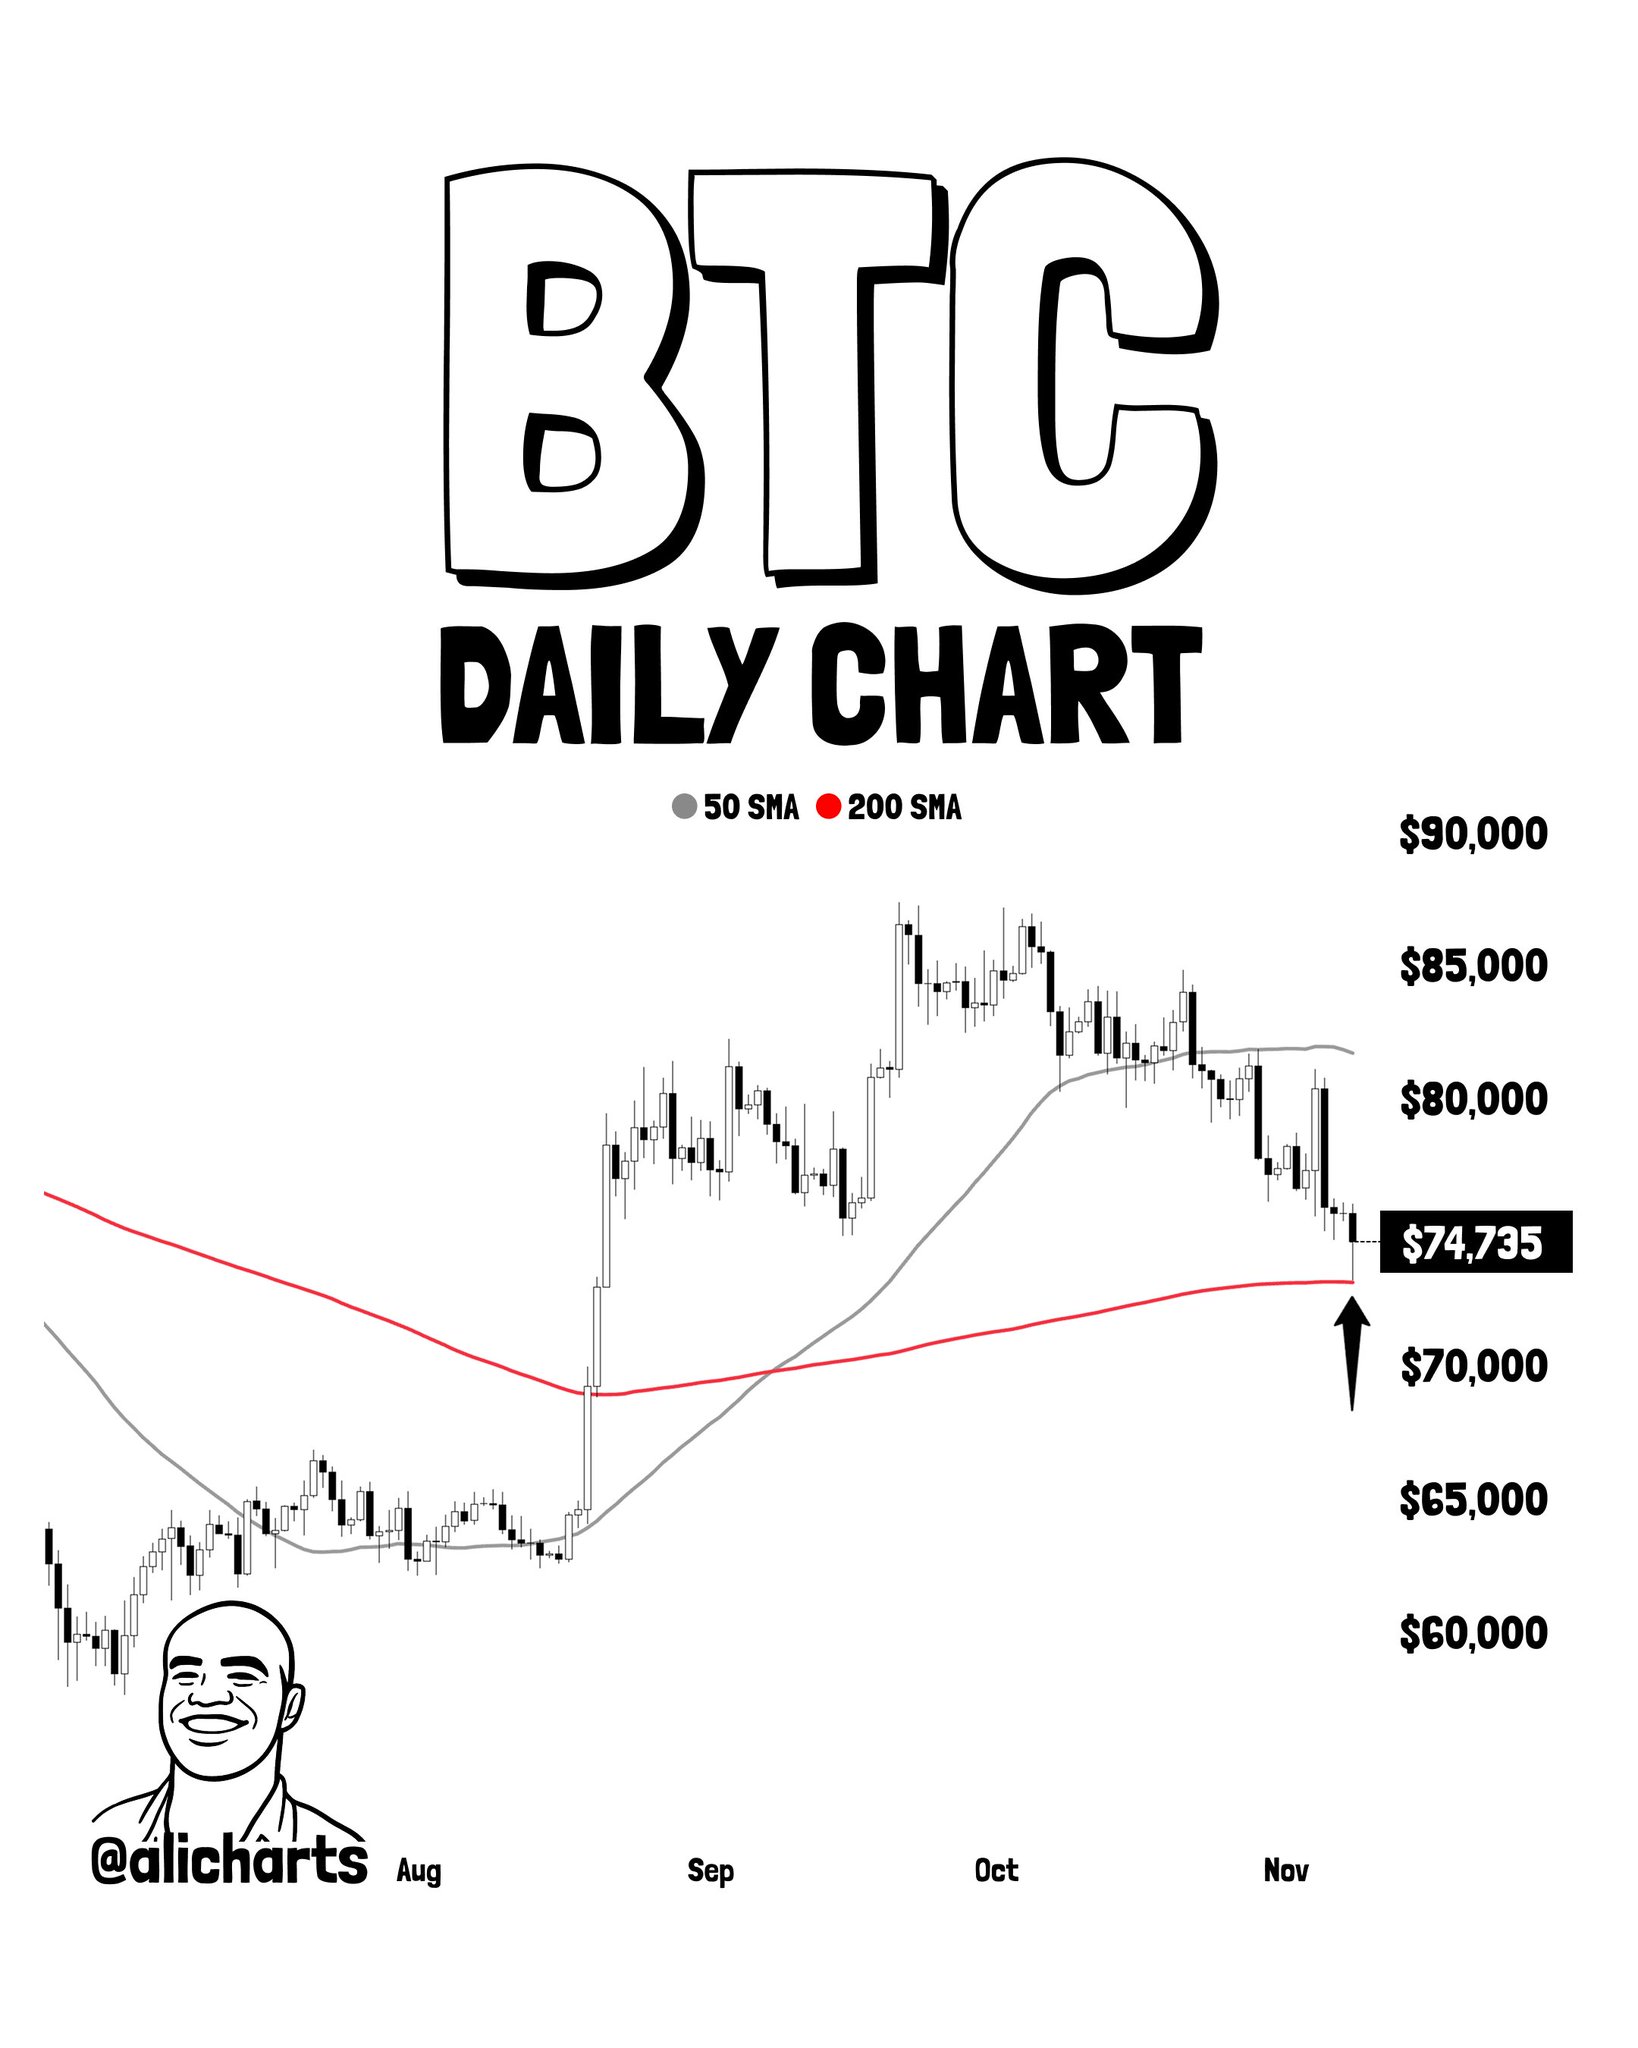
- BTC is trading at $74,374 (-1.80% 24h) and holding the 200-day SMA as dynamic support per @alicharts
- Bitcoin spot ETFs recorded $1.28B net outflow over the past 5 sessions, including a single-day $411.9M outflow led by IBIT per SoSoValue
- Markets price 78.5% probability of a December FOMC rate hike to 4.00%–4.25%, a macro headwind for risk assets
- Watch the daily close above or below the 200-day SMA — that is the structural line between dip and regime change
Bitcoin is trading at $74,374 — down 1.80% over the past 24 hours — and sitting directly on one of the most closely watched technical levels in macro investing: the 200-day simple moving average. That the price held this level rather than slicing through it is the entire basis for a fresh bullish call from one of crypto’s most followed chart analysts.
An analyst posting under @alicharts flagged the 200-day SMA hold on the daily chart on November 9, 2026, writing: “LAST CHANCE TO BUY THE BITCOIN DIP? It was the 200-day SMA. $BTC held it. Now the rebound begins.” The call was reinforced by an earlier post from the same account that same day simply reading “BUY THE DIP” — suggesting conviction behind the signal, not a tentative observation.
The 200-Day SMA — What It Actually Measures
The 200-day simple moving average is not a momentum indicator. It does not predict direction. It is a smoothed representation of Bitcoin’s average closing price across the previous 200 trading sessions — a level that institutional traders, macro funds, and long-term allocators treat as the boundary between structural bull and bear regimes. When price holds above it, the dominant interpretation is that the broader trend remains intact. When price decisively breaks below it and fails to reclaim it, the same community treats that as a regime change.
What the analyst is highlighting is not that Bitcoin crossed a threshold — it is that Bitcoin touched the 200-day SMA and did not close below it. That is the distinction between a dip and a breakdown. The daily chart shared by the analyst shows BTC made a sharp rally from September 2026 lows into the $85,000–$87,000 zone, then pulled back steeply in a rounded topping structure before arriving at the 200-day SMA. At the time of publication, price is sitting AT the 200-day SMA while remaining below the 50-day SMA — meaning the near-term trend is under pressure, but the macro structural level has not been violated.
The Macro and Institutional Context
The chart signal does not exist in a vacuum. Spot Bitcoin ETF flow data via SoSoValue paints a conflicting picture that adds important nuance. Over the past five trading sessions, Bitcoin ETFs have recorded a net outflow of $1.28 billion, with four of the five days showing net selling. The most recent trading day logged a $411.9M net outflow — led by IBIT shedding $403.0M in a single session. FBTC was the sole fund in positive territory, absorbing $42.8M in inflows. Total ETF net assets stand at $95.90B, with cumulative net inflows since launch holding at $55.70B — a figure that confirms structural institutional participation even if near-term flows are negative.
The ETF outflow data is worth reading carefully alongside the chart. Sustained institutional selling into a 200-day SMA test raises the question of whether this is a dip or the beginning of a deeper rotation. The analyst’s call is based on the chart hold — not on flow confirmation. That gap between technical signal and flow reality is what traders need to monitor in sessions ahead. As previously covered here on CoinsProbe, the 200-day SMA zone has acted as a critical structural level with broader pattern implications — context that makes this test particularly significant.
On the macro side, markets are pricing a 78.5% probability of a rate hike at the December 9 FOMC meeting — moving from the current 3.75%–4.00% range to 4.00%–4.25% — per SoSoValue data. That is a tightening expectation, not an easing one, and it creates a headwind for risk assets including Bitcoin. The November 10 CPI print is the nearest scheduled macro event that could shift that probability either direction.
Strategy (formerly MicroStrategy) continues to accumulate regardless of near-term volatility, adding 811 BTC for $65.5M in its most recent purchase and holding a total of 849,327 BTC as of November 2, 2026, per SoSoValue. That conviction at the institutional level provides a floor argument — but it is a fundamental one, not a technical trigger. Meanwhile, Bitcoin’s supply velocity has reached decade lows, a structural condition that historically accompanies reduced selling pressure from long-term holders.
What the Signal Says — and What It Does Not
The analyst’s signal is a 200-day SMA hold on the daily timeframe. That is the complete technical claim. What it says with precision: Bitcoin touched a historically significant dynamic support level and did not close below it on a daily basis. What it does not say: how deep any rebound will be, whether the 50-day SMA at approximately $80,000–$85,000 will be reclaimed, or whether the broader rally from September lows remains structurally intact. The pattern is still forming. No breakout above the 50-day SMA has been confirmed. The analyst anticipates a bounce, but price must actually reclaim higher structure before that call is validated by price action.
It is also worth noting that Bitcoin has tested and held the 200-day SMA multiple times across this cycle — each test produced a different magnitude of response. The current test at approximately $74,374 arrives with ETF outflows accelerating and macro headwinds building, which makes the quality of any rebound — not just its existence — the more important variable to track. For further context on downside risk levels across the market, CoinsProbe’s earlier analysis mapped the key levels for BTC, ETH, and XRP.
Bullish Scenario — Reclaim of the 50-Day SMA
If Bitcoin holds the 200-day SMA on a daily closing basis and begins recovering toward the $80,000–$85,000 zone, reclaiming the 50-day SMA would confirm the analyst’s “rebound begins” thesis and open the path back toward the prior cycle highs near $87,000. ETF flows turning net positive — particularly IBIT reversing its current outflow streak — would serve as institutional confirmation of the technical signal.
Bearish Scenario — Loss of the 200-Day SMA
A daily close below the 200-day SMA would invalidate the analyst’s call outright. Combined with the current ETF outflow trend and tightening macro expectations, a sustained break below this level would shift the structural reading from “dip within a bull market” to a potential regime change — a materially different setup requiring a re-evaluation of the broader trend.
The 200-day SMA hold is on the board. The rebound the analyst calls for has not yet materialized in price. Bitcoin is at $74,374 — sitting directly at the level that separates structural bull from structural bear. Watch the daily close: a sustained hold above the 200-day SMA keeps the dip-buy thesis alive. A close below it removes it entirely.
Source: x.comFrequently Asked Questions
What does the 200-day SMA hold mean for Bitcoin right now?
Why are Bitcoin ETF outflows important when the chart shows a buy signal?
What would invalidate the analyst’s dip-buy call?
What is the next macro event that could move Bitcoin off the 200-day SMA?
Source: Ali Charts · Published by CoinsProbe Markets Desk
The opinions and market insights shared on CoinsProbe represent the views of individual authors based on prevailing market conditions at the time of publication. Cryptocurrency investments carry significant risk and volatility. Readers are encouraged to conduct their own research and seek professional financial advice before making investment decisions. CoinsProbe and its contributors do not accept responsibility for financial losses or decisions made based on published content.
CoinsProbe may publish sponsored articles, affiliate links, or promotional collaborations. All sponsored material is clearly labeled to maintain transparency with our audience. Our editorial decisions remain fully independent, and advertising partnerships do not influence reviews, rankings, or published opinions.
Since 2023, CoinsProbe has delivered reliable insights on cryptocurrency, blockchain, and digital assets. Our content is created by experienced researchers and analysts who follow strict editorial standards focused on accuracy, transparency, and credibility. Every article is carefully reviewed and verified using trusted sources and current market data. We provide unbiased analysis and timely updates covering everything from emerging crypto projects to major industry developments.