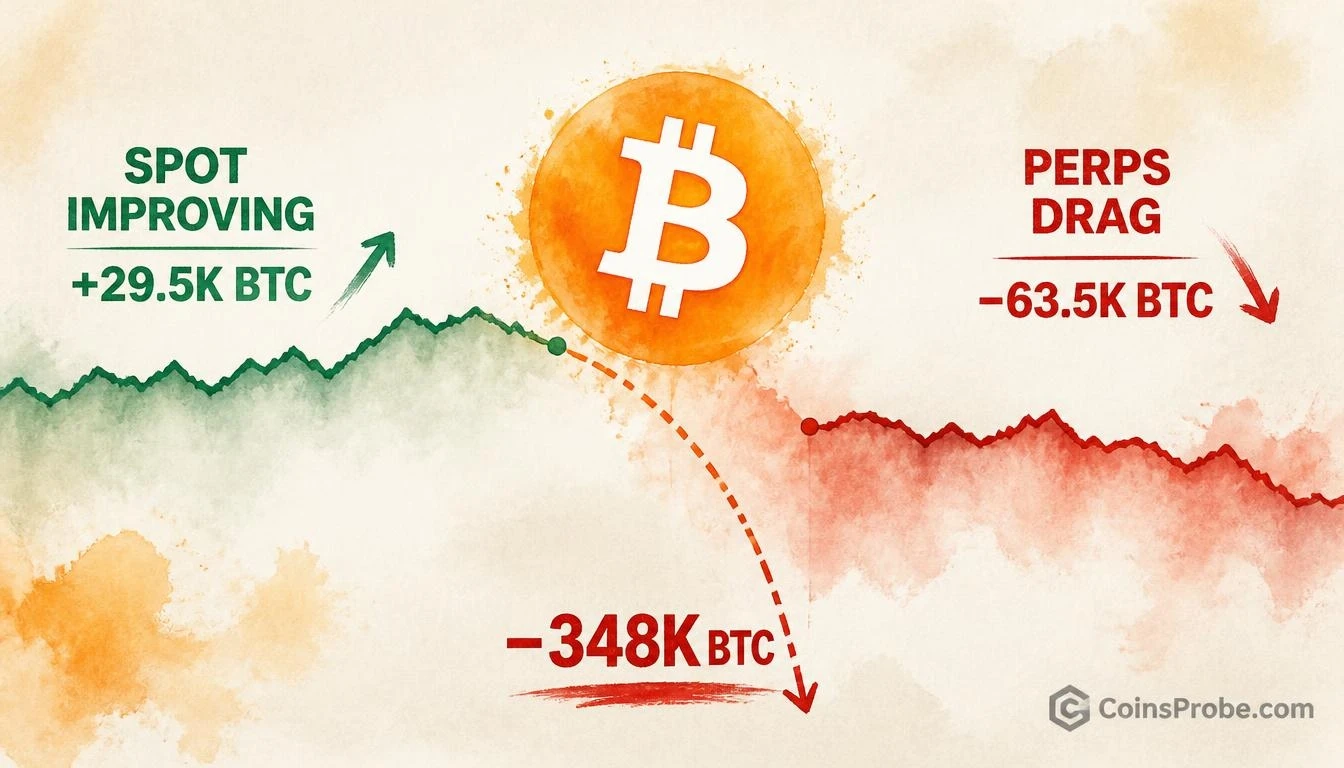
- Bitcoin's 30-day combined demand estimate hit −348K BTC on Nov 10 — the weakest reading of the month, per CryptoQuant
- Spot demand improved +29.5K BTC over 3 days (Nov 7–10), but perp futures fell −63.5K BTC — more than twice the offset
- Spot BTC ETFs saw 5 consecutive outflow days totaling −$1.44B, with IBIT alone shedding $269.7M on Nov 11 per SoSoValue
- Analyst's two-part condition: spot must continue toward zero AND perp drag must ease for combined line to flatten
Bitcoin is trading at approximately $73,497 — down 0.26% over the past 24 hours — with a market cap of roughly $1.48 trillion. Beneath the price, one of the most closely watched on-chain demand metrics just hit its weakest reading of the month: a combined 30-day demand estimate of −348K BTC as of November 10, 2026. That number is not noise. It is the net result of two forces moving in opposite directions, and understanding which one is winning matters far more than the headline figure.
The analysis comes from an on-chain researcher publishing under the handle @RugaResearch via CryptoQuant. In a Quicktake note dated November 11, 2026, the analyst writes directly: “What I want to see next is spot continuing toward zero and the drag from perps easing enough for the combined line to flatten.” That single sentence contains the entire thesis — and the precise conditions that must be met before the demand picture shifts from deteriorating to stabilizing.
What the 30-Day Demand Estimate Actually Measures
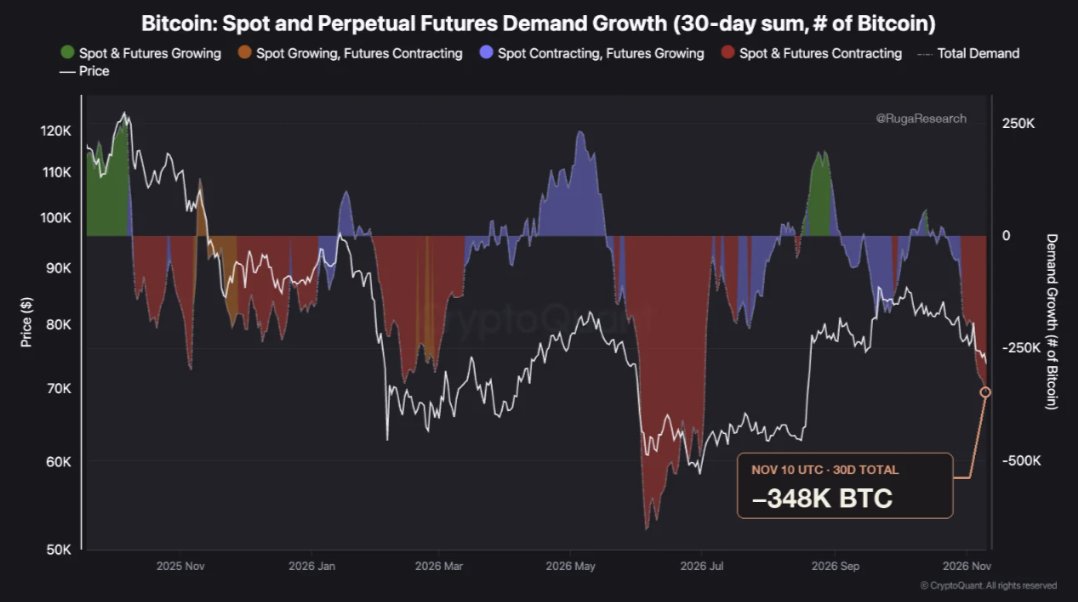
The 30-day demand estimate is a rolling window metric that combines spot demand and perpetual futures demand into a single BTC-denominated reading. Each new daily observation adds one close and drops the oldest, so the line is continuously refreshing. A reading below zero means that over the trailing 30 days, Bitcoin demand — across both spot and perps — has been net negative. At −348K BTC, the current reading reflects the deepest combined withdrawal of demand so far in November.
The chart published by CryptoQuant shows the demand line (dashed) trending sharply negative against the price line (white), with a large red-dominant area dominating the visible range. Price declined significantly from around $120K toward current levels, with a slight uptick visible at the right edge of the chart. The demand axis spans from approximately +250K BTC to −500K BTC, with the November 10 annotation clearly marking the −348K BTC reading. Price is sitting below the zero-demand equilibrium line, with no confirmed reversal in the combined metric.
Signal 1 — Spot Demand: Three Days of Improvement
The nuance that makes this analysis worth attention is the divergence inside the combined reading. According to the CryptoQuant Quicktake note, spot demand improved on every daily reading from November 7 onward. Over those three days, the spot proxy improved by approximately 29.5K BTC — a meaningful shift that is not visible in the headline −348K figure because perps have been deteriorating faster.
Spot demand improving during a price decline — particularly on a retest of recent lows — is the specific setup the analyst is monitoring. As the note states, “Spot improving is worth paying attention to, especially if it continues on a retest of the lows.” This is not a buy signal. It is a preliminary condition. Spot moving toward zero on the demand axis while price holds its lows would be the first structural indicator that a range is building rather than a continued breakdown.
Signal 2 — Perpetual Futures Drag: The Counter-Force
The reason the combined line remained red despite spot improvement is the perpetual futures component. Over the same three-day period in which spot improved by 29.5K BTC, the perp estimate fell by approximately 63.5K BTC — more than twice the magnitude of the spot improvement. Both components were still below zero as of the November 10 reading.
This dynamic matters structurally. Perp-driven demand deterioration reflects leveraged positioning being unwound or flipped short — it is not the same signal as spot holders reducing exposure. When perps deteriorate faster than spot improves, the combined line continues to fall even as the more fundamentally important component (spot) is recovering. The analyst’s condition — that the perp drag must ease enough for the combined line to flatten — sets a specific, testable threshold: the gap between spot improvement and perp deterioration must close.
The Two-Part Confirmation the Analyst Requires
The CryptoQuant note is explicit about what confirmation looks like, and it requires two simultaneous conditions — not one. First, spot demand must continue recovering toward zero on the 30-day window. Second, the drag from perpetual futures must ease enough for the combined line to stop falling and begin flattening. The analyst writes: “If that happens while price holds its lows, I’d take the idea of a range more seriously.”
This is a conditional framework, not a confirmed outcome. As of November 10, neither condition had been fully met. Spot had shown early-stage improvement across three closes, but perps had overwhelmed that progress. The pattern status remains forming — no breakout above the demand equilibrium has occurred, and the combined metric is still deeply negative. The analyst is watching how the 30-day window evolves across several additional closes before drawing a firmer conclusion.
It’s worth placing this against the broader institutional backdrop: spot Bitcoin ETFs recorded a net outflow of $299.9M on November 11, the fifth consecutive outflow day, with cumulative five-day outflows reaching $1.44B, per data via SoSoValue. IBIT alone saw $269.7M in outflows on that date, while FBTC recorded no net inflow. That ETF flow data is consistent with the on-chain picture — institutional demand through listed products has been contracting in parallel with the spot demand softening that the demand estimate is capturing. For prior analysis of Bitcoin’s macro positioning, see Bitcoin Power Law Oscillator at 34.5 — The +100 Threshold Maps to $157,800.
Strategy (formerly MicroStrategy) continued its accumulation pace, adding 1,036 BTC for $81.9M in its latest disclosed purchase, bringing total holdings to 850,364 BTC as of November 9, per SoSoValue. That corporate bid has been a consistent floor under structural demand — but it operates on a different cadence than the 30-day rolling metric being analyzed here. For additional context on recent price dynamics, see Bitcoin Whale Sell-Off at $87K — Is $82,500 a New Buying Opportunity?.
Macro Context: What Comes Next
The demand picture will be tested against an active macro calendar. PPI data dropped November 12. Retail Sales follow on November 16, with Initial Jobless Claims on November 18 and Core PCE alongside GDP on November 24. Markets are pricing a 90.8% probability of a Fed hold at the December 9 FOMC meeting, per SoSoValue data, but the January 27 meeting already shows a 61.7% probability of a hike — a shift that would tighten the macro environment further if confirmed by incoming data. Each of these releases has the potential to accelerate or arrest the perp deterioration the analyst is monitoring. Bitcoin’s seasonal performance through this window has previously been analyzed at Bitcoin Holds Through October’s Weakest Three Days — Up 1.86% Where History Averages -0.66%.
The demand metric will continue rolling daily, adding each new close and dropping the oldest. As the analyst notes, the 30-day window’s behavior across several closes — not a single day — is what determines whether the thesis of a building range becomes credible or collapses.
At $73,497, Bitcoin is sitting near the right edge of the chart where the slight price uptick is visible. The combined demand reading at −348K BTC remains the deepest negative print of November. Whether the spot improvement that began November 7 sustains — and whether perp drag decelerates enough for the combined line to flatten — will be answered in daily closes over the sessions ahead. Watch the combined 30-day demand estimate via CryptoQuant for the signal the analyst has explicitly defined: spot approaching zero while perps ease, confirmed while price holds its lows.
Source: x.comFrequently Asked Questions
What is Bitcoin’s 30-day demand estimate and how is it calculated?
Why did the combined demand reading fall to −348K BTC even though spot improved?
What specific conditions must occur for the analyst’s range thesis to become credible?
How does the Bitcoin ETF outflow data relate to the on-chain demand reading?
Source: CryptoQuant · Published by CoinsProbe Markets Desk
The opinions and market insights shared on CoinsProbe represent the views of individual authors based on prevailing market conditions at the time of publication. Cryptocurrency investments carry significant risk and volatility. Readers are encouraged to conduct their own research and seek professional financial advice before making investment decisions. CoinsProbe and its contributors do not accept responsibility for financial losses or decisions made based on published content.
CoinsProbe may publish sponsored articles, affiliate links, or promotional collaborations. All sponsored material is clearly labeled to maintain transparency with our audience. Our editorial decisions remain fully independent, and advertising partnerships do not influence reviews, rankings, or published opinions.
Since 2023, CoinsProbe has delivered reliable insights on cryptocurrency, blockchain, and digital assets. Our content is created by experienced researchers and analysts who follow strict editorial standards focused on accuracy, transparency, and credibility. Every article is carefully reviewed and verified using trusted sources and current market data. We provide unbiased analysis and timely updates covering everything from emerging crypto projects to major industry developments.