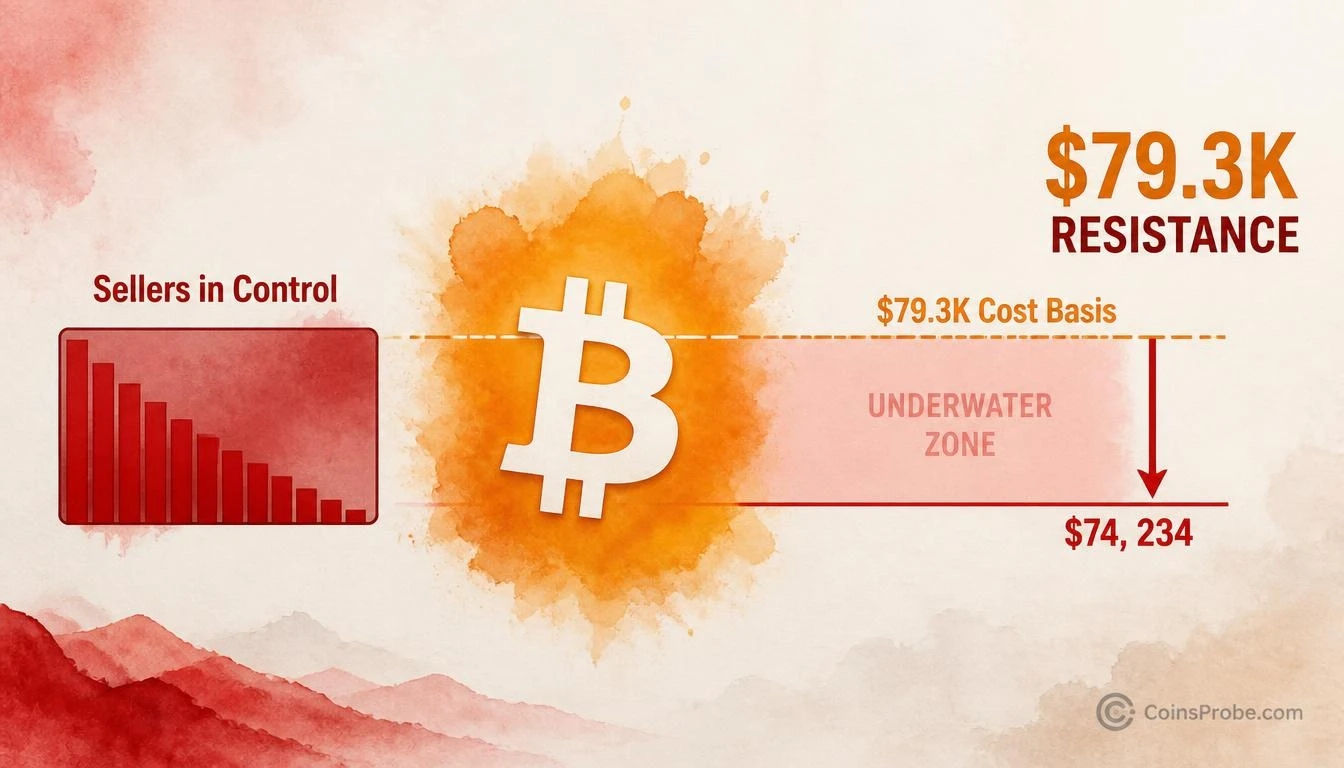

- Bitcoin trades at $74,234 (-2.12% 24h) — 5.7% below the 1–3 month buyer cohort's average cost of $79.3K per CryptoQuant
- CryptoQuant's seller dominance indicator turned red in late October 2026 — matching patterns seen in Feb–Apr and Jun–Aug episodes where price remained capped for months
- Two conditions required for recovery: buyer dominance indicator turns green AND price closes back above ~$79K — both must confirm simultaneously per the analyst
Bitcoin is trading at $74,234 — down 2.12% in the past 24 hours and carrying a market cap of approximately $1.49 trillion. The move lower is not just a price observation. On-chain data from CryptoQuant now shows the majority of buyers who entered Bitcoin over the past one to three months are sitting at a loss, and their breakeven level is shaping up as the cycle’s next meaningful resistance zone.
An on-chain analyst at CryptoQuant, identified as @Woo_Minkyu, published the finding in a CryptoQuant Quicktake note titled “Sellers in Control, Recent Buyers Underwater.” The conclusion is direct: “When recent buyers are underwater, some may sell when price comes back to their cost, just to break even. That can make the $79K area harder to break.” CryptoQuant’s official account amplified the note on November 9, 2026.
What the On-Chain Data Actually Shows
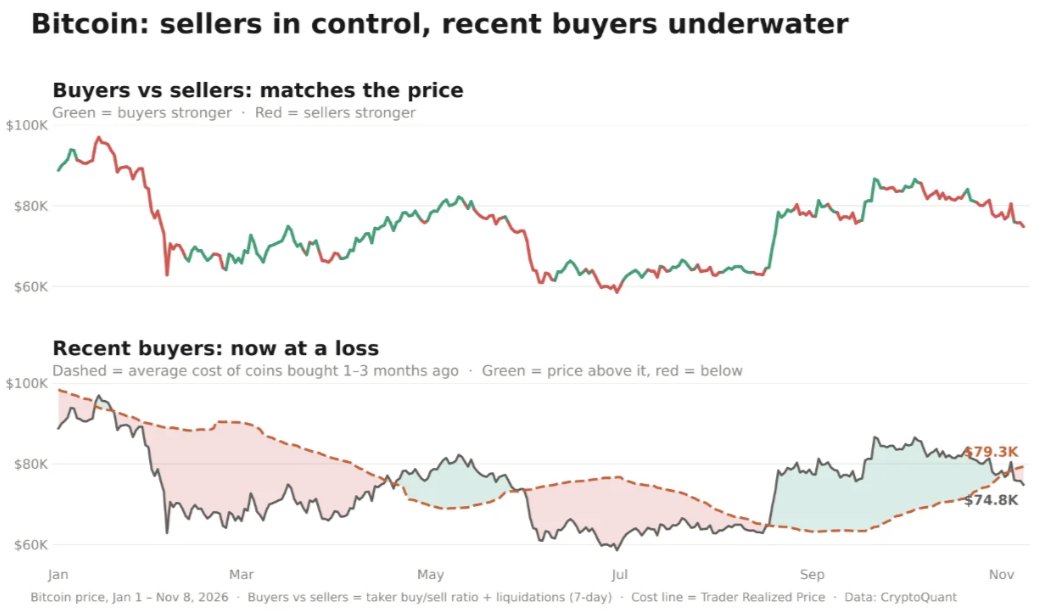
The analysis tracks two separate but related metrics. The first is a buyer/seller dominance indicator — it turns green when buyers are absorbing supply at market price (and leveraged shorts are being liquidated), and red when sellers are in control (and leveraged longs are being flushed). Per the published note: January 2026 printed red during the crash. August 2026 printed green during the rally. Since late October 2026, the line has turned red again — sellers are back in control by this measure.
The second metric is the Trader Realized Price for the 1–3 month cohort — the average entry price paid by participants who bought Bitcoin between roughly August and October 2026. That figure currently sits at approximately $79.3K, per the CryptoQuant chart. Bitcoin closed November 8 at $74.8K, placing the current price 5.7% below that cost-basis level. At the time of writing, the gap has widened further to approximately 6.2% below the $79.3K level.
Why $79.3K Is Structurally Harder to Break
The mechanism is straightforward and well-documented in behavioral on-chain analysis. When a large cohort of buyers holds coins at a loss, the market creates a natural ceiling near their average cost. As price recovers toward $79.3K, a portion of that cohort — unwilling to hold through further drawdowns — will sell to recover their capital at breakeven. That supply pressure does not need to be coordinated to be effective. It is structural: thousands of independent actors making the same rational decision at the same price point creates resistance without any single entity engineering it.
The CryptoQuant note adds historical context specific to this cycle. In 2026, Bitcoin price stayed below the 1–3 month Trader Realized Price for extended periods on two prior occasions: February through April, and again June through August. Both episodes involved weeks of price action capped near that cost-basis level before an eventual reclaim. The current episode, beginning in late October, now appears to be a third such phase.
This context matters for anyone evaluating Bitcoin’s recent 200-day MA touch and the subsequent correction that followed. The on-chain picture now confirms what the chart was beginning to suggest: sellers have structural motivation above the current price.
Two Conditions for a Genuine Recovery
The CryptoQuant note is explicit about what a recovery would require — and critically, it requires two things simultaneously, not one. Per the analyst: the buyer/seller dominance indicator must turn green again (confirming buyers back in control of price discovery), and price must close back above approximately $79K (putting recent buyers back in profit and removing the breakeven selling overhang). The note is clear that “both together would be a much better sign than either one alone.”
This two-condition framework matters. A price reclaim of $79K without the dominance indicator confirming would suggest a low-conviction push that could be faded at that same level. Similarly, a green dominance reading while price remains below $79K would indicate buyers are winning skirmishes but have not yet absorbed the full supply overhang. Neither condition alone constitutes a structural shift.
It is also worth noting separately from the analyst’s thesis that Bitcoin’s supply velocity recently hit its lowest level in over a decade — a datapoint that speaks to longer-term holder behavior but does not directly alleviate the near-term pressure created by the underwater 1–3 month cohort.
Where This Fits in the Broader Structure
The $74,234 price at time of writing sits in a zone that has been technically sensitive for several months. The 1–3 month Trader Realized Price at $79.3K is not a speculative target — it is a data-derived level representing the actual average acquisition cost of a cohort large enough to influence price at their breakeven. That is what gives it analytical weight distinct from a standard technical resistance drawn on a price chart.
CryptoQuant’s seller dominance signal turning red in late October, combined with $74.8K closing below $79.3K on November 8, creates a consistent on-chain picture: the near-term path of least resistance is sideways-to-down, with any recovery attempt likely to encounter concentrated supply near $79K–$79.3K until both conditions the analyst identifies are satisfied.
Frequently Asked Questions
What is the Trader Realized Price and why does it matter at $79.3K?
How long did Bitcoin stay below its Trader Realized Price in prior 2026 episodes?
What specific conditions would signal the sellers-in-control regime is ending?
Does the current on-chain picture mean Bitcoin cannot rally from $74,234?
Source: CryptoQuant · Published by CoinsProbe Markets Desk
The opinions and market insights shared on CoinsProbe represent the views of individual authors based on prevailing market conditions at the time of publication. Cryptocurrency investments carry significant risk and volatility. Readers are encouraged to conduct their own research and seek professional financial advice before making investment decisions. CoinsProbe and its contributors do not accept responsibility for financial losses or decisions made based on published content.
CoinsProbe may publish sponsored articles, affiliate links, or promotional collaborations. All sponsored material is clearly labeled to maintain transparency with our audience. Our editorial decisions remain fully independent, and advertising partnerships do not influence reviews, rankings, or published opinions.
Since 2023, CoinsProbe has delivered reliable insights on cryptocurrency, blockchain, and digital assets. Our content is created by experienced researchers and analysts who follow strict editorial standards focused on accuracy, transparency, and credibility. Every article is carefully reviewed and verified using trusted sources and current market data. We provide unbiased analysis and timely updates covering everything from emerging crypto projects to major industry developments.