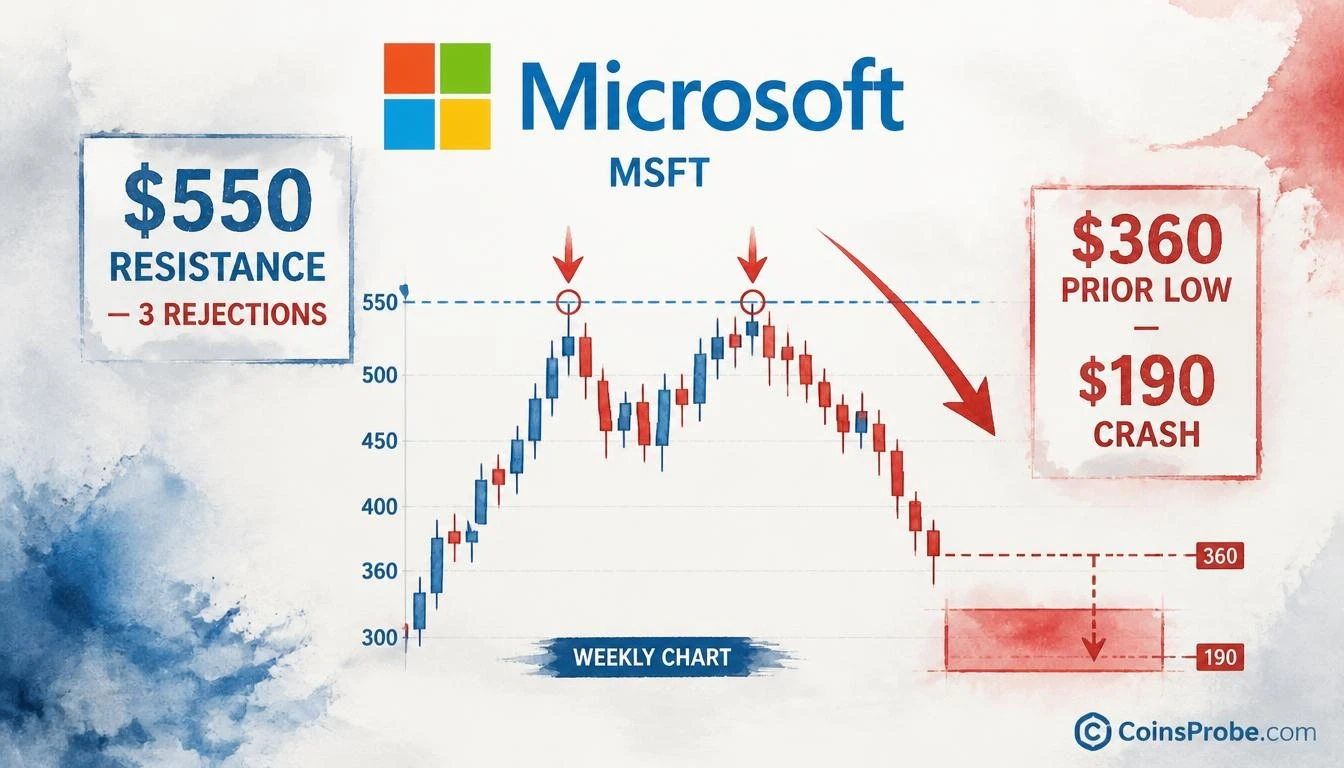
- MSFT trades at $519.92 — below the $550 resistance that has now rejected price three consecutive times
- Last $550 failure produced a $190 crash from resistance to $360 low, a ~34% peak-to-trough decline
- Fakeout confirmed: November 2026 wick exceeded $550 but candle body closed back below the level
- Watch $500 — a weekly close below opens the path to $450, then the $350–$360 channel floor
Microsoft (MSFT) is trading at approximately $519.92, sitting between the $500 and $550 price levels after failing to sustain a move above a resistance zone that has now rejected price on multiple consecutive attempts. The setup is not new — and that is precisely what makes it significant.
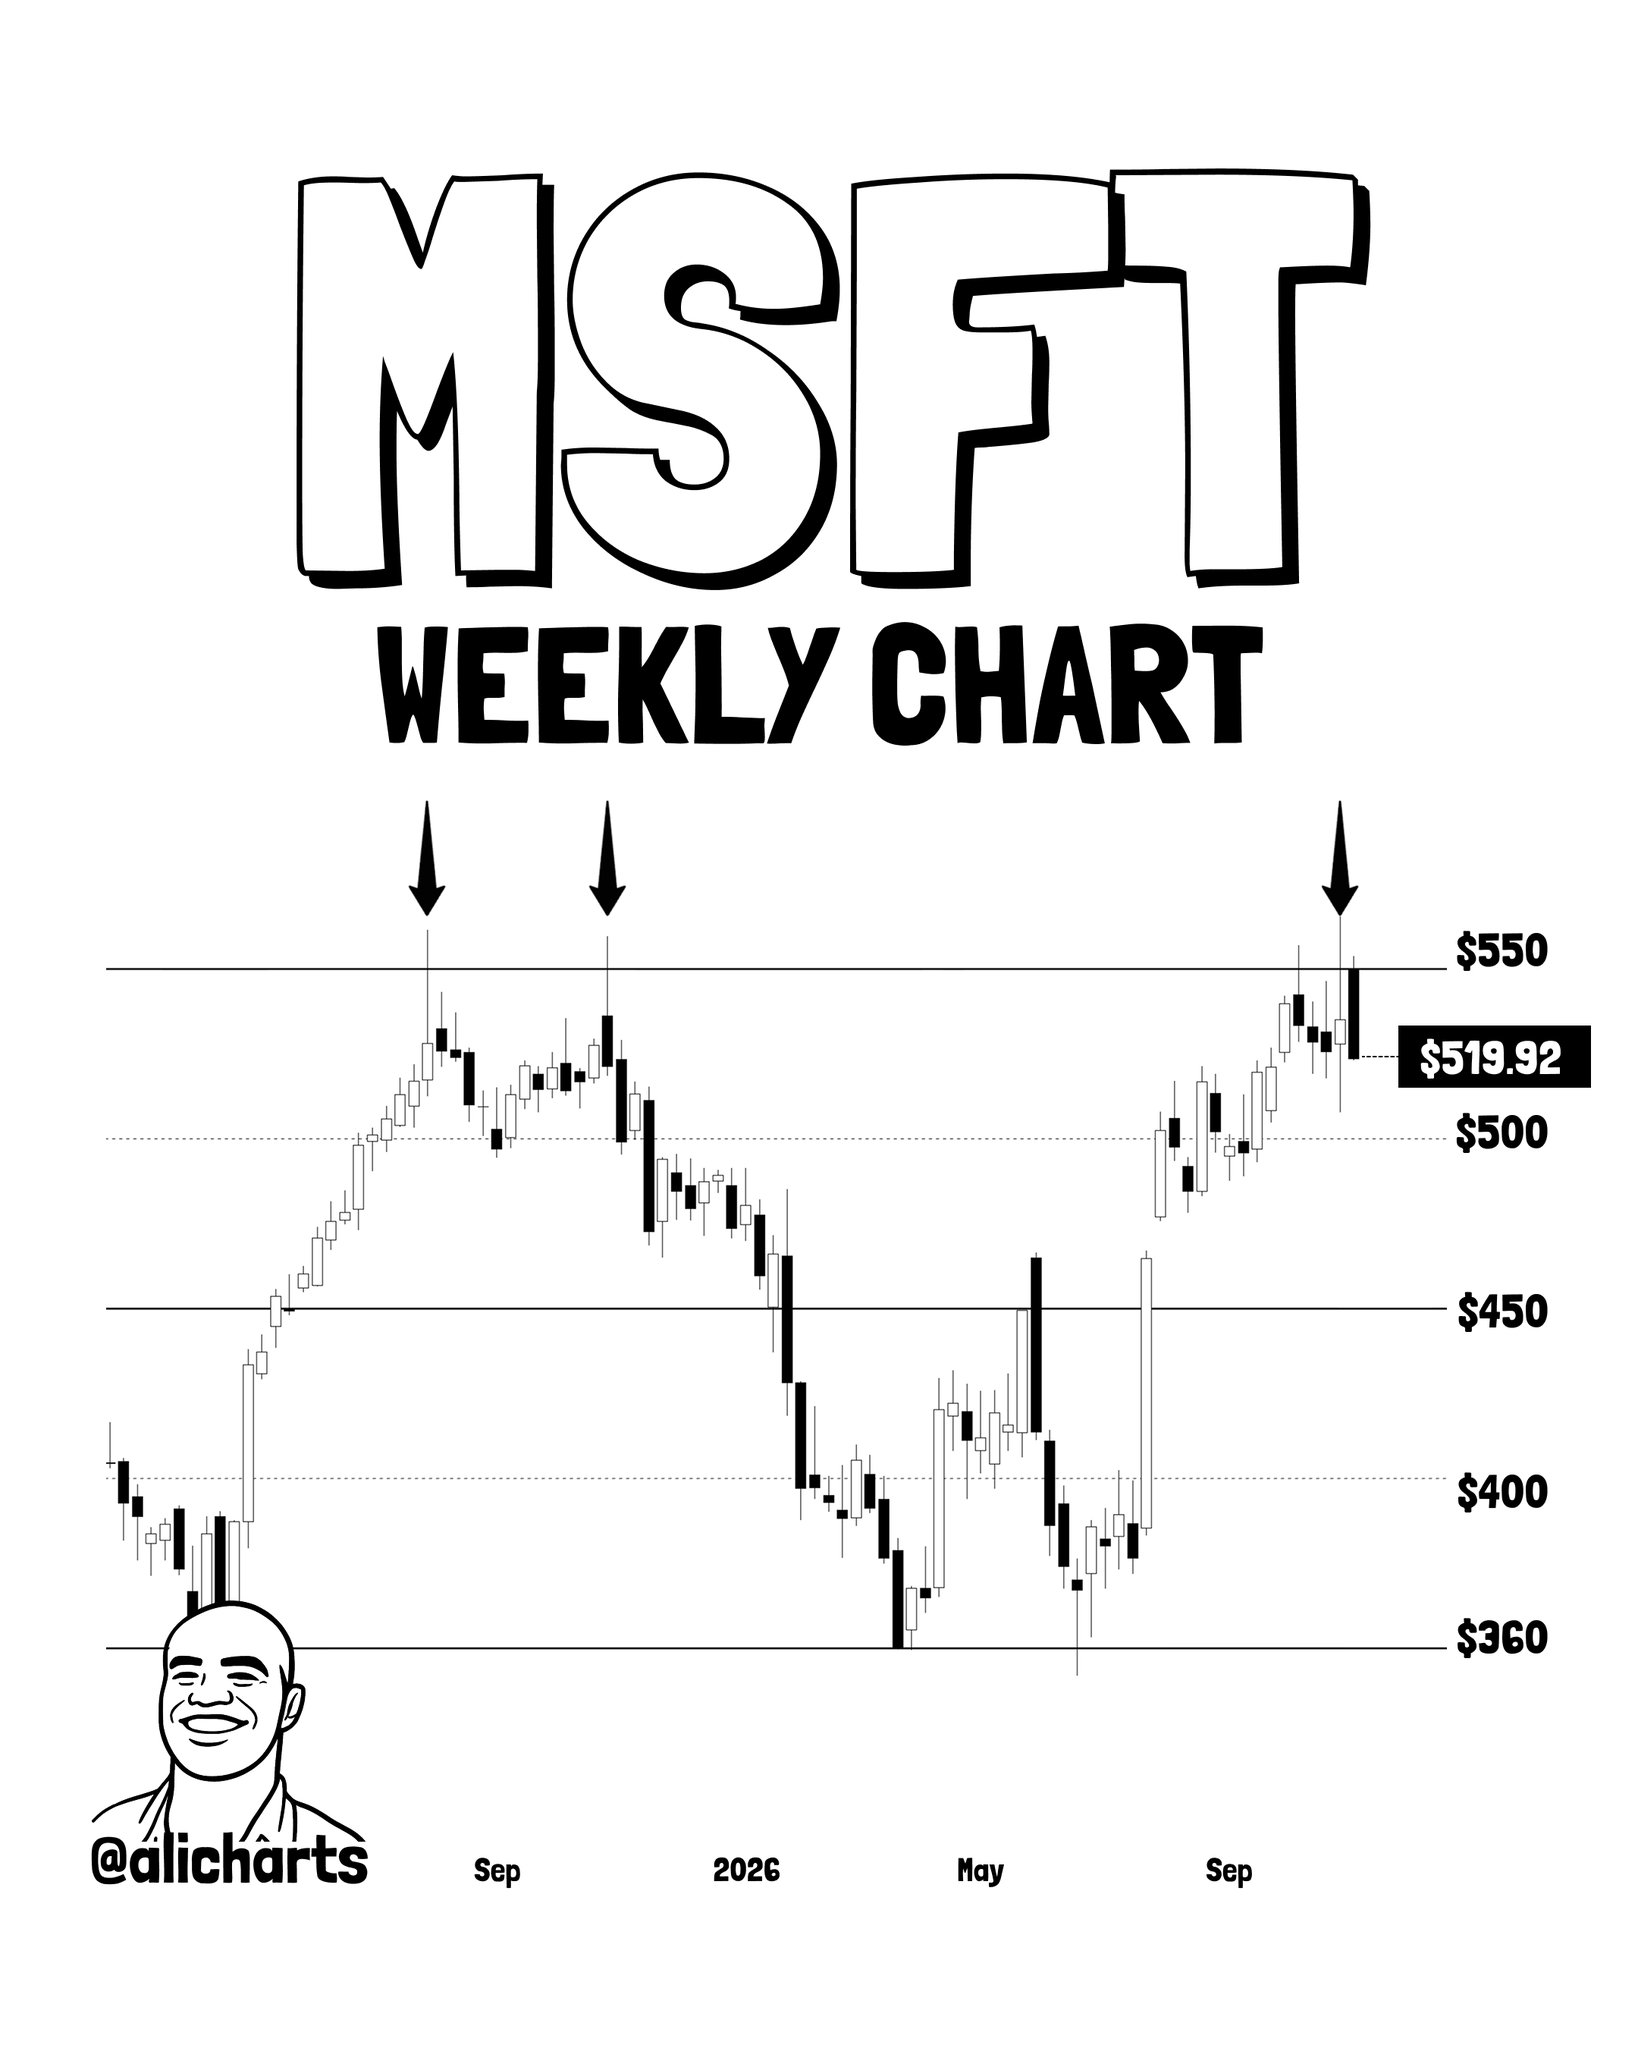
One analyst flagged the pattern directly: “The last time Microsoft $MSFT failed to break above $550, it crashed to $360.” The post paired that historical reference with a single question — “Déjà vu?” — and a chart showing the current rejection is structurally identical to the one that preceded a $190 peak-to-trough decline.
The $550 Resistance — Three Rejections, One Historical Precedent
The weekly chart spanning approximately September 2025 through November 2026 tells the story in clean visual terms. MSFT rallied into the $550 zone in August 2025, was rejected. It rallied again in October 2025, was rejected again. And in November 2026, price spiked above $550 intraday — producing a wick that exceeded the level — before the candle body closed back beneath it. The analyst marks each rejection with a downward arrow. The third arrow lands on the current setup.
The fakeout structure is what elevates this from a simple double-top to a more concerning pattern. A clean rejection would suggest overhead supply. A wick above followed by a close beneath $550 — a fakeout — suggests that buyers who chased the breakout are now trapped above the market, creating a structural overhang of stop-losses and forced liquidation that can accelerate downward moves. This is not a theoretical risk. The analyst’s referenced prior instance produced exactly that dynamic: a $550 failure followed by a move all the way to $360, a $190 decline from peak to the eventual floor.
The Prior Crash — Mapping the Historical Parallel
The analyst’s thesis rests on a single documented precedent: the last time MSFT tested and failed to break above $550, the stock declined to $360. That is a move of approximately $190 from resistance to trough, or roughly a 34% drawdown from the $550 ceiling level.
The current setup mirrors that prior sequence across the key variables: the same resistance zone tested, the same rejection signal (a wick piercing the level followed by a close beneath it), and the same absence of a sustained close above $550 to confirm a genuine breakout. When a pattern repeats at the same price level with the same structure, the precedent becomes the base case — not a forecast, but the documented outcome of an identical configuration.
It is worth noting the downside markers the analyst has flagged across the broader chart context: $450 as a mid-range support level and $350 as the lower channel boundary. At the current price of $519.92, the distance to $450 is approximately 13.5%. A continuation toward the prior $360 low would represent a drawdown of roughly 31% from current levels. Neither is a price target — both are levels the analyst identifies as relevant in the event the $550 resistance holds.
This pattern sits within a broader macro context worth noting. As covered in our analysis of Bitcoin analyst consensus hitting its most bearish reading in months, risk sentiment across asset classes has been under pressure — and large-cap tech stocks like MSFT are not immune to that backdrop when technical structures deteriorate.
What the Chart Says — And What It Doesn’t
The chart confirms a fakeout at $550 — price exceeded the level on a wick before closing below it. That is a bearish structural signal at a historically significant resistance zone. The chart also confirms that MSFT remains above $500 and above $450 at time of writing, meaning the breakdown, if it materializes, has not yet begun in earnest.
What the chart does not say: it does not set a timeline for the decline. It does not confirm that $360 will be retested — only that it was the prior destination after an identical setup. And it does not account for fundamental catalysts — earnings, macro data, rate decisions — that could override the technical structure in either direction.
The analyst’s signal is technical and historical, not fundamental. The question the chart poses is whether the third rejection at $550 produces the same result as the first. The answer will come at $500 first — a level that, if lost on a weekly close, removes the last near-term support before the $450 zone.
The Level That Decides the Thesis
$550 is the line. MSFT has now failed to close above it on three separate approaches. Each attempt has been met with distribution. The fakeout wick in November 2026 — price briefly exceeding $550 before returning below — is the most technically damaging of the three, as it suggests the final buyers attempting a breakout have been absorbed and reversed.
A sustained weekly close above $550 would invalidate the bearish parallel entirely. That is the one condition that changes the structure — not an intraday move, not a wick, but a body close above the level that has rejected MSFT three times in fourteen months.
Until that happens, the documented precedent stands: $550 failed once and produced a $190 crash to $360. The current structure is, as the analyst put it, déjà vu.
Watch $500 as the immediate structural tell — a weekly close below it opens the path toward $450 and the lower channel boundary near $350–$360.
Source: x.comFrequently Asked Questions
What is the significance of MSFT’s $550 resistance level?
What makes the November 2026 rejection a fakeout rather than a simple rejection?
What price level would invalidate the bearish thesis on MSFT?
What are the downside targets if $550 holds as resistance?
Source: Ali Charts · Published by CoinsProbe Markets Desk
The opinions and market insights shared on CoinsProbe represent the views of individual authors based on prevailing market conditions at the time of publication. Cryptocurrency investments carry significant risk and volatility. Readers are encouraged to conduct their own research and seek professional financial advice before making investment decisions. CoinsProbe and its contributors do not accept responsibility for financial losses or decisions made based on published content.
CoinsProbe may publish sponsored articles, affiliate links, or promotional collaborations. All sponsored material is clearly labeled to maintain transparency with our audience. Our editorial decisions remain fully independent, and advertising partnerships do not influence reviews, rankings, or published opinions.
Since 2023, CoinsProbe has delivered reliable insights on cryptocurrency, blockchain, and digital assets. Our content is created by experienced researchers and analysts who follow strict editorial standards focused on accuracy, transparency, and credibility. Every article is carefully reviewed and verified using trusted sources and current market data. We provide unbiased analysis and timely updates covering everything from emerging crypto projects to major industry developments.