
Bitcoin is trading at $85,868 — up 0.86% in the past 24 hours, with a market cap of $1.725 trillion. That price alone is not the story. The story is what it means that Bitcoin is positive at all: October 1–3 is historically Bitcoin’s single weakest three-day stretch of any month, and 2026 has broken the pattern.
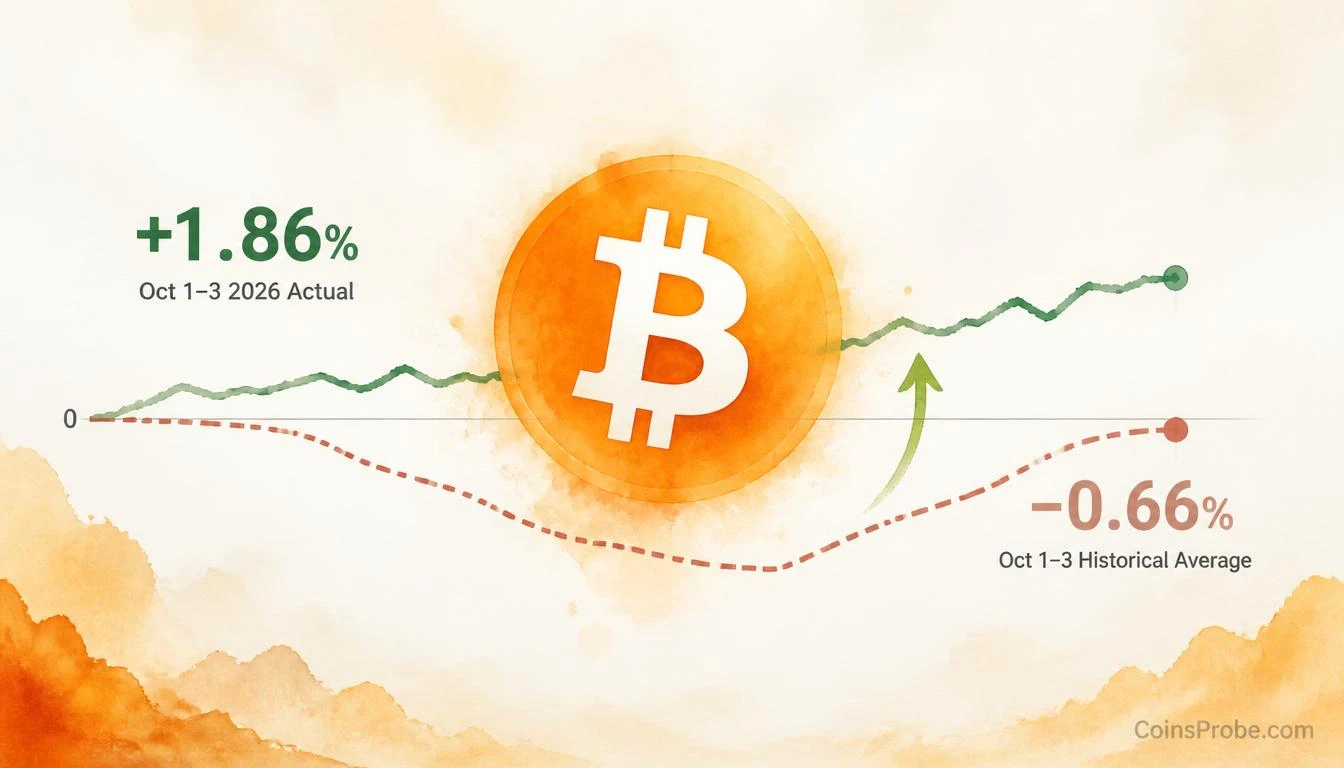
The observation comes from analyst @coinjuicehq, published via CryptoQuant on October 5, 2026: “Bitcoin’s first three days of October have historically been its weakest three-day stretch of the month, averaging a 0.66% decline. 2026 has already held up better.” The current reading: +1.86% through the same three-day window — a swing of roughly 250 basis points above the historical baseline.
The Seasonal Pattern — And Why 2026 Is Different
Seasonal analysis in Bitcoin is not forecasting — it is pattern documentation. Over the asset’s history, the opening three trading sessions of October have been net negative on average, with a mean return of -0.66%. This is not a marginal weakness; it represents Bitcoin’s most reliably negative short window of any month, making it the most statistically loaded three-day stretch in Bitcoin’s calendar.
The chart published by @coinjuicehq via CryptoQuant overlays two lines: the green 2026 path and the dashed historical average. The dashed line dips below 0% early in October before curving steadily upward through month-end, reaching a historical cumulative return of +13.37% by October 31. The 2026 line, by contrast, rises slightly then holds near +1.86% — sitting above zero precisely at the moment history says it should be below it.
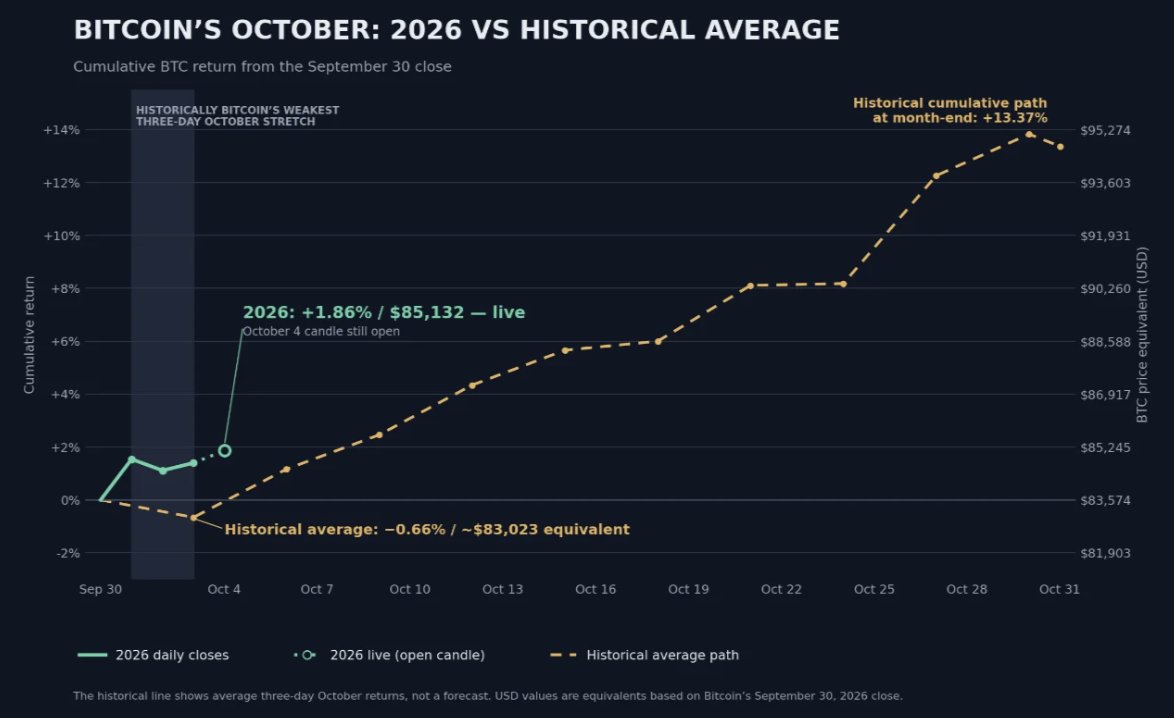
The right axis of the chart maps percentage performance to equivalent price levels, with the +1.86% / $85,132 mark labeled as live at the time of publication. The historical average equivalent sits at approximately $83,023. Bitcoin is currently trading roughly $2,845 above where seasonality said it would be through the first three days.
What the Seasonal Outperformance Confirms — And What It Doesn’t
Seasonal resilience is a condition, not a catalyst. What the @coinjuicehq data confirms is structural: Bitcoin absorbed its historically worst short window without a net decline. That is meaningful not because it predicts the rest of October, but because it eliminates a specific seasonal drag that has previously weighed on early-month price action.
What it does not confirm: a directional trade, a specific price target, or immunity from macro shocks. The historical cumulative return of +13.37% by month-end reflects an average, not a guarantee — and that average includes years where October reversed sharply after a strong opening three days.
Context matters here. Bitcoin has been navigating a complex demand picture heading into this period. Bitcoin demand is recovering but U.S. spot buyers remain absent — a structural gap that seasonal strength alone cannot close. Similarly, MVRV momentum has improved while apparent demand remains the missing piece. Seasonal outperformance at the front of October is a tailwind reading, not a demand confirmation.
The Power Law Context — CryptoQuant’s Broader Cycle Framing
Alongside the seasonal note, CryptoQuant analyst AxelAdlerJr published a separate Power Law calculation on October 4, 2026, placing Bitcoin’s fair value range at $157,000 based on long-run Power Law modeling. The note documents that oscillator peaks have declined over cycles — from +169 in 2018 to +102 in 2025 — reflecting a structural dampening of Bitcoin’s deviation from its long-run trend line. The standard deviation of daily fluctuations around the Power Law line has narrowed over time, which AxelAdlerJr cites as evidence of maturing price behavior rather than weakening momentum.
At $85,868, Bitcoin is trading at a significant discount to the Power Law implied value of $157,000. That gap does not constitute a near-term price target. It provides a cycle-level reference point: if the oscillator’s historical pattern holds and peaks continue declining in magnitude, the next major high would represent a smaller percentage gain from trough than prior cycles — but still a substantial absolute move from current levels.
What Comes Next in October’s Seasonal Calendar
The historical average chart is instructive beyond the three-day window. The dashed path in @coinjuicehq’s chart shows that after the weak opening, October’s historical average curves consistently upward through the remainder of the month. The cumulative +13.37% end-of-month average suggests that once the seasonal drag window closes, October has historically been a net strong month for Bitcoin.
Bitcoin has entered that historically stronger phase while already sitting above where the average says it should be. That sequence — surviving the weak window positive, then entering the historically positive window — is the precise setup the seasonal data identifies as constructive. Separately, whale sell pressure near $87K has recently created a lower-level test, which the current $85,868 price represents a partial recovery from.
Bullish Scenario
Bitcoin holds above $83,023 (the historical October average equivalent) through the first week and tracks toward the historical month-end pattern. If the +13.37% historical October average from October 1 applies to 2026’s opening level near $83,600, that implies a reference endpoint near $94,800 by October 31 — not a target, but a calibration of what historical Octobers have produced from similar starting points.
Bearish Scenario
A reversal below the historical average equivalent near $83,023 would erase the seasonal outperformance and confirm that 2026’s early strength was a temporary deviation rather than a structural change. That outcome would not invalidate the Power Law long-run thesis but would remove the seasonal tailwind argument for near-term positioning.
Bitcoin at $85,868 has done something statistically uncommon: it has held positive through the one three-day stretch where Bitcoin historically goes negative, sitting +252 basis points above the seasonal average through October 1–3. The historical record then shows October recovering to a cumulative +13.37% by month end. Whether 2026 follows that path will be answered not by seasonal data, but by the demand-side picture that @coinjuicehq’s chart cannot yet show. The level to watch: $83,023 — the historical average equivalent. Holding above it keeps the seasonal outperformance thesis intact. Breaking below it does not.
Source: x.comFrequently Asked Questions
What does Bitcoin’s seasonal October performance actually mean for price direction?
What is the Power Law model and why does it place Bitcoin at $157,000?
What is the key level that would invalidate the seasonal outperformance thesis?
Has Bitcoin’s October seasonal strength historically led to strong monthly closes?
Source: CryptoQuant · Published by CoinsProbe Markets Desk
The opinions and market insights shared on CoinsProbe represent the views of individual authors based on prevailing market conditions at the time of publication. Cryptocurrency investments carry significant risk and volatility. Readers are encouraged to conduct their own research and seek professional financial advice before making investment decisions. CoinsProbe and its contributors do not accept responsibility for financial losses or decisions made based on published content.
CoinsProbe may publish sponsored articles, affiliate links, or promotional collaborations. All sponsored material is clearly labeled to maintain transparency with our audience. Our editorial decisions remain fully independent, and advertising partnerships do not influence reviews, rankings, or published opinions.
Since 2023, CoinsProbe has delivered reliable insights on cryptocurrency, blockchain, and digital assets. Our content is created by experienced researchers and analysts who follow strict editorial standards focused on accuracy, transparency, and credibility. Every article is carefully reviewed and verified using trusted sources and current market data. We provide unbiased analysis and timely updates covering everything from emerging crypto projects to major industry developments.