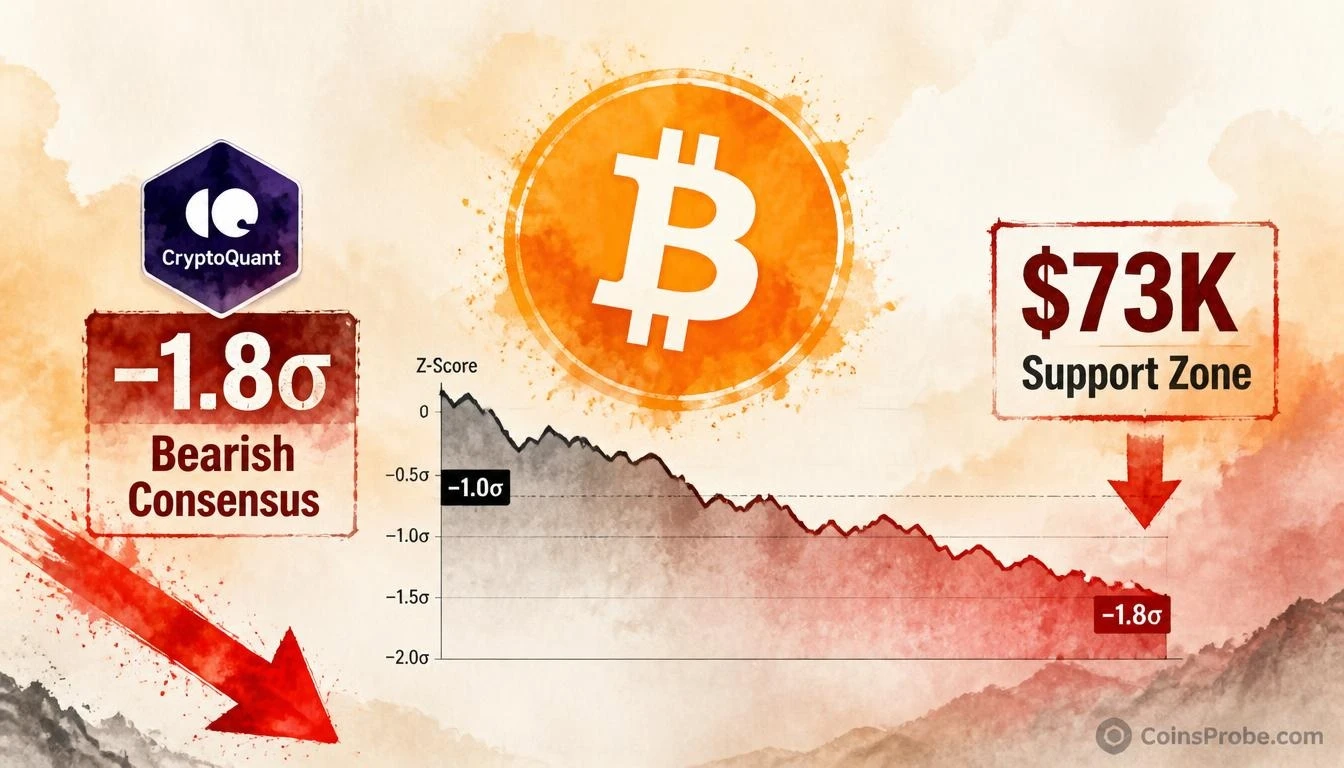

- Bitcoin's CryptoQuant Analyst Consensus Index dropped from –1.0σ to –1.8σ in 7 days — the fastest bearish compression in months
- Three simultaneous drivers: ETF outflows, hot CPI inflation data, and Nasdaq weakness per CryptoQuant (Nov 11, 2026)
- BTC sliding toward $73K — the price level coinciding with the sharpest point of analyst consensus deterioration
- 90 bullish vs 58 bearish analysts active on Nov 11 — 62% bullish in raw terms but –1.8σ below the 90-day baseline
Bitcoin is under pressure. CryptoQuant’s Analyst Consensus Index has dropped to –1.8σ — its most bearish Z-score reading in recent months — as the asset slides toward the $73,000 zone on a confluence of macro headwinds and institutional outflows. This is not a sentiment wobble. It is a measured, composite signal from 150 tracked analysts moving in one direction, fast.
CryptoQuant flagged the shift on November 11, 2026, noting that the Index had deteriorated from –1.0σ to –1.8σ in just seven days — coinciding with Bitcoin’s decline toward $73K. Three named drivers are cited in their report: ETF outflows, inflation concerns, and weakness in the Nasdaq. The speed of the consensus shift is what sets this reading apart from ordinary bearish sentiment cycles.
What the Analyst Consensus Index Actually Measures
Before treating –1.8σ as a data point, the mechanism matters. CryptoQuant’s Analyst Consensus Index is not a price model and not a derivatives metric. It aggregates directional calls — bullish, bearish, or neutral — from a curated roster of analysts publishing on X, CryptoQuant QuickTakes, Seeking Alpha, and Substack. Each analyst receives one weighted vote per day, calculated as the recency-weighted average of their directional posts from the last 30 days. Posts count in full for 14 days, then fade by day 30. Neutral posts do not vote. Each analyst’s weight is further adjusted by their historical accuracy score per asset.
The raw index runs from –100 (all bearish) to +100 (all bullish). The chart plots a moving average of the daily index and colors it by that average’s rolling 90-day Z-score. A reading of –1.8σ means the current consensus is 1.8 standard deviations below its own 90-day baseline — statistically unusual bearish compression. As of November 11, 2026, the index reflects 90 bullish analysts versus 58 bearish — a 62% bullish / 38% bearish split in raw percentage terms. The Z-score, however, reflects how much more bearish this split is compared to the recent norm, which is why –1.8σ carries signal weight even with a majority technically still bullish.
The 7-Day Drop — From –1.0σ to –1.8σ
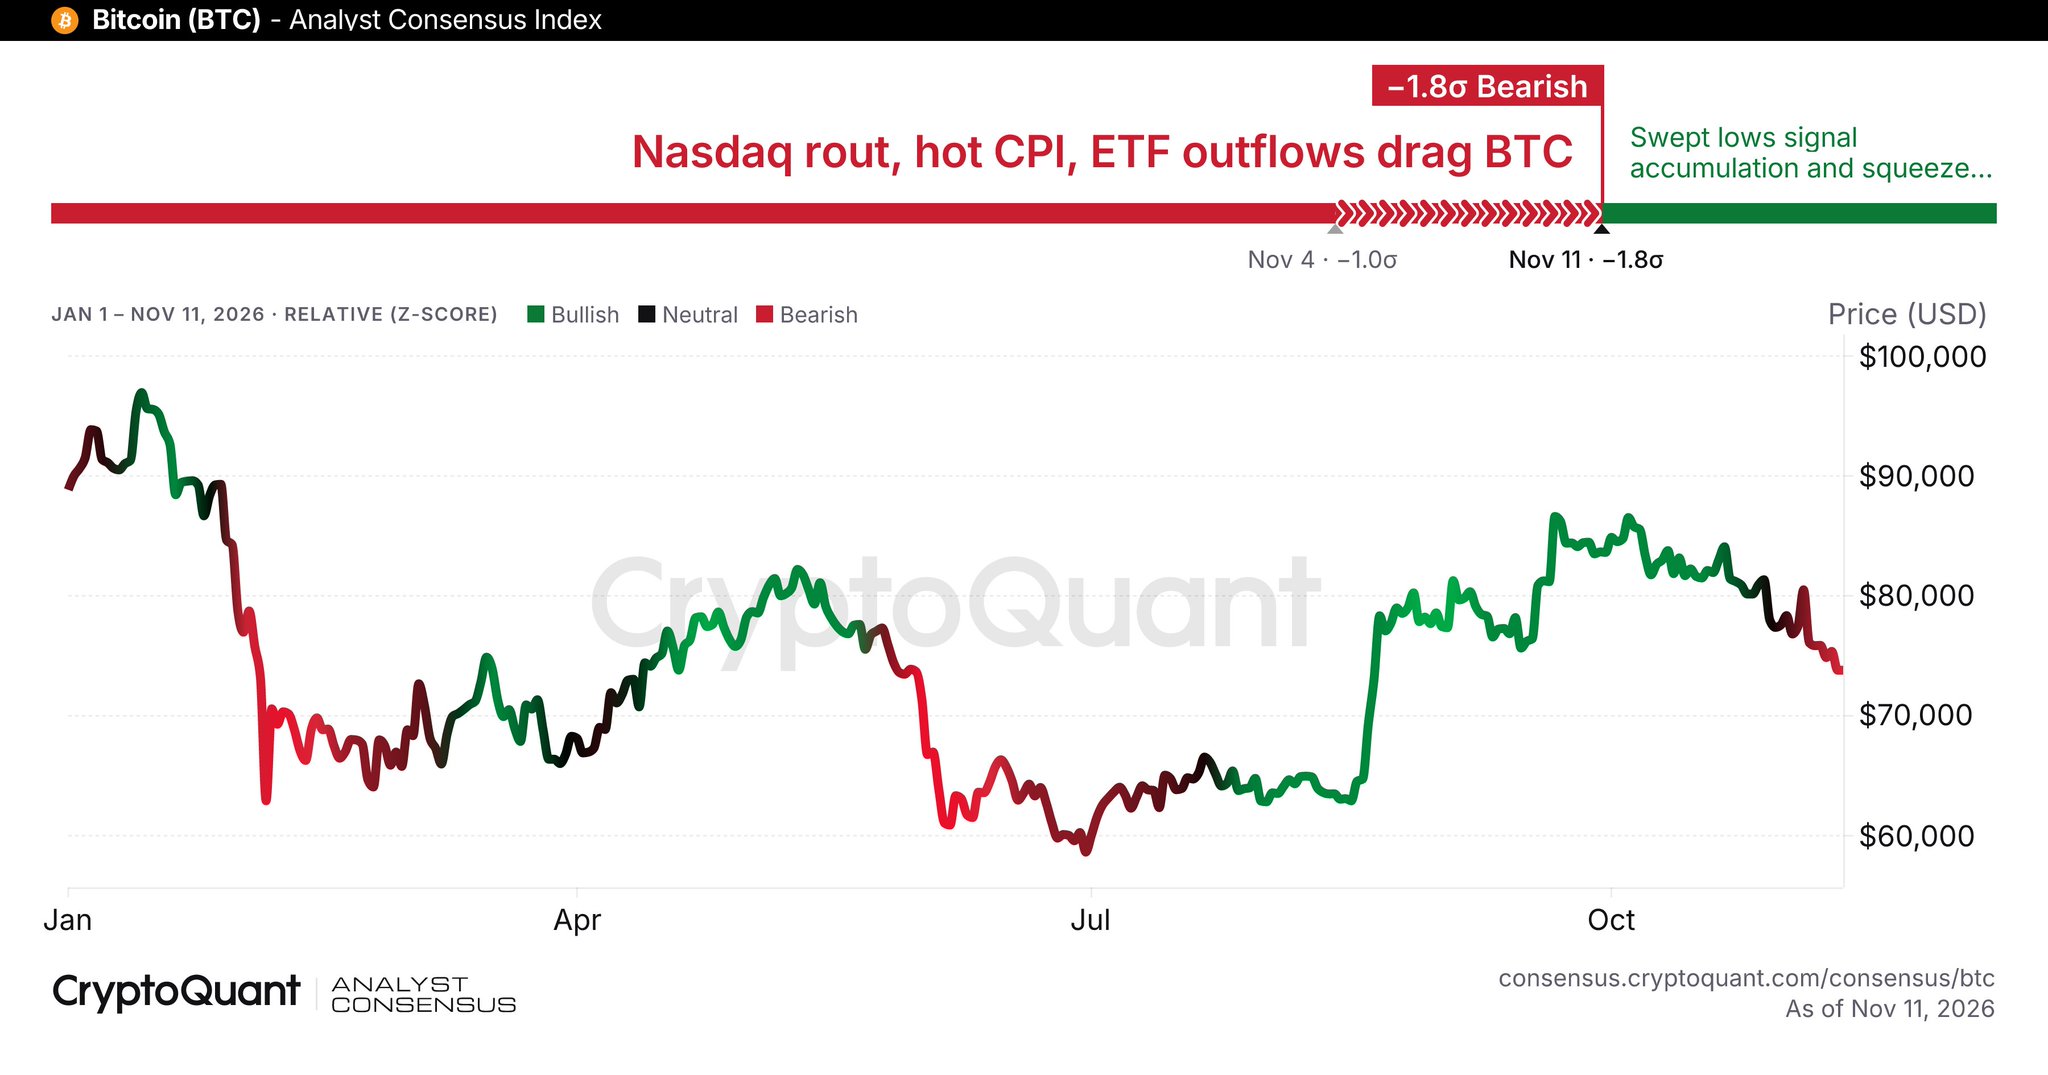
On November 4, the Index stood at –1.0σ. By November 11, it had reached –1.8σ. That is a 0.8 standard deviation deterioration in a single week — a pace that the CryptoQuant dashboard labels explicitly as “Bearish” in its badge notation. The directional calls underlying this shift were driven by 84 analysts posting on Bitcoin across the 7-day window, generating 537 directional calls in total.
What drove the shift is precisely stated. ETF outflows have resumed — consistent with broader institutional repositioning visible across spot Bitcoin ETF tracking data. Inflation concerns re-emerged following a hot CPI print, reinforcing expectations that the Federal Reserve will hold rates higher for longer. And the Nasdaq, which has historically acted as a leading risk barometer for Bitcoin in macro-stress periods, showed notable weakness into the November 11 print. All three catalysts compressed analyst conviction simultaneously.
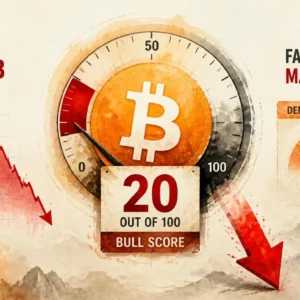
This aligns with a broader pattern of deteriorating on-chain signals. CryptoQuant’s own Bitcoin Bull Score recently hit 20 — the fastest demand contraction since March 2025. The Analyst Consensus Index now confirms that professional opinion is tracking the same direction as the on-chain data.
Three Macro Drivers Compressing Consensus
ETF Outflows. Spot Bitcoin ETF flows have reversed, with net outflows re-emerging as institutional managers reduce risk exposure. ETF flow data is a direct, same-day signal — when institutions exit through regulated vehicles, it represents real USD leaving the market, not just sentiment shifting.
Inflation Concerns. A hot CPI reading has reset rate-cut expectations. Bitcoin re-correlates with rate-sensitive risk assets during periods of inflation surprise. When inflation beats consensus, real yields rise, reducing the opportunity cost of holding dollars and increasing the attractiveness of exiting speculative assets — including crypto.
Nasdaq Weakness. The Nasdaq has acted as the primary risk proxy for Bitcoin through most of 2025–2026. Its weakness into November carries forward momentum implications for BTC. Meanwhile, whale behavior has followed: as previously documented, BTC and ETH whales are selling even as other assets see accumulation — reinforcing the macro-driven distribution narrative visible in the Analyst Consensus decline.
The 62% Bullish Paradox — Why the Z-Score Matters More Than the Percentage
At first glance, 62% of tracked analysts remaining bullish on Bitcoin appears reassuring. It is not the right frame. The Z-score captures the direction of travel relative to recent baseline, not the absolute level. When the 90-day norm was 80% bullish and the current reading is 62%, the Z-score reflects that compression — and that is what –1.8σ encodes. The chart on CryptoQuant’s consensus dashboard confirms this: the sentiment line moved from neutral/bullish coloring across most of 2026 into red-coded bearish territory at the right edge, coinciding visually with Bitcoin’s price declining from the ~$95K range seen earlier in the year toward the current zone near $73K.
It is also worth noting the broader asset comparison embedded in CryptoQuant’s data. Among major assets tracked on November 11, Hyperliquid sits at 78% bullish (77 calls), Solana at 77% bullish (162 calls), Zcash at 74% bullish, XRP at 67% bullish, and Ethereum at 61% bullish. Bitcoin, with the most analyst coverage and the most macro exposure, is now the asset where consensus has deteriorated most sharply in Z-score terms. This is not an altcoin rotation story — it is a Bitcoin-specific macro reset. The ongoing USDT supply contraction of $6.6B in 60 days provides a further liquidity context: stablecoin supply shrinking at this pace reduces dry powder available for buying pressure.
What the Index Says — And What It Doesn’t
The –1.8σ reading confirms that professional analyst consensus has deteriorated to a statistically unusual degree over a 7-day window. It confirms that the three cited macro catalysts — ETF outflows, CPI-driven inflation concern, and Nasdaq weakness — are registering in expert opinion, not just in derivatives pricing. It also confirms that the speed of this deterioration (0.8σ in 7 days) is fast enough to be meaningful rather than incremental drift.
What it does not say: it does not predict a specific price bottom, it does not assign a probability to recovery, and it does not indicate how long the bearish phase lasts. A –1.8σ reading can deepen to –2.5σ or reverse to –0.5σ within days depending on macro catalysts. The index is a composite of human expert opinion — not a quant model with defined error bounds. The green annotation on the chart suggests some analysts read the swept lows as potential accumulation and squeeze territory, but that counter-thesis is a minority view at –1.8σ compression.
Bullish Scenario
A reversal in ETF flows — net inflows returning for three consecutive days — combined with a softer inflation reading would likely push the Analyst Consensus Index back toward the –1.0σ range. That would represent a 0.8σ recovery in expert opinion and would relieve pressure on the $73K zone. Any sustained Nasdaq recovery above its November 11 close would accelerate that re-rating.
Bearish Scenario
Continued ETF outflows through the week of November 11 and a failure of Bitcoin to hold the $73K zone would likely push the Analyst Consensus Index below –2.0σ — a threshold that historically corresponds to maximum fear readings and capitulation-phase sentiment. A close below $73K on a daily basis would validate the breakdown visible at the right edge of the CryptoQuant dashboard chart.
The Analyst Consensus Index has moved 0.8 standard deviations in seven days, reaching –1.8σ — a reading labeled explicitly as Bearish on CryptoQuant’s live dashboard. The mechanism is clear: ETF outflows, a hot CPI print, and Nasdaq weakness compressed expert conviction simultaneously. With 90 bullish analysts against 58 bearish out of 150 active, the raw majority remains technically bullish — but the Z-score tells the more accurate story of how fast that majority is eroding. Bitcoin is approaching $73K. Watch that level as the immediate test of whether the consensus deterioration is tracking a support zone or leading price into a deeper breakdown.
Frequently Asked Questions
What is CryptoQuant’s Analyst Consensus Index and how is it calculated?
Why does –1.8σ matter if 62% of analysts are still bullish on Bitcoin?
What would reverse the bearish Analyst Consensus reading for Bitcoin?
How does the Analyst Consensus Index differ from derivatives sentiment metrics like funding rates or open interest?
Source: CryptoQuant · Published by CoinsProbe Markets Desk
The opinions and market insights shared on CoinsProbe represent the views of individual authors based on prevailing market conditions at the time of publication. Cryptocurrency investments carry significant risk and volatility. Readers are encouraged to conduct their own research and seek professional financial advice before making investment decisions. CoinsProbe and its contributors do not accept responsibility for financial losses or decisions made based on published content.
CoinsProbe may publish sponsored articles, affiliate links, or promotional collaborations. All sponsored material is clearly labeled to maintain transparency with our audience. Our editorial decisions remain fully independent, and advertising partnerships do not influence reviews, rankings, or published opinions.
Since 2023, CoinsProbe has delivered reliable insights on cryptocurrency, blockchain, and digital assets. Our content is created by experienced researchers and analysts who follow strict editorial standards focused on accuracy, transparency, and credibility. Every article is carefully reviewed and verified using trusted sources and current market data. We provide unbiased analysis and timely updates covering everything from emerging crypto projects to major industry developments.