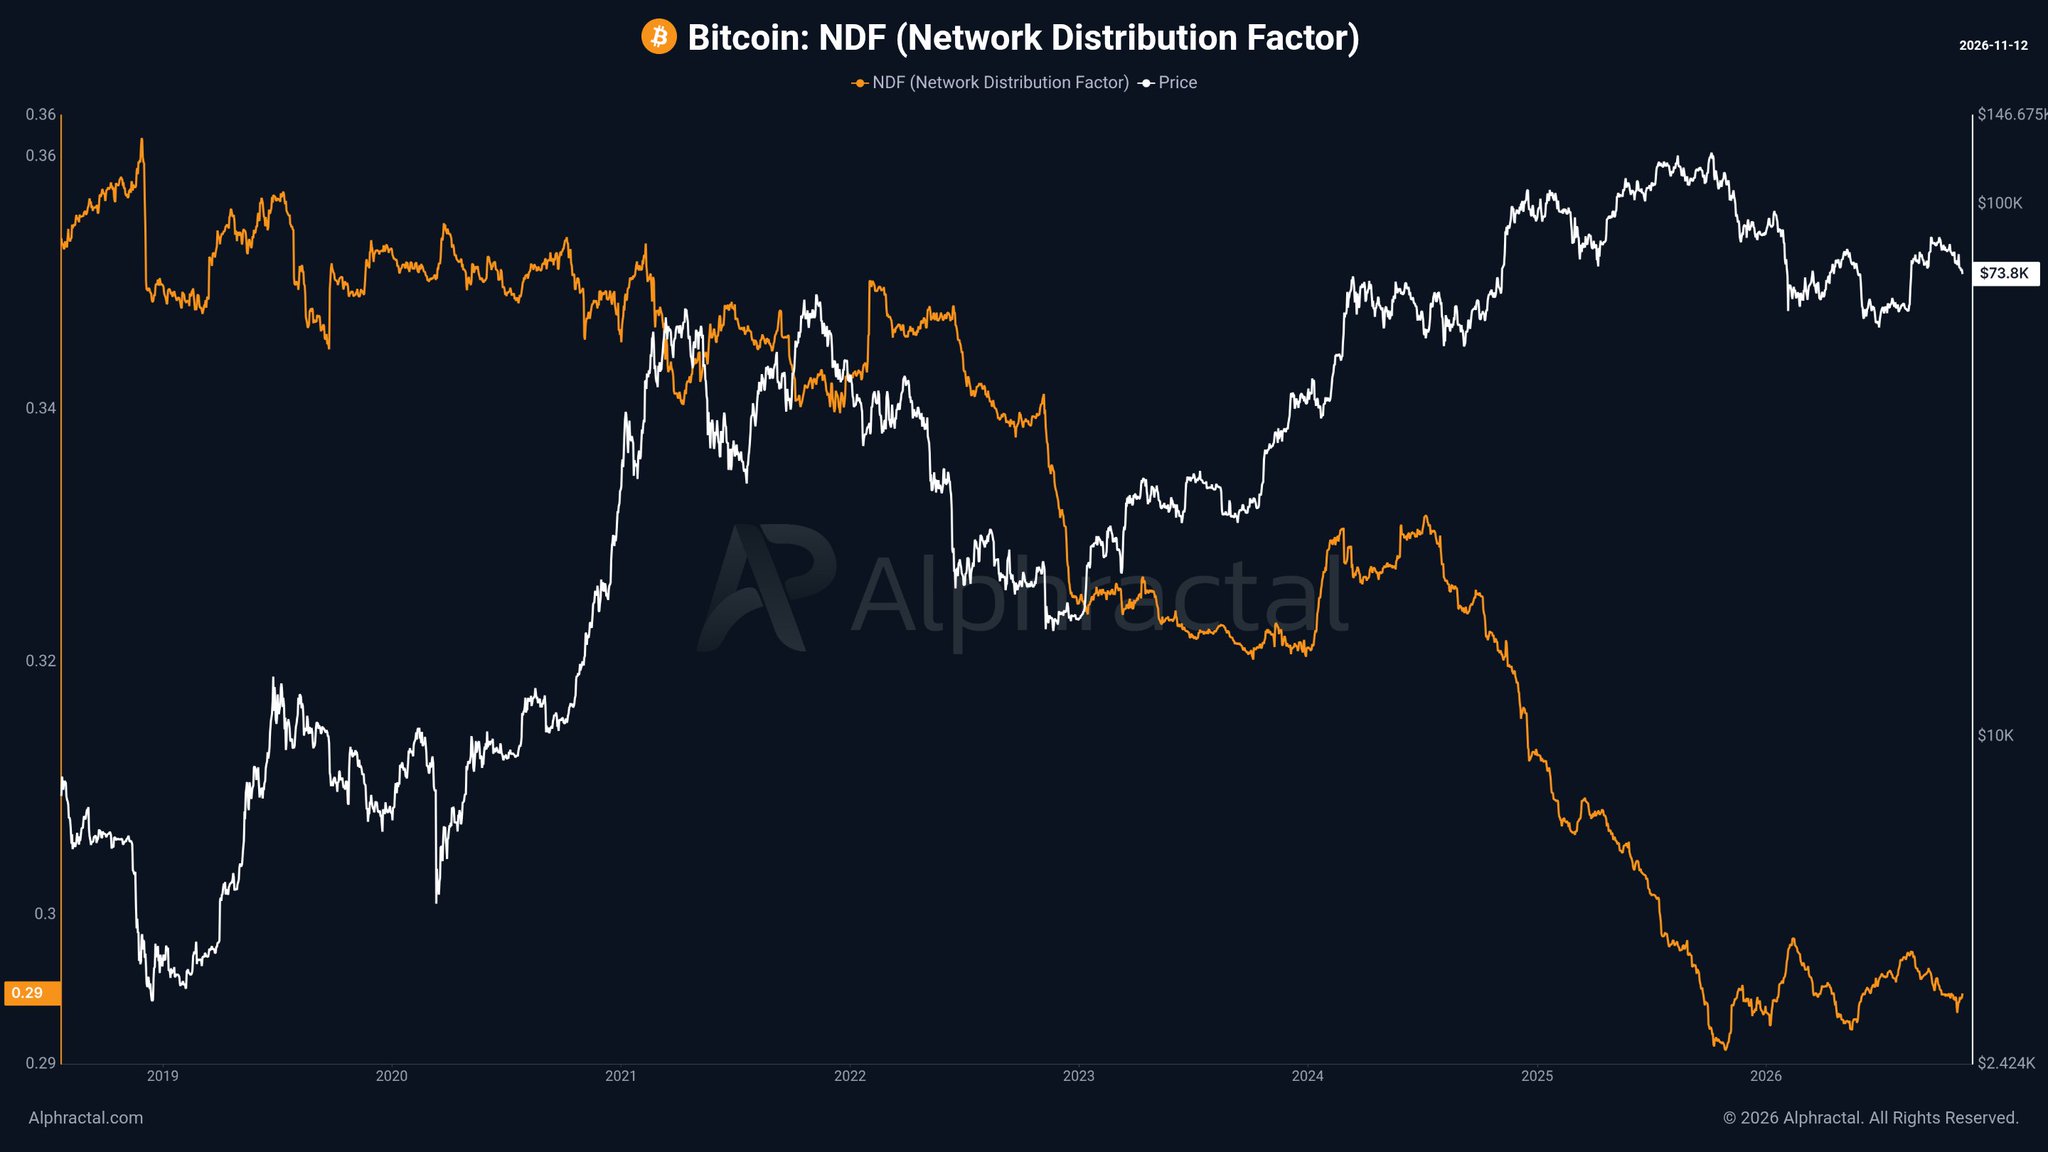
- Bitcoin trades at $72,969 (-1.38% 24h) as the NDF hits its lowest recorded reading of 0.29
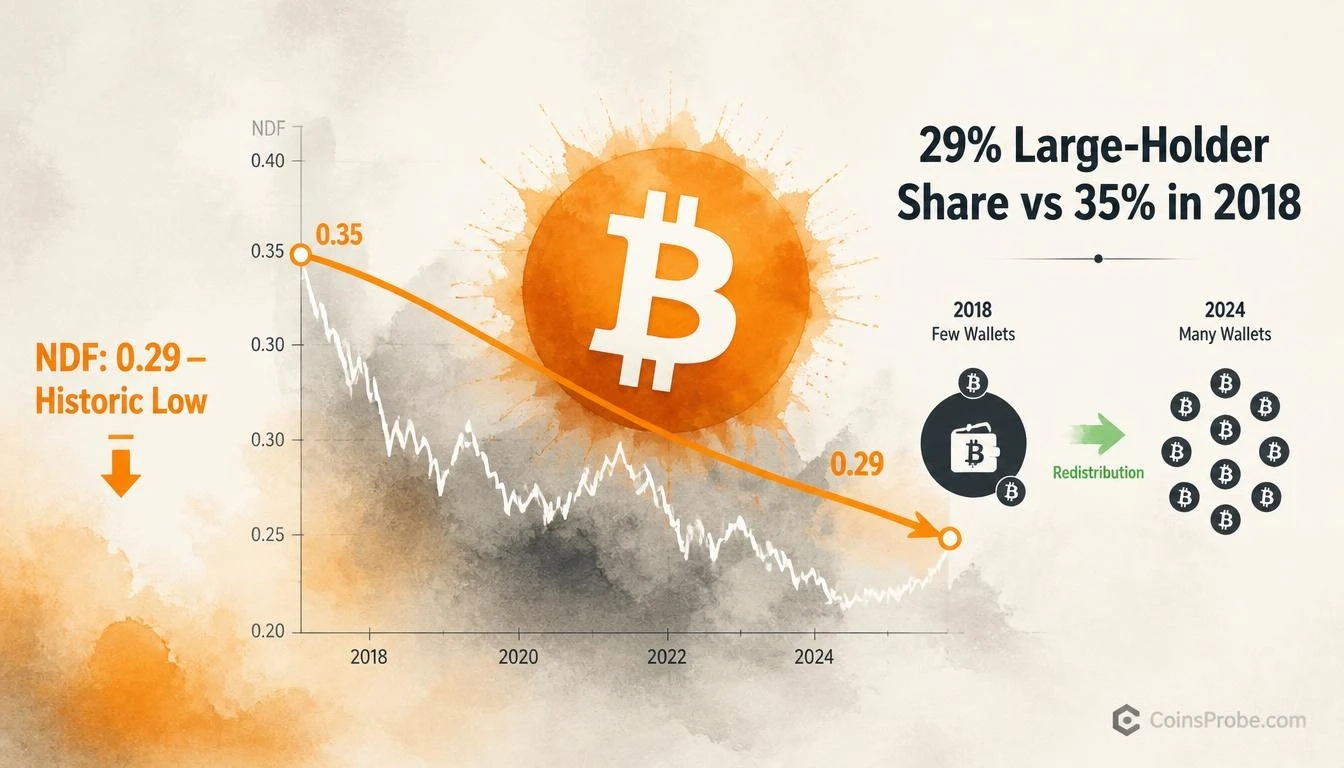
- Large-holder BTC concentration fell from 35%+ in 2018 to 29% today — the lowest in NDF history per Alphractal
- Bitcoin spot ETFs recorded 5 consecutive outflow days totaling -$1.44B; IBIT led with -$269.7M on Nov 11
- Strategy holds 850,364 BTC after adding 1,036 BTC for $81.9M in its most recent purchase
Bitcoin is trading at approximately $72,969 — down 1.38% in the past 24 hours — as an on-chain structural shift quietly unfolds beneath the surface. The Network Distribution Factor (NDF), tracked on the Alphractal platform, has fallen to its lowest recorded level, signaling that BTC supply is redistributing away from large holders at a pace not seen in this metric’s history.
Alphractal (@Alphractal) flagged the development directly: Bitcoin concentration among large holders has fallen to historically low levels, with the NDF now reading 0.29 — down from levels above 0.35 in 2018, marking the lowest point in the metric’s recorded history.
What the Network Distribution Factor Actually Measures
The NDF is not a price oscillator and not a momentum signal. It measures the proportion of Bitcoin supply held by large addresses — specifically, addresses controlling 0.01% or more of total circulating BTC supply. A declining NDF means large-holder concentration is falling: supply is moving from fewer, larger entities into the hands of a broader participant base. A rising NDF would signal the opposite — wealth reconcentrating toward large wallets.
The current reading of 0.29 means that large addresses — those holding at least 0.01% of total BTC supply — now account for approximately 29% of all Bitcoin in circulation. In 2018, that figure exceeded 35%. The decline is monotonic and persistent: even as Bitcoin set new all-time highs in 2024 and 2025, concentration continued to fall. Price appreciation did not reverse the distribution trend.
The 2018–2026 Decline — A Structural Transformation, Not a Cycle
What makes this reading significant is the context in which it occurs. Standard market cycles produce temporary swings in concentration data — whales accumulate near bottoms, distribute near tops. The NDF, by contrast, has trended in a single direction since 2018 without meaningful reversals. Per Alphractal’s data, large addresses held more than 35% of supply eight years ago. That figure now sits at 29% — a six-percentage-point structural decline across multiple full market cycles, including the 2020–2021 bull run and the 2024–2025 continuation.
The implication is not that large holders are absent from the market. It is that Bitcoin’s supply base has broadened materially. As the asset class attracted institutional vehicles — spot ETFs, corporate treasury allocations, custody solutions — the wallet-level data began to reflect a more distributed ownership structure. Alphractal notes an important caveat here: exchange wallets, ETF custodians, and institutional custody addresses aggregate the holdings of many individual participants under a single address. The NDF measures addresses, not individuals. The 29% figure for large-address holdings likely overstates true concentration among individual entities, because one Coinbase custody address may represent thousands of retail holders.
ETF Flows and Corporate Treasury Context
The timing of the NDF’s historic low intersects with a notable short-term shift in institutional flows. Data via SoSoValue shows that Bitcoin spot ETFs recorded a net outflow of $299.9M on November 11, 2026 — their fifth consecutive outflow day, bringing the five-day net to -$1.44B. IBIT led outflows at -$269.7M, with GBTC contributing -$39.1M. Total ETF net assets remain at $93.70B against a cumulative net inflow of $55.10B since launch, indicating the structural institutional position remains intact despite short-term redemption pressure.
Strategy (formerly MicroStrategy) continues adding to its corporate treasury position. As of November 9, 2026, the firm holds 850,364 BTC, having acquired 1,036 BTC for $81.9M in its most recent purchase and 2,114 BTC over the prior three weeks for $169.5M. This accumulation pattern — a single entity consistently adding to a large position — is precisely the type of activity the NDF’s address-aggregation caveat applies to: Strategy’s holdings appear as one large address but represent a corporate treasury decision, not a single individual’s concentration. For related on-chain context, see Bitcoin STH-SOPR Falls Below 1.0 — What Declining Exchange Inflows Signal.
What the NDF Reading Says — and What It Doesn’t
What it says: Bitcoin’s supply is structurally more distributed today than at any point since the NDF began tracking in 2018. The 29% large-address share is the lowest on record. This has occurred through full bull and bear cycles, suggesting it reflects a durable structural shift rather than a cyclical positioning event.
What it doesn’t say: The NDF at 0.29 is a non-directional structural metric. It does not predict a price direction, a bottom, or a rally. The chart shows no confirmed reversal signal — the pattern is still forming, with both NDF and price currently near their respective trough zones after the 2025 peak. The NDF cannot tell you whether Bitcoin at $72,969 is cheap or expensive. It tells you who holds it, not where it goes next.
What to watch: Any sustained reversal in the NDF back above 0.30 would signal large-holder reconcentration — a historically notable event that has preceded supply squeezes in prior cycles. Conversely, continued NDF compression toward 0.28 or below would signal further democratization of Bitcoin ownership, potentially reducing the marginal sell pressure that large-holder distribution events historically produce. For a view on current price support structure, see How Low Can BTC, ETH, and XRP Go? Key Levels to Watch Now.
The Macro Backdrop
Macro conditions provide the near-term context. Markets are pricing a 90.8% probability that the Federal Reserve holds rates at 4.00%–4.25% at the December 9, 2026 FOMC meeting, per SoSoValue data. The January 27, 2027 meeting presents a more complex picture, with a 61.7% probability of a hike to 4.25%–4.50% — a meaningful shift in rate trajectory expectations. Upcoming data releases including PPI on November 12 and Core PCE on November 24 will refine those probabilities. A hawkish surprise from either print could add near-term pressure to risk assets including Bitcoin, independent of any structural on-chain signal.
At $72,969, Bitcoin sits below its 2025 peak resistance zone visible on the NDF chart. The price structure remains within a declining pattern after that peak. The NDF, meanwhile, has reached its lowest recorded reading — a structural fact that does not resolve the near-term directional question but does establish the underlying ownership condition. For a broader price-level analysis, see Bitcoin Hits the EMA200 — Analyst’s Predicted Target Reached at $77,676.
The structural story is clear: Bitcoin is more broadly held today than at any point in its measurable history. Whether that distributed ownership base absorbs the current price decline or amplifies it remains the open question — one that price action at current levels and upcoming macro data releases will begin to answer.
Watch for any NDF reversal above 0.30 as the first signal that large-holder reconcentration is resuming.
Source: x.comFrequently Asked Questions
What is the Network Distribution Factor (NDF) and how is it calculated?
Does the historic NDF low mean Bitcoin is about to rally?
Why did Bitcoin’s large-holder concentration drop even as prices hit new all-time highs in 2025?
What NDF level would signal that large holders are reconcentrating Bitcoin?
Source: Alphractal · Published by CoinsProbe Markets Desk
The opinions and market insights shared on CoinsProbe represent the views of individual authors based on prevailing market conditions at the time of publication. Cryptocurrency investments carry significant risk and volatility. Readers are encouraged to conduct their own research and seek professional financial advice before making investment decisions. CoinsProbe and its contributors do not accept responsibility for financial losses or decisions made based on published content.
CoinsProbe may publish sponsored articles, affiliate links, or promotional collaborations. All sponsored material is clearly labeled to maintain transparency with our audience. Our editorial decisions remain fully independent, and advertising partnerships do not influence reviews, rankings, or published opinions.
Since 2023, CoinsProbe has delivered reliable insights on cryptocurrency, blockchain, and digital assets. Our content is created by experienced researchers and analysts who follow strict editorial standards focused on accuracy, transparency, and credibility. Every article is carefully reviewed and verified using trusted sources and current market data. We provide unbiased analysis and timely updates covering everything from emerging crypto projects to major industry developments.