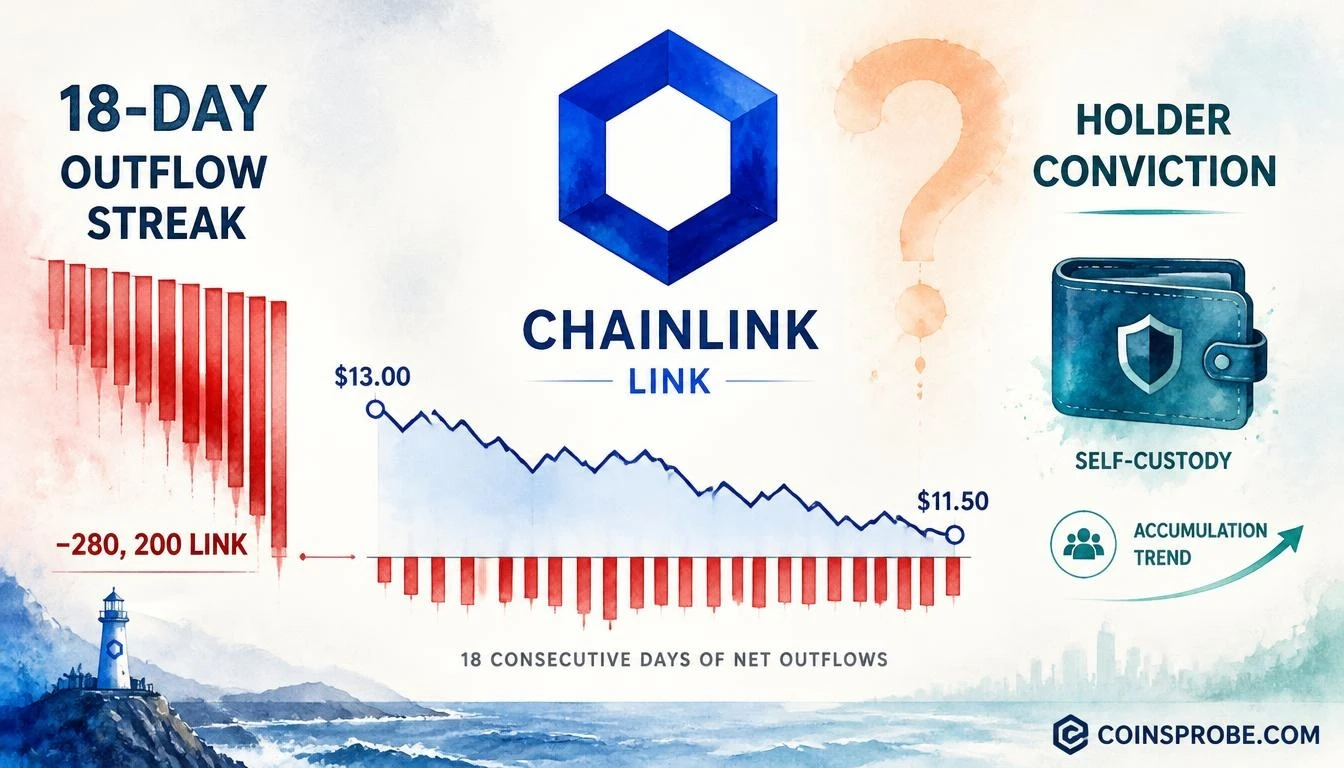
- LINK is trading at $11.60 (−1.22% 24h) after declining from ~$13 over the past 18 days
- 18 consecutive days of net LINK outflows from Binance, latest reading −280,200 LINK — per CryptoQuant analyst MorenoDV_
- A large 8.7M LINK net inflow preceded the streak — partial redistribution of that deposit may account for some outflows
- Constructive signal requires continued outflows AND price stabilization; LINK making lower lows keeps this pre-confirmation
Chainlink is trading at $11.60 — down 1.22% in the past 24 hours — with a market cap of approximately $8.9 billion. While the price chart looks bearish, having declined from roughly $13 to $11.50 over the past three weeks, one on-chain metric tells a structurally different story: for 18 consecutive days, LINK has been leaving Binance on net — not entering it.
The divergence was flagged by CryptoQuant analyst MorenoDV_ (@MorenoDV_) in a Quicktake published October 28, 2026. His observation: “Chainlink’s price is retreating, yet LINK continues to leave Binance.”
That sentence carries more weight than it appears to at first read. When an asset falls in price while exchange supply simultaneously contracts, the two forces are working against each other — and one of them represents a deliberate, sustained behavioral decision by holders.
The Outflow Signal — 18 Days, 280,200 LINK on Net
Exchange netflow measures the difference between tokens deposited to and withdrawn from an exchange over a given period. A persistent negative netflow — what the chart labels as -280,200 LINK on the most recent reading — means more LINK is being withdrawn than deposited. That is supply leaving the tradeable pool.
According to MorenoDV_’s CryptoQuant Quicktake, the streak spans 18 consecutive days of net outflows from Binance. During this same window, LINK’s price declined from approximately $13 to roughly $11.50. The critical detail is not any single day’s reading — it is the consistency. As the analyst notes: “The consistency of the withdrawals is more informative than any single daily reading: this is a sustained pattern rather than an isolated transfer.”
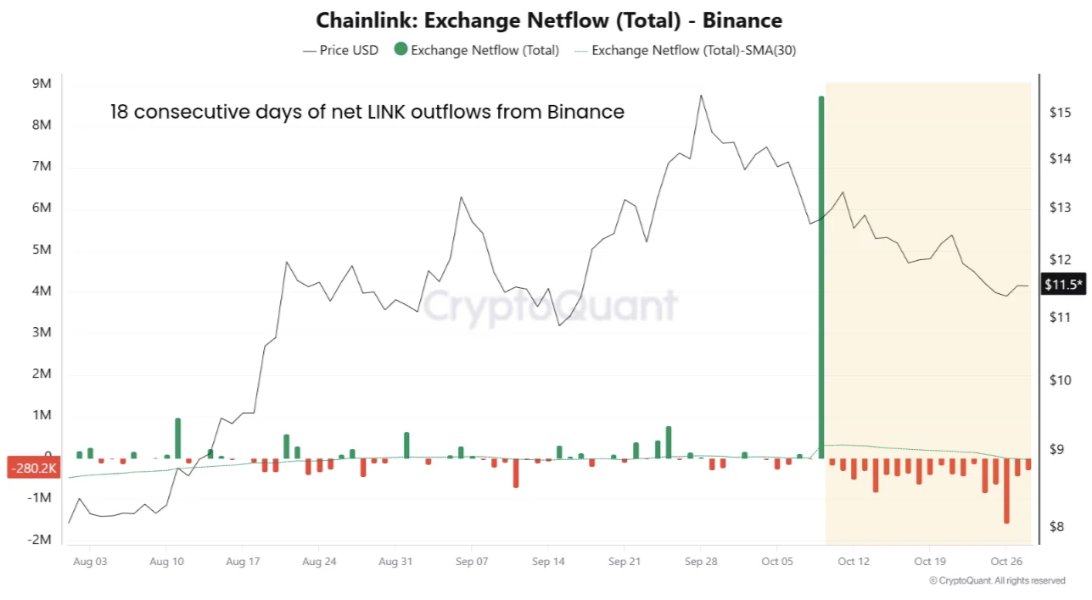
The chart covering August 3 through late October shows the netflow bars turning predominantly red — indicating net outflows — from around October 10 onward, coinciding almost exactly with the price decline from peak levels near $15 in early October. Price is currently positioned below that October peak resistance zone, at the $11.5 level marked on the right axis of the chart.
What the Outflows Likely Mean — And What They Don’t
Two behavioral explanations are most consistent with the data. First, investors who purchased LINK during the correction may be moving tokens into external self-custody — accepting short-term price volatility in exchange for longer-term exposure without the counterparty risk of leaving assets on an exchange. Second, existing holders may be withdrawing LINK they no longer intend to trade actively, reducing exchange-available supply as a byproduct of conviction rather than urgency.
Both interpretations point toward the same structural conclusion: the actors withdrawing LINK are not primarily sellers. Sellers deposit to exchanges; they do not withdraw from them. The 18-day outflow streak means the marginal behavior of LINK holders has leaned toward custody, not liquidation.
However, MorenoDV_ is explicit about what the data cannot confirm: “Withdrawals reveal where tokens are moving, not why. Transfers to other venues, custody changes, or wallet reorganizations remain possible. The chart cannot establish who is accumulating or whether these movements represent fresh purchases.” That is an important constraint. Outflows narrow the probability distribution of holder intent — they do not prove accumulation.
There is also a sequencing consideration the analyst flags directly. A large net inflow of roughly 8.7 million LINK preceded the current withdrawal streak. The subsequent outflows may partly represent the redistribution of that earlier deposit — meaning a portion of the 18-day outflow could reflect position management by whoever deposited the 8.7M LINK, rather than entirely new accumulation. This is the kind of analytical nuance that separates exchange flow data from a clean buy signal.
Supply Shift Without Price Confirmation — The Incomplete Picture
The honest read of the data is this: a supply shift is underway on Binance, but price has continued declining regardless. As MorenoDV_ states directly in his note: “Price has continued falling, showing that this supply shift has yet to translate into sustained buying strength.”
Exchange outflows reduce the available float for selling pressure over time — but they do not generate immediate buying demand. For the divergence to become a reversal signal rather than simply an early-stage setup, two things need to occur simultaneously: the outflow trend needs to continue, and spot demand needs to strengthen enough to absorb whatever sell pressure remains. The analyst identifies the specific condition: “The constructive signal would be continued withdrawals alongside price stabilization and stronger spot demand.”
If LINK continues making lower lows while outflows persist, the divergence remains an early indication of changing supply conditions — not confirmation of a market reversal. The on-chain data describes the supply side; the price chart describes the demand side. Right now, supply is tightening and demand has not responded.
This dynamic is not unique to LINK — a similar pattern in Bitcoin exchange flows was documented recently at Bitcoin Exchange Netflow Turns Positive for First Time Since September 21, illustrating how netflow reversals can precede — but not guarantee — price stabilization.
Fundamental Context — $1.97B TVL, $4.44M in 30-Day Fees
The on-chain behavioral signal sits against a fundamental backdrop that is not deteriorating. DeFiLlama data shows Chainlink’s ecosystem carrying $1.97 billion in TVL and generating $4.44 million in fees over the past 30 days. That fee base reflects active oracle consumption across DeFi protocols — Chainlink’s price feeds remain load-bearing infrastructure for lending, derivatives, and stablecoin systems across multiple chains.
| Metric | Value |
|---|---|
| TVL | $1.97B |
| 24h Fees | $4K |
| 30d Fees | $4.44M |
On the institutional side, LINK spot ETF products tracked by SoSoValue show total net assets of $209.5 million and cumulative inflows of $179.2 million since launch — though the past five trading days logged zero net inflow. Daily ETF trading volume was $7.4 million as of October 28. The ETF data is neutral-to-quiet, neither adding to nor detracting from the on-chain outflow thesis.
Macro events on the calendar include ISM Manufacturing PMI on November 1 and CPI data on November 9. Risk-asset sensitivity to both prints is elevated given the current macro environment — either a hotter-than-expected inflation reading or a contraction in manufacturing could amplify LINK’s near-term price movement in either direction.
Bullish Scenario
If LINK stabilizes at or above current levels while the outflow streak extends beyond 18 days, the supply contraction on Binance begins to carry more weight as a signal. Spot demand returning to meet the reduced exchange float would be the mechanism for price recovery. The October high near $15 represents the prior peak resistance zone that would need to be reclaimed for the chart structure to turn constructive.
Bearish Scenario
If LINK continues printing lower lows through $11.50 and below while outflows persist, the divergence remains pre-confirmation — a potential early signal, not an active reversal. MorenoDV_ addresses this directly: in that scenario, the outflows are an early indication of changing supply conditions, not a market bottom. The demand side of the equation has not yet validated the supply-side data.
The 18-day Binance outflow streak is a meaningful behavioral signal — one that narrows the probability of indiscriminate selling by LINK holders. But CryptoQuant’s MorenoDV_ is precise about what it does and does not confirm: supply is leaving the exchange, motive remains inferred, and price has not yet responded. The constructive read requires continued outflows alongside price stabilization and stronger spot demand. Watch whether LINK can hold $11.50 — that is the level where supply contraction meets demand. If it breaks further while outflows persist, the signal remains early-stage. If it stabilizes here with outflows intact, the divergence becomes a setup worth taking seriously.
Frequently Asked Questions
What does a Binance exchange netflow of −280,200 LINK actually mean?
Why did a large 8.7 million LINK inflow precede the outflow streak, and does that undermine the signal?
What specific condition must be met for the LINK outflow divergence to become a confirmed reversal signal?
How large is Chainlink’s ecosystem relative to its current price correction?
Source: CryptoQuant · Published by CoinsProbe Markets Desk
The opinions and market insights shared on CoinsProbe represent the views of individual authors based on prevailing market conditions at the time of publication. Cryptocurrency investments carry significant risk and volatility. Readers are encouraged to conduct their own research and seek professional financial advice before making investment decisions. CoinsProbe and its contributors do not accept responsibility for financial losses or decisions made based on published content.
CoinsProbe may publish sponsored articles, affiliate links, or promotional collaborations. All sponsored material is clearly labeled to maintain transparency with our audience. Our editorial decisions remain fully independent, and advertising partnerships do not influence reviews, rankings, or published opinions.
Since 2023, CoinsProbe has delivered reliable insights on cryptocurrency, blockchain, and digital assets. Our content is created by experienced researchers and analysts who follow strict editorial standards focused on accuracy, transparency, and credibility. Every article is carefully reviewed and verified using trusted sources and current market data. We provide unbiased analysis and timely updates covering everything from emerging crypto projects to major industry developments.