- BTC trades at $77,568 (-3.23%) after being rejected at the 50-day SMA (~$82,500), which has flipped to confirmed resistance
- Analyst @alicharts maps dip-buy reassessment at BTC's 200-day SMA (~$73,000), ETH near $1,976.65, and XRP at $1.00 channel base
- ETH breaks down from a right-angled ascending broadening pattern at $2,273.86 — measured target near $2,000
- BTC spot ETFs recorded +$17.1M net inflow on Oct 29 (4th consecutive inflow day) per SoSoValue, even as spot price fell
Bitcoin is trading at $77,568 — down 3.23% in the past 24 hours and sitting on $1.56 trillion in market cap — after a clean rejection at its 50-day moving average flipped that line from support to confirmed resistance. The sell-off is not a random pullback. It has a named trigger and a clear map for where buyers may return.
Crypto analyst Ali Martinez (@alicharts), whose daily chart work has consistently anchored dip-buy decisions to major moving average confluences, published a six-part thread on October 29, 2026, mapping the next actionable levels across Bitcoin, Ethereum, and XRP. The core conclusion: the 200-day moving average near $73,000 is where he plans to reassess a BTC dip buy — not before.
What Triggered the Sell-Off — Binance Hack Fears and the $2.3B Freeze
The catalyst is specific. Reports spread on October 29 of unusual wallet transfers linked to Binance, with more than $2.3 billion in stablecoins frozen on-chain and a 200 million USDT movement flagged at 5:44 p.m. ET. The reports — later contextualized against Binance’s $151.5B in verified reserves — triggered immediate risk-off selling across major assets. For the full picture on what the on-chain data actually shows, see Binance $151.5B Reserves vs. $6.3B Hack — What the Numbers Actually Show and Binance Hack: $6.3B Drained — How On-Chain Freezes Contained the Damage.
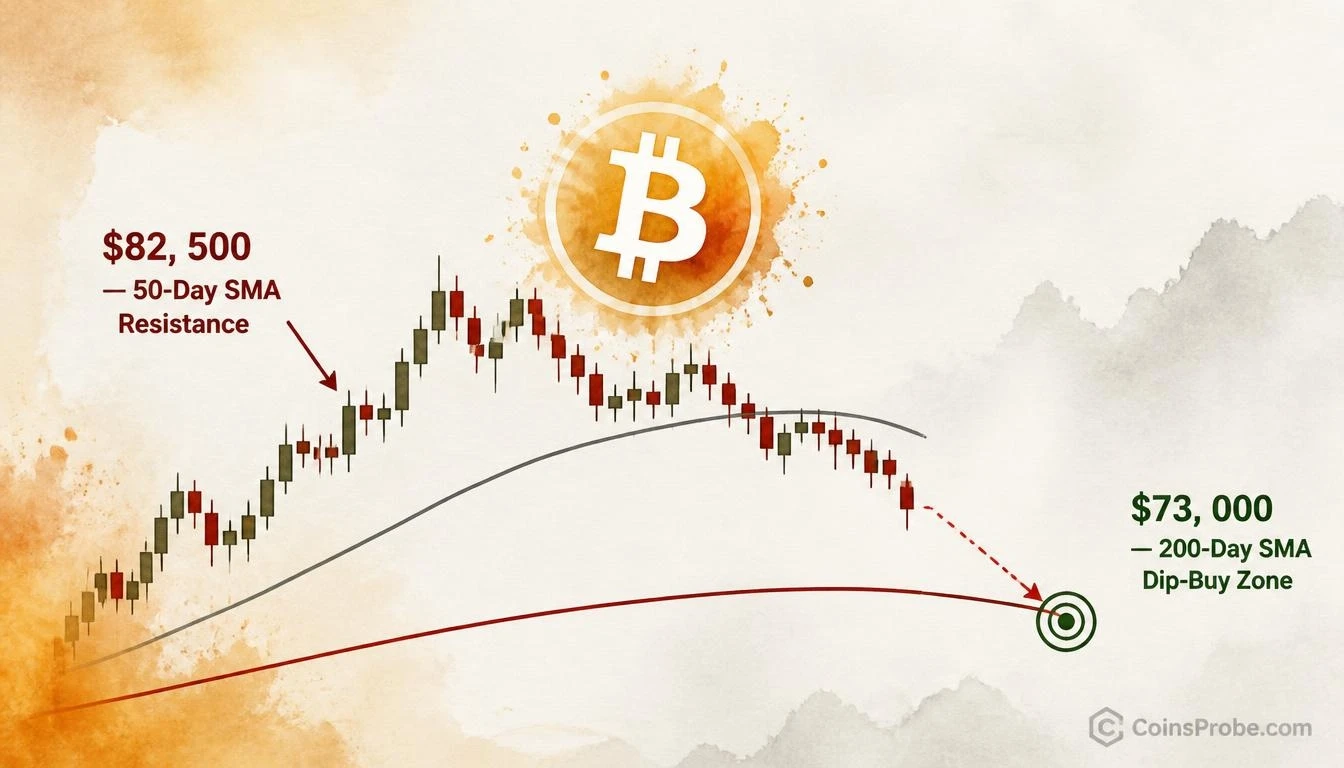
As those reports circulated, Bitcoin was in the process of retesting its 50-day moving average from below — a retest that failed. The 50-day SMA, sitting near $82,500 on the chart, rejected price decisively, and Bitcoin dropped toward $78,000 intraday before continuing lower to the current $77,568.
Signal 1 — Bitcoin: 50-Day SMA Flips to Resistance, 200-Day at $73,000 Is the Line
The daily chart shared by @alicharts shows the mechanics clearly. Bitcoin formed a sharp trough in August–September, rallied into October highs, and then began declining. The most recent sequence — a retest of the 50-day SMA (gray, approximately $82,500) followed by rejection — confirms the 50-day has transitioned from support to resistance. Price is now below that line and declining toward the 200-day SMA (red), which is rising gradually from the lower left and converging near $73,000.
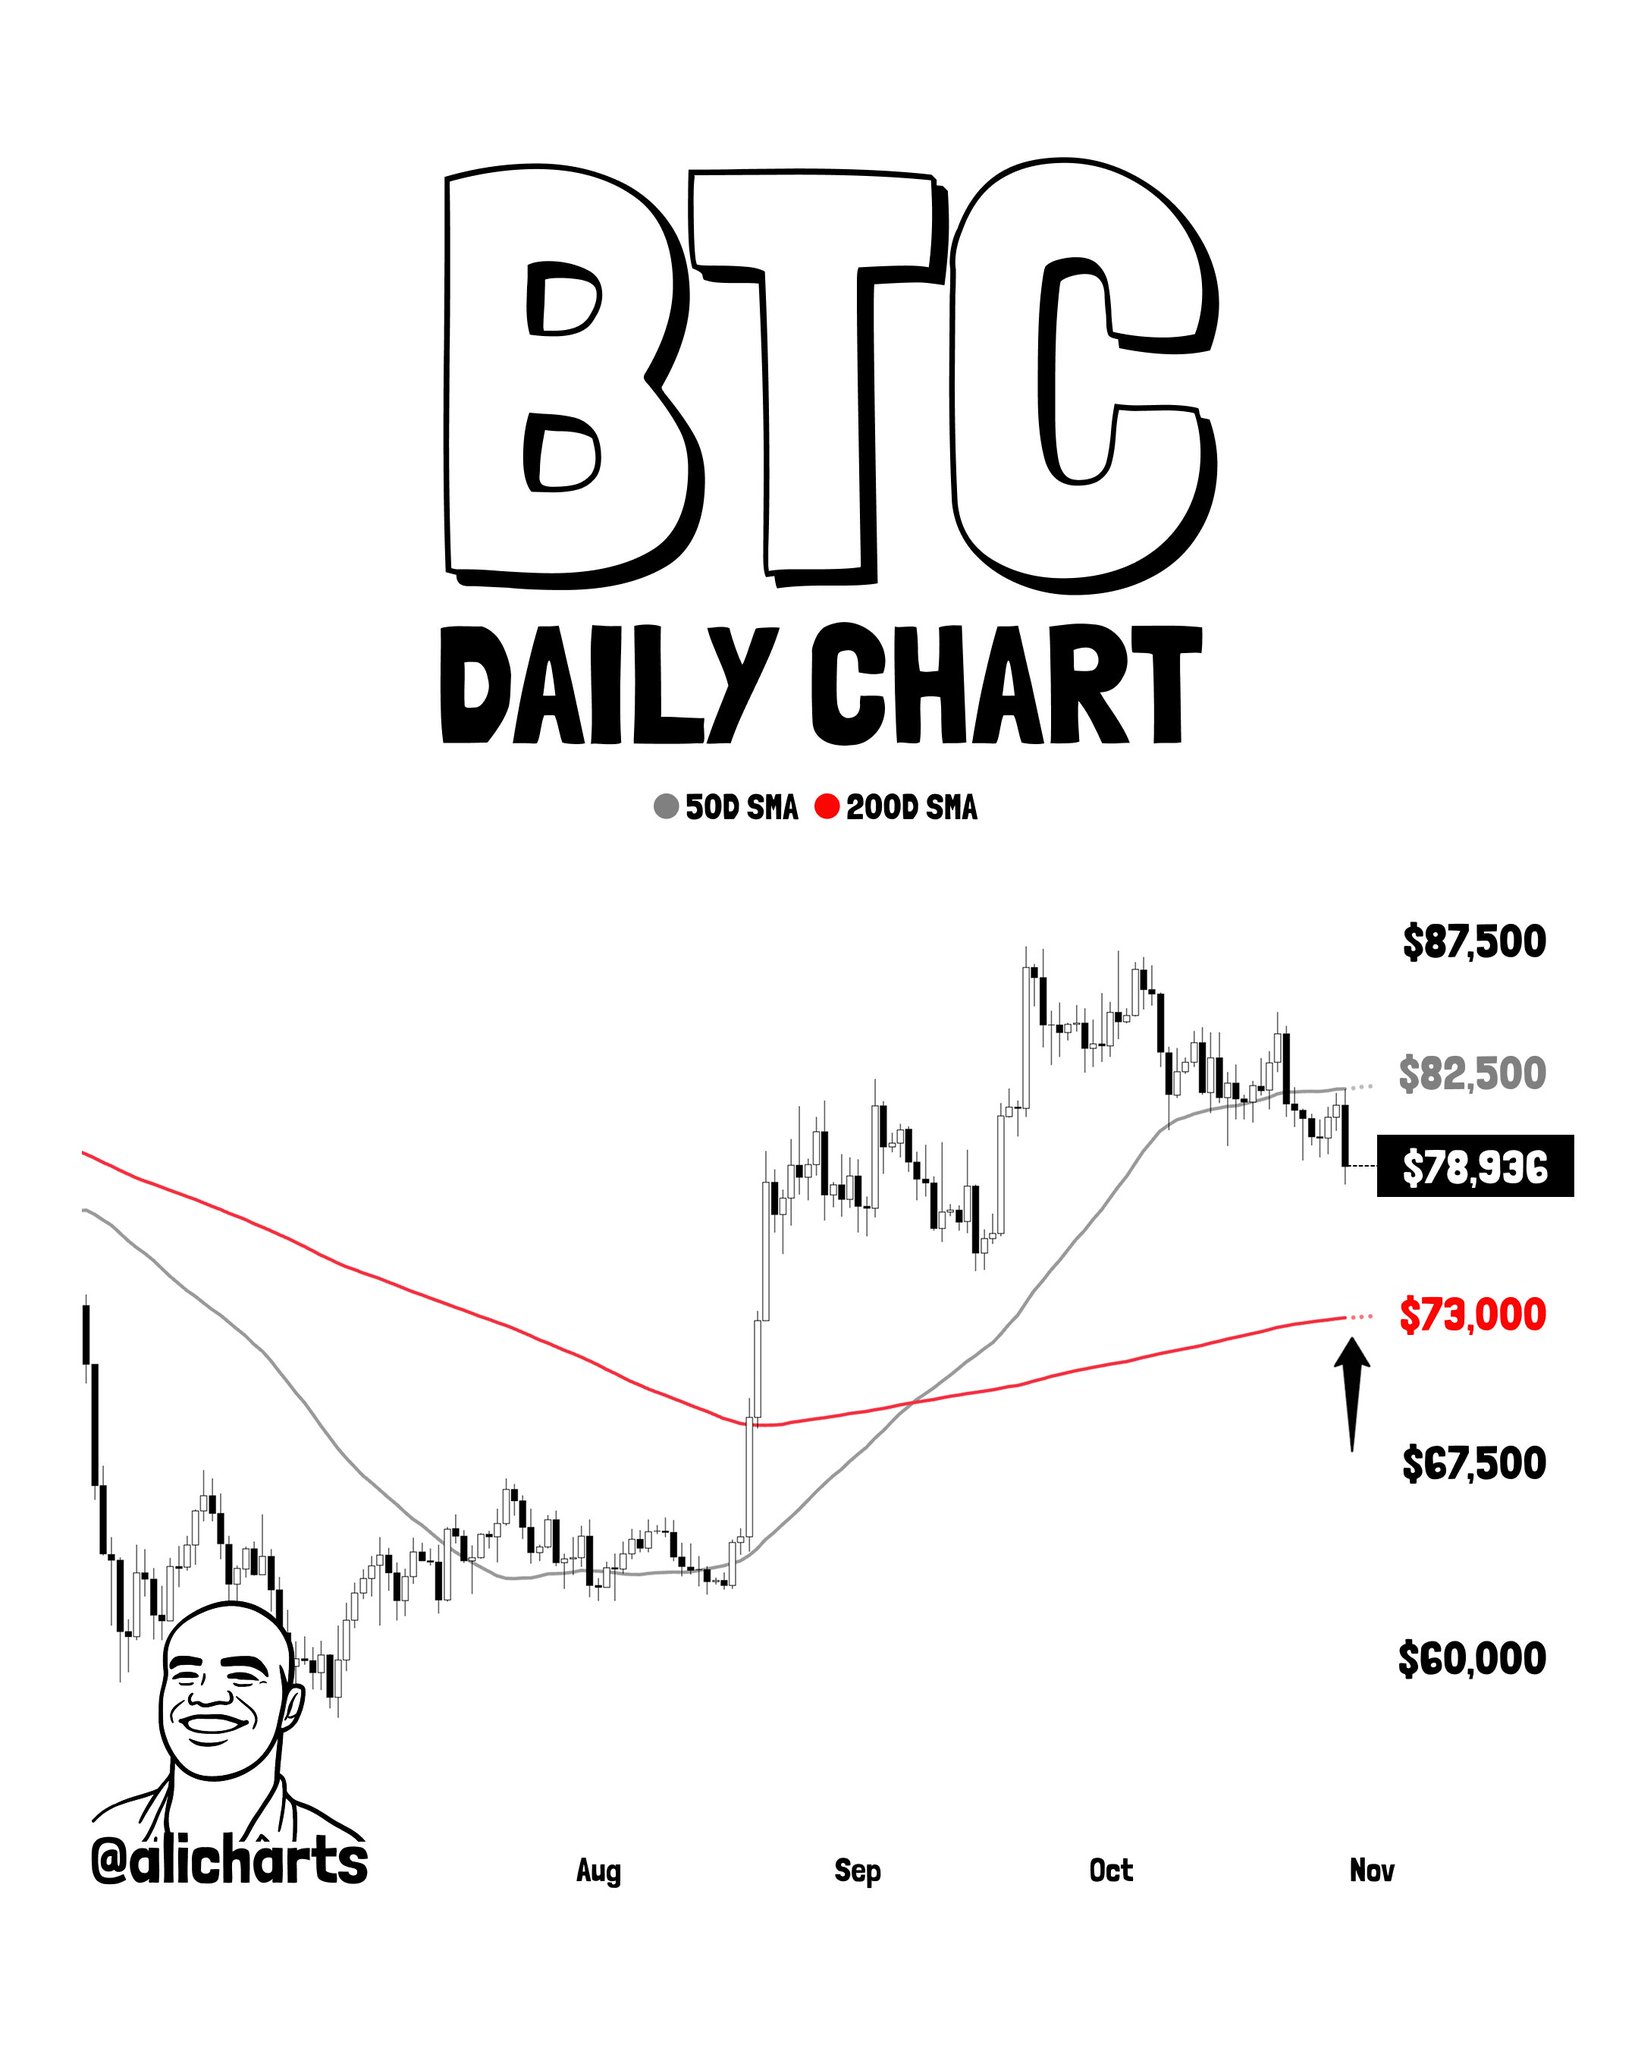
Martinez is explicit: $73,000 is where he plans to reassess a dip buy — not where he has placed a purchase order. The 200-day moving average is the last major trend-defining level before the $67,500 zone visible on the chart. A hold at the 200-day would keep Bitcoin’s macro uptrend structure intact. A failure to hold would open significantly deeper downside.
The BTC spot ETF data adds context. On October 29, spot Bitcoin ETFs recorded a net inflow of +$17.1M, with IBIT taking in $12.8M and FBTC adding $10.5M — the fourth consecutive day of inflows, per SoSoValue data. Total ETF net assets stand at $104.27B. That institutional flow has not reversed. It has simply not been large enough to absorb the panic selling triggered by the Binance reports.
Signal 2 — Ethereum: Ascending Broadening Pattern Breaks Down, $2,000 Is the Target
Ethereum’s chart tells a structurally separate story. On the daily timeframe, ETH formed a right-angled ascending broadening formation — a pattern defined by a flat upper boundary and a rising lower trendline. That lower trendline has now broken. Price at time of writing is at $2,273.86, confirmed below the $2,391.25 support level, below the $2,480.19 zone, and below the rising lower boundary of the pattern itself.
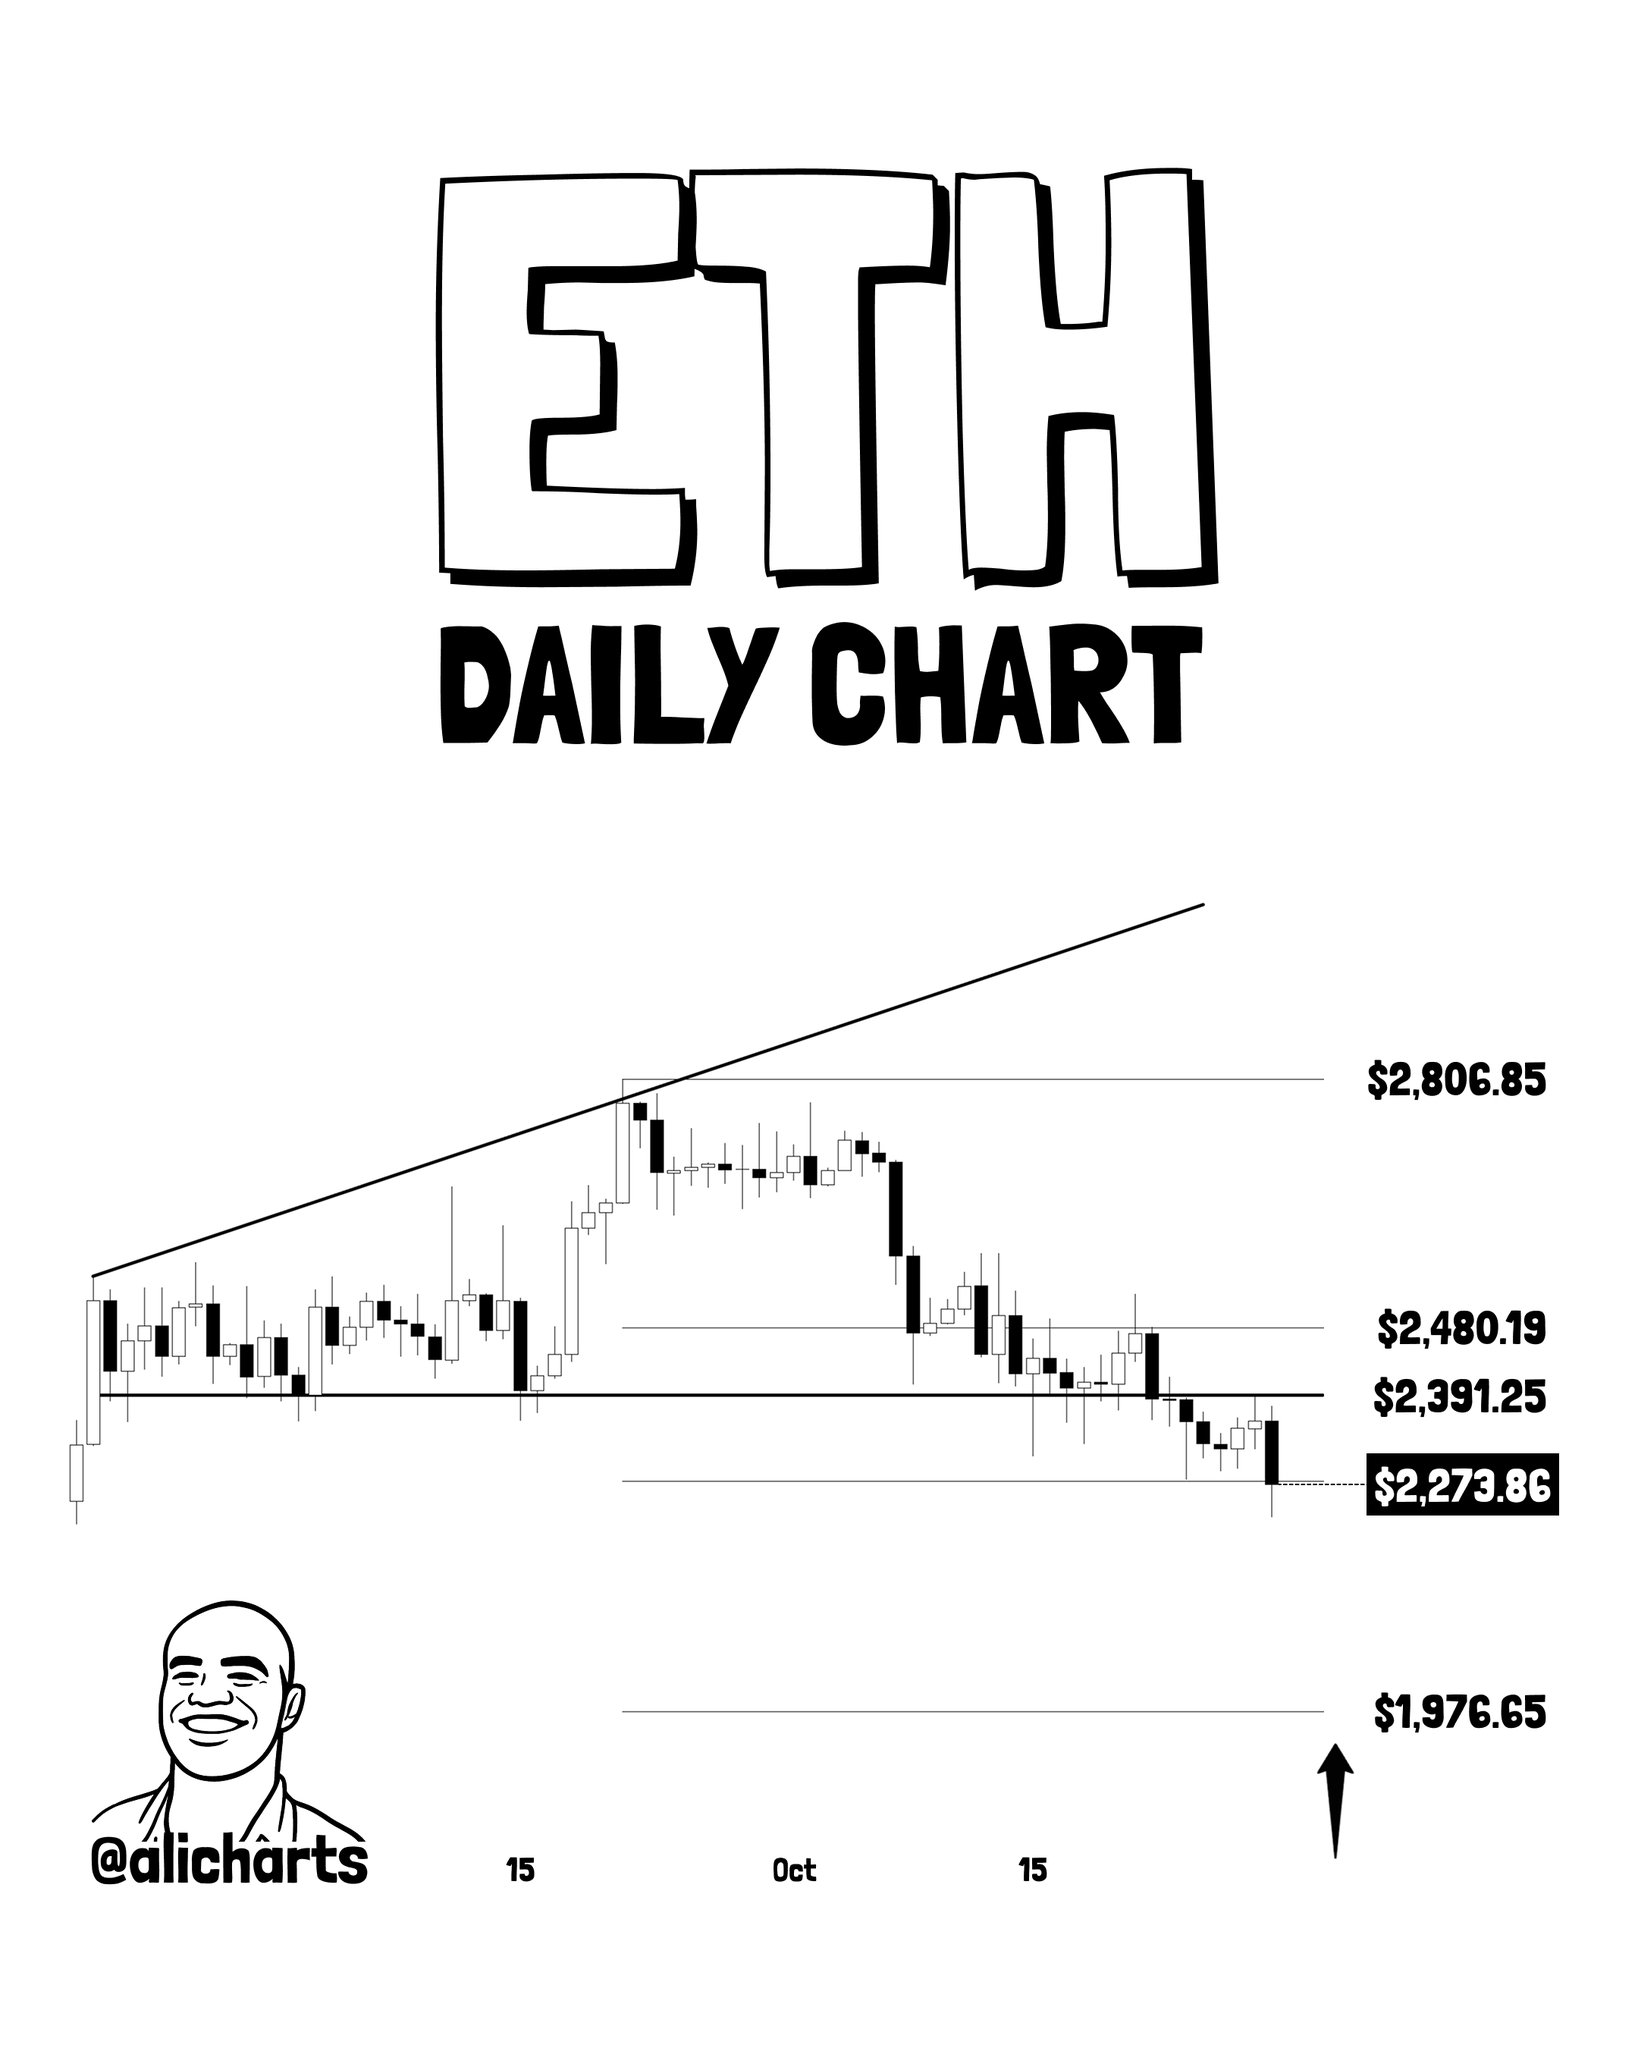
The breakdown from this formation points toward the $1,976.65 level — the zone Martinez identifies as a potential buying opportunity if ETH finds support there. This is not a guaranteed bottom call. It is a map: the pattern’s measured implication lands near $2,000, and that is where the analyst will reassess. The key levels on the chart — $2,806.85 at the top, $1,976.65 at the base — define the full range of the structure that has now broken.
Signal 3 — XRP: Mid-Channel Support Lost, $1.00 Lower Boundary Now in View
XRP has been ranging inside a horizontal parallel channel since February 2024, bounded by $1.55 at the top and $1.00 at the base. The midline near $1.40 — which had acted as interior support — has been lost. XRP is now at $1.25, flagged on the chart with a current-price box, sitting between the broken $1.40 midline above and the $1.00 lower channel boundary below.
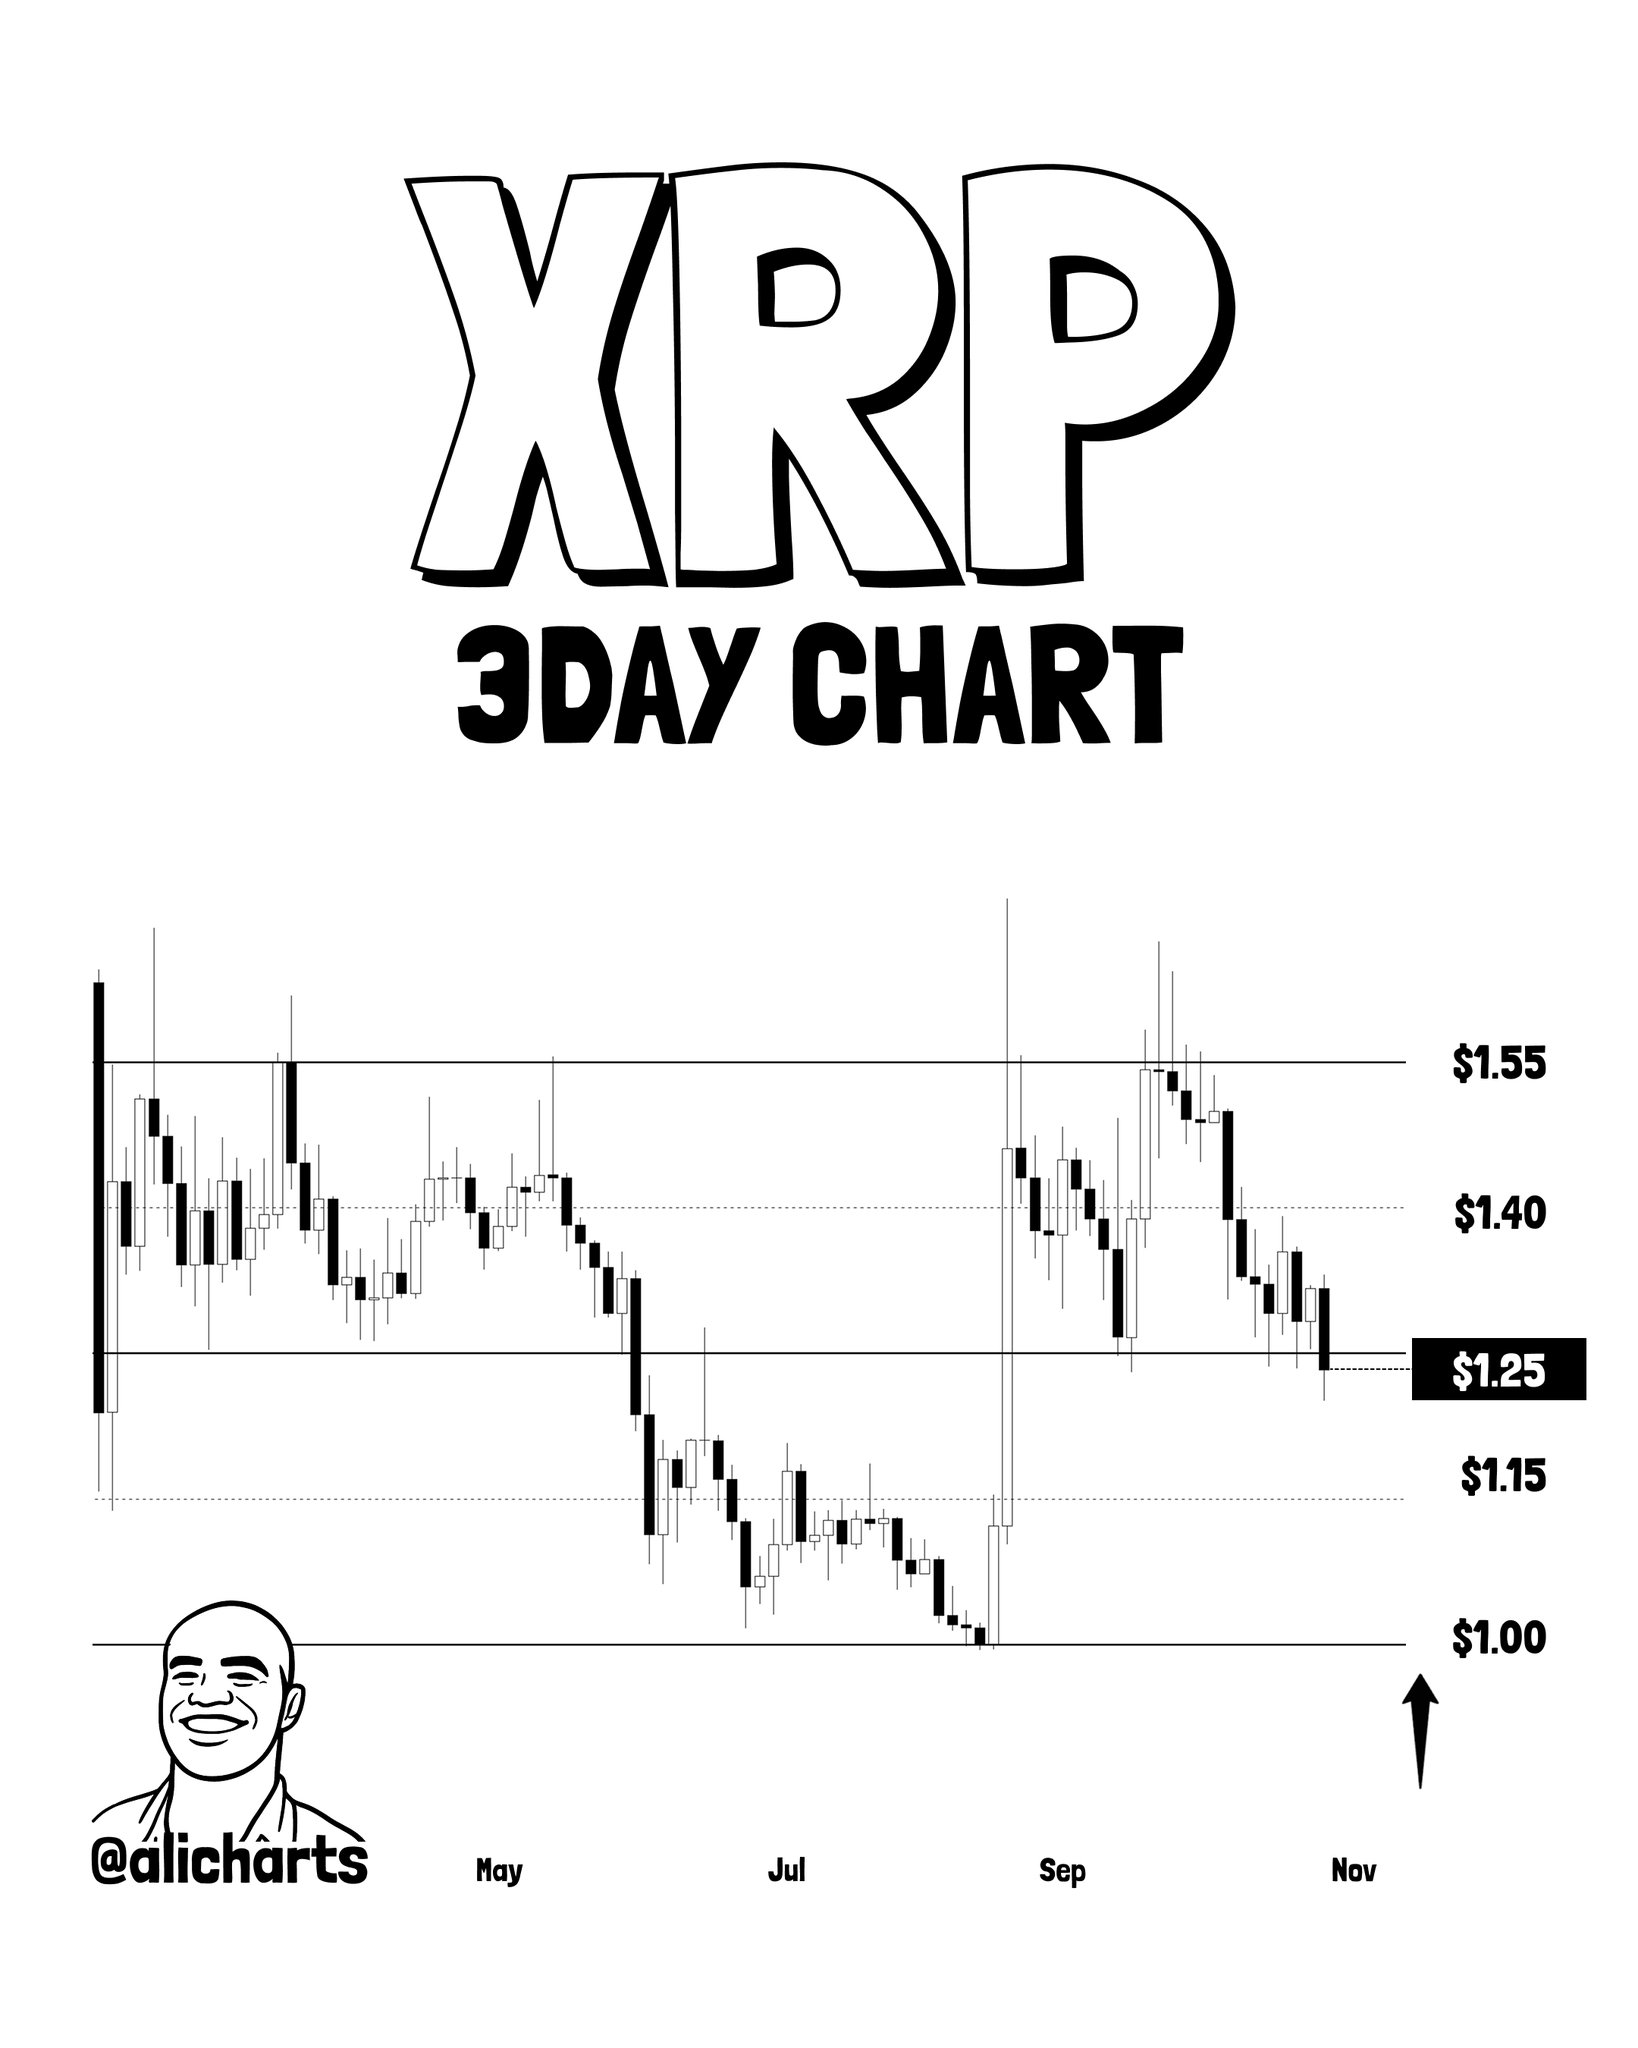
Martinez’s chart marks an upward arrow near $1.00, indicating that level is the next watch zone if $1.25 fails to hold. The structure is not a bullish setup at this moment — it is a ranging asset that has lost its mid-range footing and is sliding toward the channel floor. A reclaim of $1.40 would be the first signal that the structure is repairing. Absent that, $1.00 remains the deeper support.
Macro Backdrop — FOMC and Upcoming Data
The macro calendar is active. Markets are pricing a 74.4% probability of the Fed holding rates at 4.00%–4.25% at the December 9 FOMC meeting, per SoSoValue data. CPI figures arrive on November 9 — the next hard macro input that could shift the risk-on/risk-off calculus for crypto. With Bitcoin already under pressure from a security-driven sell-off, a hot CPI print would remove one of the few remaining bullish tailwinds. A soft number could accelerate the dip-buy case at $73,000.
Strategy (MSTR) holds 848,517 BTC as of October 19 and added 267 BTC for $22.1M in its latest purchase — a signal that at least one institutional buyer has not changed its accumulation posture despite the volatility. That context matters, but it is not a price floor.
The broader context on this event: crypto losses have risen sharply in 2026. For the full data, see Crypto Losses Hit $9B in 2026 — 750 Incidents, Up 133% From 2025.
The Dip-Buy Map — What @alicharts Is Watching
| Asset | Breakdown Level | Dip-Buy Reassessment Zone | Deeper Support |
|---|---|---|---|
| BTC | 50-Day SMA (~$82,500) | 200-Day SMA (~$73,000) | $67,500 |
| ETH | Ascending broadening lower trendline | ~$2,000 ($1,976.65) | Below pattern |
| XRP | $1.40 mid-channel support | $1.00 lower channel boundary | Below channel |
Dip-buy map per @alicharts six-part thread, October 29, 2026
These are not guaranteed reversal points. Martinez frames each as a zone to reassess — levels where the risk/reward shifts sufficiently to consider positioning, not automatic buy signals. The 200-day SMA at $73,000 for Bitcoin, $1,976.65 for Ethereum, and $1.00 for XRP are the analyst’s stated coordinates. Whether price reaches them, holds them, or passes through them is the open question.
At $77,568, Bitcoin is approximately 6.2% above the 200-day SMA at $73,000. That gap can close quickly in a risk-off environment driven by security fears — or stabilize if the Binance situation is resolved without further escalation. The 50-day SMA near $82,500 is now the first level that must be reclaimed before any bullish structure can be re-established.
Source: x.comFrequently Asked Questions
What does the 50-day SMA rejection mean for Bitcoin’s price outlook?
Is the $73,000 level a guaranteed buy signal for Bitcoin?
Why did Bitcoin and Ethereum sell off on October 29, 2026?
What level does XRP need to reclaim to repair its chart structure?
Source: Ali Charts · Published by CoinsProbe Markets Desk
The opinions and market insights shared on CoinsProbe represent the views of individual authors based on prevailing market conditions at the time of publication. Cryptocurrency investments carry significant risk and volatility. Readers are encouraged to conduct their own research and seek professional financial advice before making investment decisions. CoinsProbe and its contributors do not accept responsibility for financial losses or decisions made based on published content.
CoinsProbe may publish sponsored articles, affiliate links, or promotional collaborations. All sponsored material is clearly labeled to maintain transparency with our audience. Our editorial decisions remain fully independent, and advertising partnerships do not influence reviews, rankings, or published opinions.
Since 2023, CoinsProbe has delivered reliable insights on cryptocurrency, blockchain, and digital assets. Our content is created by experienced researchers and analysts who follow strict editorial standards focused on accuracy, transparency, and credibility. Every article is carefully reviewed and verified using trusted sources and current market data. We provide unbiased analysis and timely updates covering everything from emerging crypto projects to major industry developments.