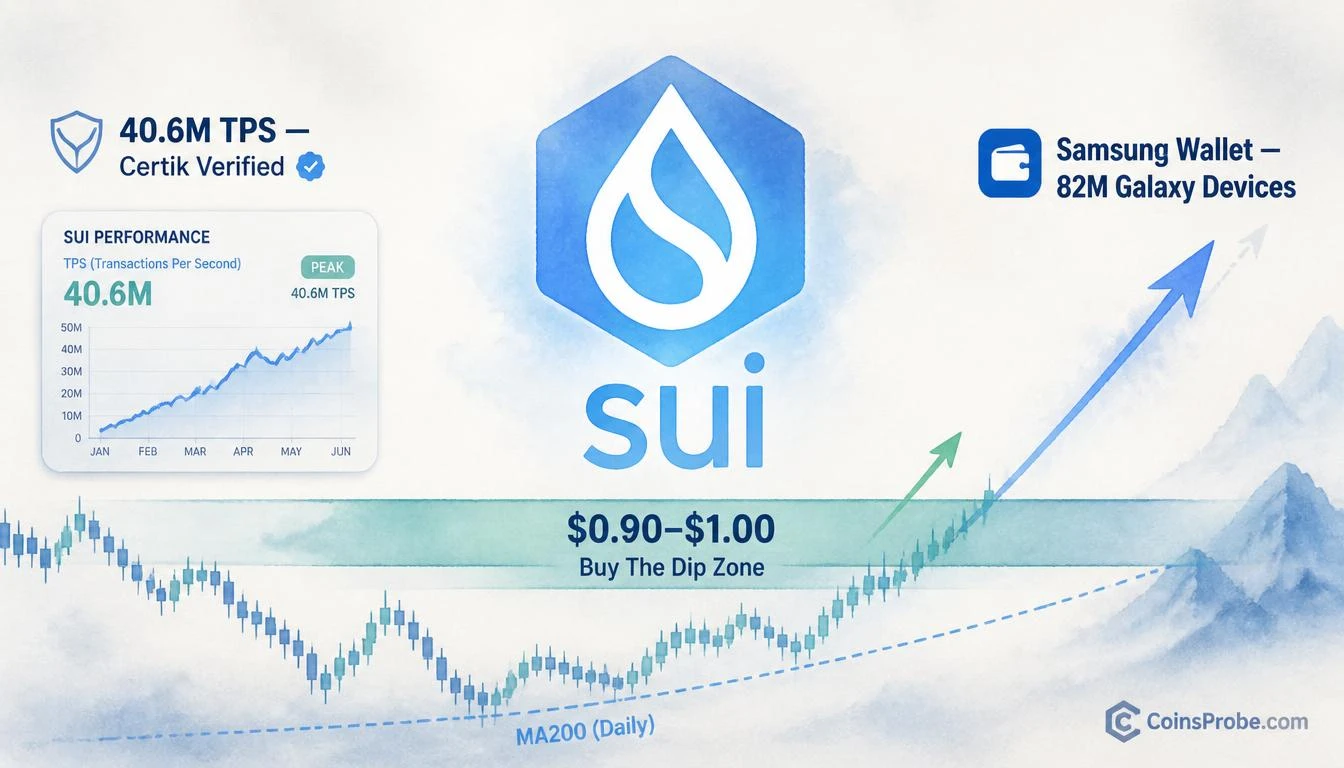

- SUI is trading at $0.9113 — down 23.18% over 30 days — and has entered the $0.90–$1.00 'Buy The Dip' zone flagged by @CryptoBullet1
- Analyst @CryptoBullet1 calls for gradual scaling in; zone first identified October 13, 2026 — 14 days before current price touch
- Sui holds a Certik-verified 40.6M TPS record and Samsung Wallet integration targeting 82M Galaxy devices
- Watch $0.90 — a daily close below invalidates the accumulation zone; Core PCE data releases October 28
SUI is trading at $0.9113 — down 0.51% in the past 24 hours, 8.40% over the past week, and 23.18% over the past 30 days — and has now landed precisely inside the accumulation zone that analyst @CryptoBullet1 has been publicly tracking since mid-October. With a market cap of $3.75 billion, this is not a random pullback: the price has entered a defined structural support band that the analyst flagged two weeks before the current touch.
On October 27, 2026, @CryptoBullet1 issued a direct call: “$SUI has reached the ‘Buy The Dip’ zone 👌 — It’s time to gradually scale in.” This was not an impulsive update. A prior post from October 13, 2026 had already identified the same $0.90–$1.00 band as the target accumulation zone after SUI dipped below $1 twice within a seven-day window. The analyst’s framework has now been triggered.
The $0.90–$1.00 Zone — What Makes This Level Structural
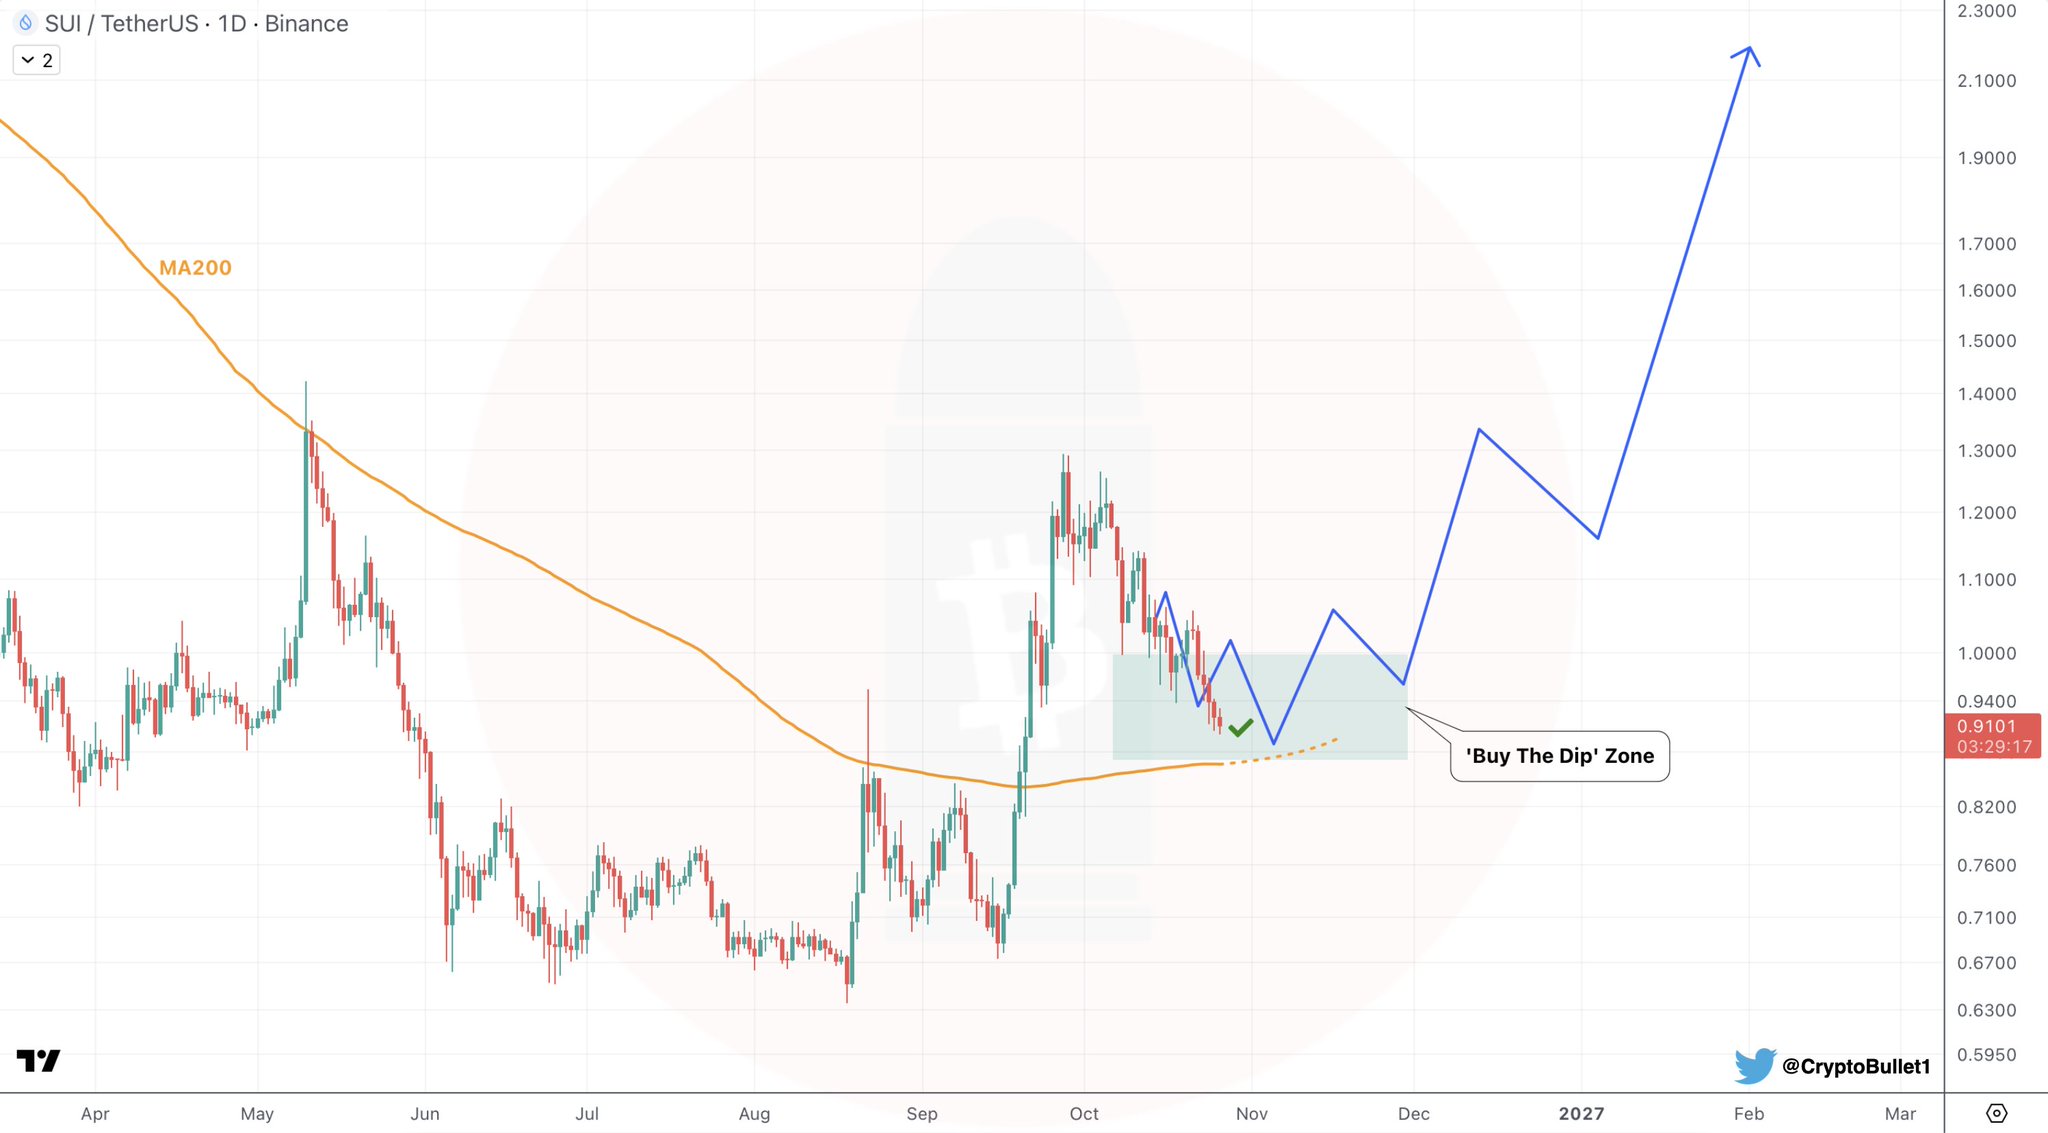
The daily chart shared by @CryptoBullet1 on Binance shows SUI’s current price at $0.9101 sitting at the lower boundary of a shaded horizontal support region — labeled the ‘Buy The Dip’ Zone. The MA200 (200-day moving average) runs as a dashed line directly beneath this zone, reinforcing it as a historically significant technical anchor. The projected path annotated on the chart is a zigzag recovery bouncing within the zone before trending sharply higher — but the analyst is explicit: this is a gradual scaling process, not a single-entry all-in call.
The pattern status is still forming. The recovery trajectory is forward-looking. What has been confirmed is the price arrival: SUI is at the zone, not approaching it. That distinction matters. @CryptoBullet1 flagged this zone on October 13 when SUI was testing $1 for the second time in a week. Now, more than two weeks later, the market has delivered the setup the analyst was waiting for. The word “gradually” in his call is deliberate — it signals staged entry as the zone is defended, not a single-candle catalyst.
The Fundamental Case — TPS Record and Samsung Integration
The technical setup does not exist in isolation. @CryptoBullet1 cites two specific fundamental drivers that form the bull case for SUI at this level. First: a 40.6 million TPS record certified by Certik — a throughput benchmark that positions Sui as one of the highest-performance Layer 1 networks by verified transaction speed. Second: Samsung Wallet is integrating Sui for USDC payments across 82 million Galaxy devices — a distribution milestone that would expose Sui’s network to one of the largest consumer hardware ecosystems in the world.
These are not speculative catalysts. The TPS figure is third-party verified. The Samsung integration is a named corporate deployment. At $0.91, with $3.75 billion in market cap, both fundamentals represent unpriced upside relative to where SUI was trading three months ago — particularly the Samsung channel, which has yet to generate measurable on-chain volume at scale.
On-Chain Data — Current Network State
DeFiLlama data shows Sui’s current TVL at $468.80 million, with 24-hour DEX volume at $20.74 million and 7-day DEX volume at $155.46 million. The 24-hour fee generation stands at $80.8K, with 7-day fees at $662K. These figures reflect a network that is active but not at peak utilization — which is consistent with the 23% monthly price drawdown. A recovery in on-chain activity metrics would be the first confirmatory signal that the $0.90–$1.00 accumulation zone is holding with genuine demand rather than passive price support.
This aligns with earlier CoinsProbe coverage: SUI/BTC held the August 2024 low with the range high as the upside target, and a prior SuperTrend buy signal on SUI preceded a 77.53% rally. The current zone entry is a third data point in a consistent technical sequence.
Macro Context — What Comes Next Week
Macro risk is not absent. Data via SoSoValue shows Core PCE Price Index (MoM and YoY) and GDP (QoQ) releasing on October 28 — the session immediately following this call. A hotter-than-expected Core PCE print would pressure risk assets broadly, potentially extending SUI’s drawdown below the $0.90 floor of the analyst’s stated zone. ISM Manufacturing PMI follows on November 1, with CPI (MoM and YoY) on November 9. The next two weeks carry sequential macro inflection points that could either compress or catalyze the gradual scaling thesis.
Bullish Scenario
SUI defends the $0.90–$1.00 zone with rising DEX volume and fee generation, MA200 holds as dynamic support, and the Samsung Wallet integration begins generating measurable on-chain USDC flows. Price path per analyst’s annotated chart: zigzag recovery through the zone, then a sustained directional move higher. Prior coverage flagged $1.40 as the channel top target once SUI reclaims $1.
Bearish Scenario
A macro-driven flush on Core PCE data (October 28) pushes SUI below $0.90 — the floor of the defined ‘Buy The Dip’ zone. A daily close below $0.90 would invalidate the current zone thesis and shift the structure back to price discovery below the MA200. @CryptoBullet1’s call specifies gradual scaling precisely because this risk exists.
SUI has entered the exact zone @CryptoBullet1 identified 14 days before the current touch, supported by a Certik-verified 40.6M TPS record and a Samsung Wallet integration reaching 82 million Galaxy devices. The daily chart shows price at the lower boundary of the $0.90–$1.00 accumulation band with the MA200 immediately beneath it — the structure is intact, but the pattern is still forming. The analyst’s call is explicit: gradual scaling, not a single-entry bet. The most immediate risk to this framework is the October 28 Core PCE release. Watch $0.90 — a daily close below that level is the structural invalidation of this zone.
Source: x.comFrequently Asked Questions
What is the ‘Buy The Dip’ zone for SUI and how was it identified?
What does ‘gradually scale in’ mean in @CryptoBullet1’s call?
What on-chain metrics confirm or deny the SUI accumulation thesis?
How does the Samsung Wallet integration affect SUI’s fundamentals?
Source: Cryptobullet1 · Published by CoinsProbe Markets Desk
The opinions and market insights shared on CoinsProbe represent the views of individual authors based on prevailing market conditions at the time of publication. Cryptocurrency investments carry significant risk and volatility. Readers are encouraged to conduct their own research and seek professional financial advice before making investment decisions. CoinsProbe and its contributors do not accept responsibility for financial losses or decisions made based on published content.
CoinsProbe may publish sponsored articles, affiliate links, or promotional collaborations. All sponsored material is clearly labeled to maintain transparency with our audience. Our editorial decisions remain fully independent, and advertising partnerships do not influence reviews, rankings, or published opinions.
Since 2023, CoinsProbe has delivered reliable insights on cryptocurrency, blockchain, and digital assets. Our content is created by experienced researchers and analysts who follow strict editorial standards focused on accuracy, transparency, and credibility. Every article is carefully reviewed and verified using trusted sources and current market data. We provide unbiased analysis and timely updates covering everything from emerging crypto projects to major industry developments.