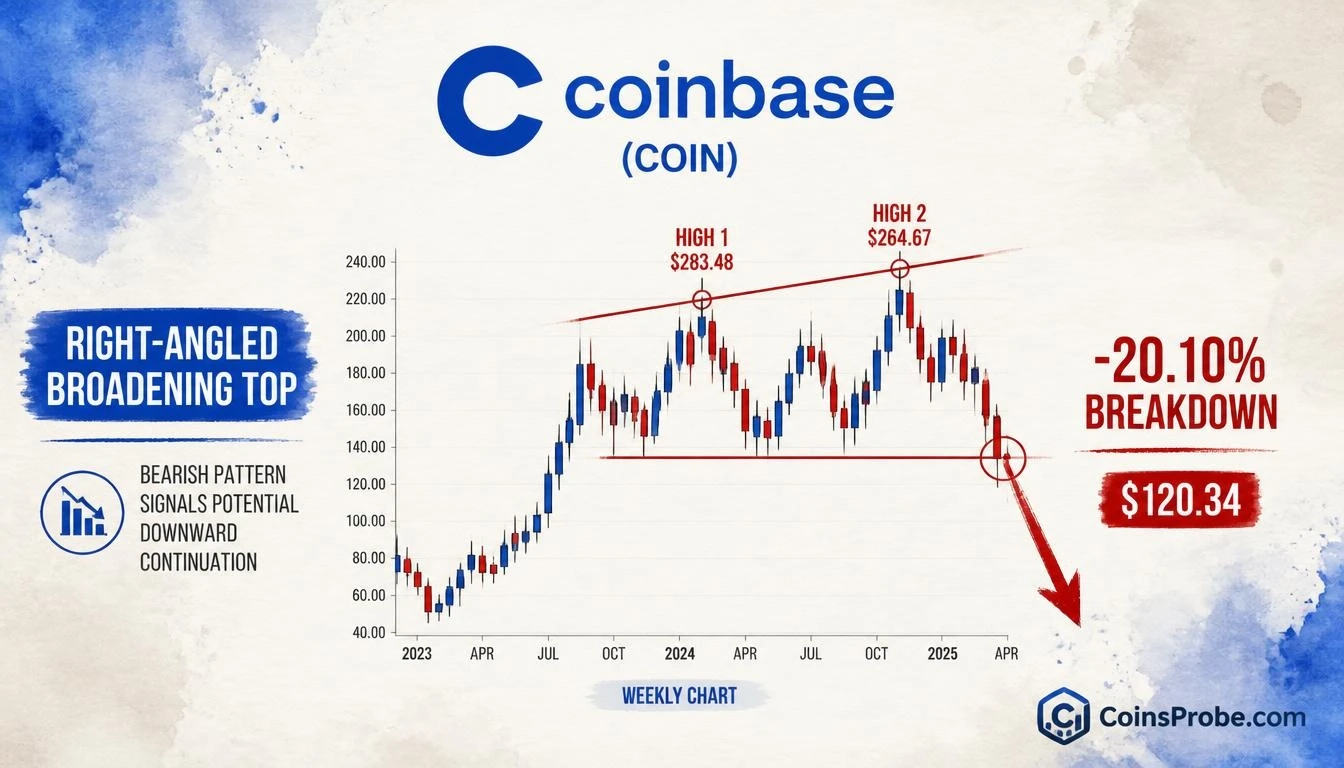
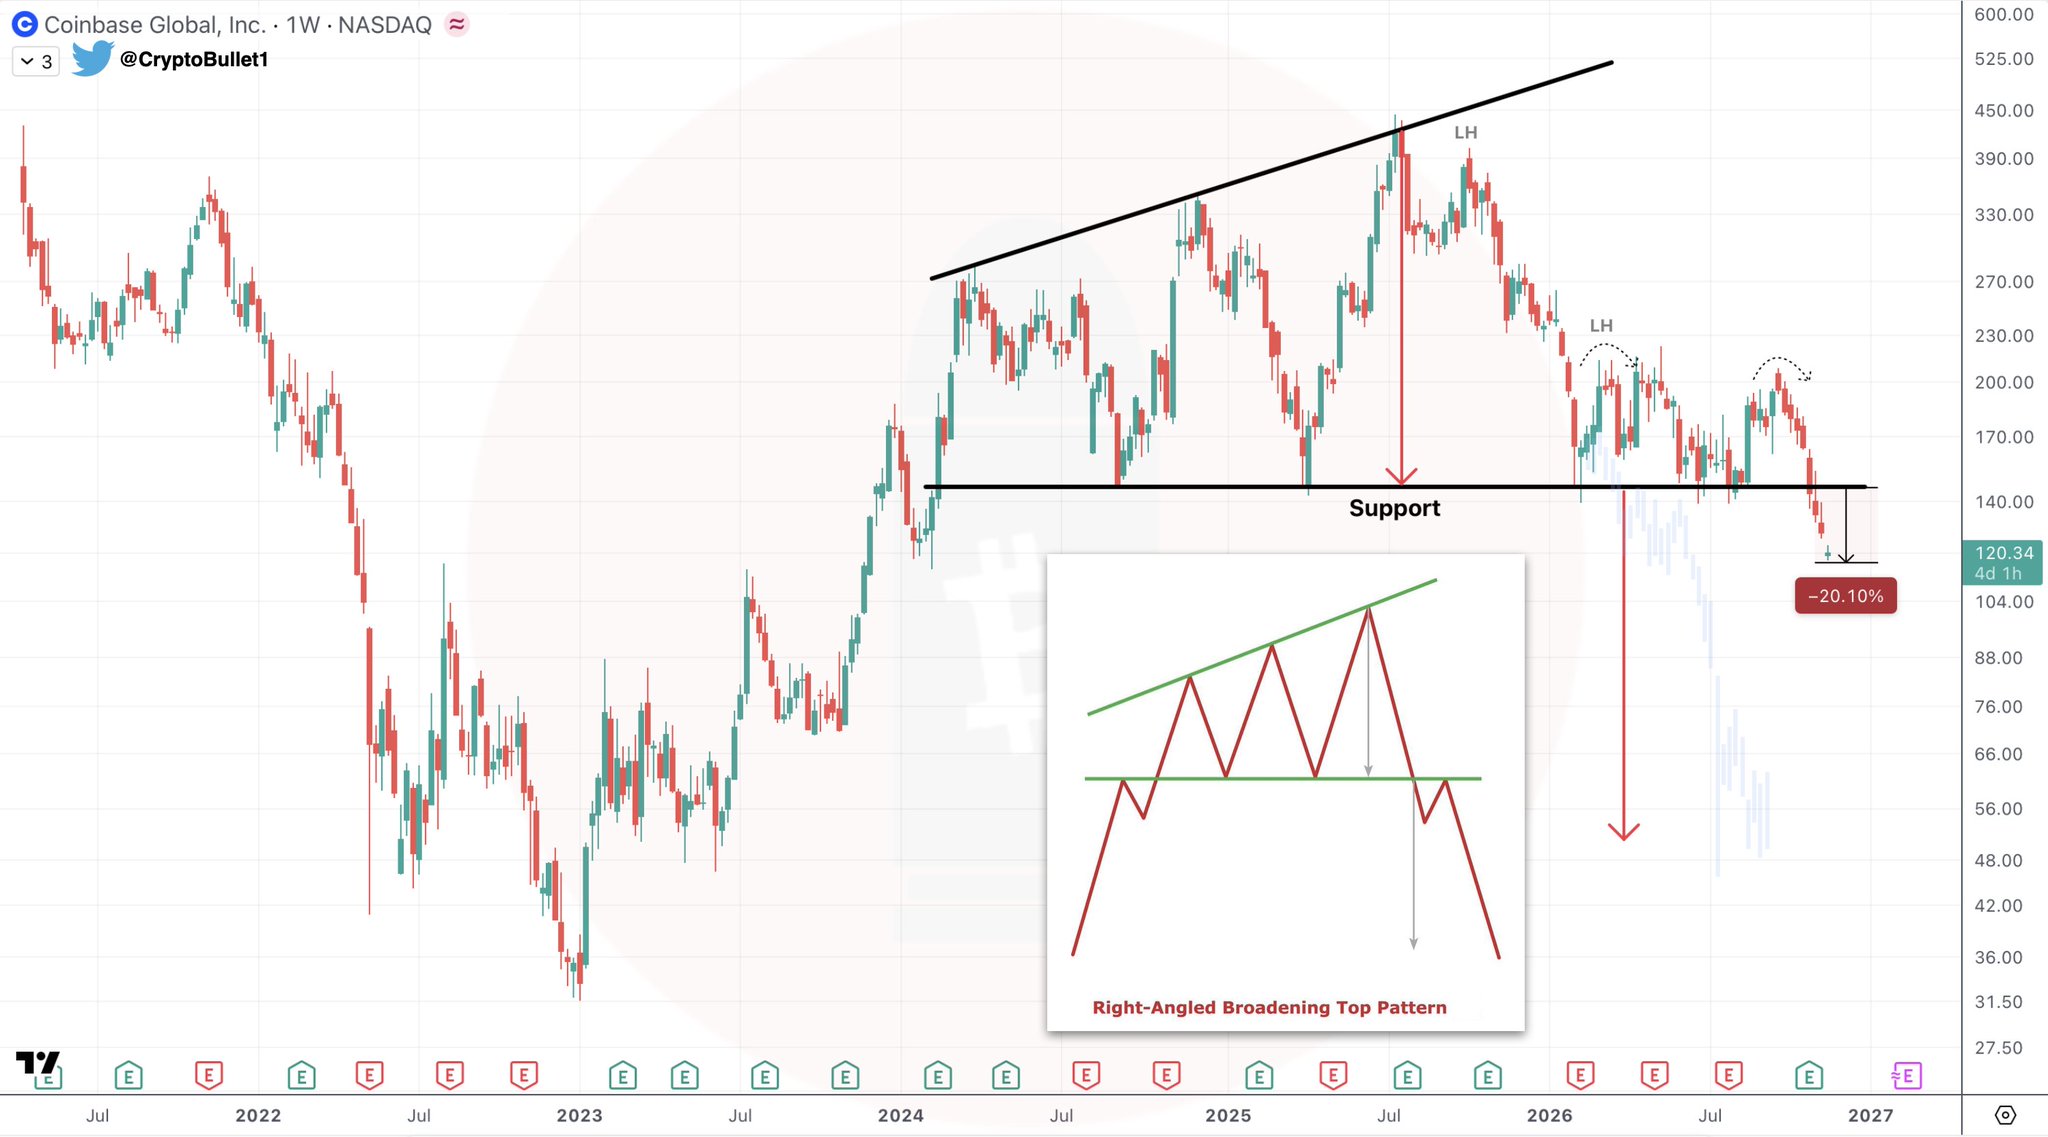
- COIN is trading near $120.34 on the weekly chart — down 20.10% from the Right-Angled Broadening Top breakdown zone
- Analyst @CryptoBullet1 called the Lower High in March 2026, then the support break, now confirms -20% realized decline
- Breakdown is confirmed: price is below both horizontal support and ascending upper trendline on the weekly NASDAQ chart
Coinbase Global (COIN) is trading at approximately $120 on the NASDAQ weekly chart — and the technical picture has turned decisively bearish. A Right-Angled Broadening Top pattern, flagged across multiple calls by one analyst, has now confirmed a full breakdown below horizontal support, with the stock already registering a 20% decline from its pattern highs.
The call comes from crypto analyst @CryptoBullet1, who has tracked this pattern across three sequential posts. As far back as March 12, 2026, the analyst wrote: “Just a Lower High imo. I still believe the Support will be broken.” A follow-up post confirmed: “Finally losing the Support.” The latest update — posted November 16, 2026 — delivers the verdict: “-20% so far.” The pattern has played out exactly as the analyst anticipated.
The Pattern — Right-Angled Broadening Top
A Right-Angled Broadening Top is a bearish reversal structure defined by two features: a flat horizontal support base and an ascending upper trendline that makes successively higher highs. The critical signal is what happens to the highs — each peak within the pattern prints a lower high (LH) relative to the prior swing, even as the upper bound continues rising. This divergence — expanding range with declining momentum at the top — signals distribution. When price finally breaks below the flat horizontal support, the pattern confirms. The breakdown is not the warning. The breakdown is the conclusion.
On COIN’s weekly NASDAQ chart, the analyst identified exactly this structure. The chart labels two successive Lower Highs (LH×2) beneath the ascending upper trendline, with price compressing against the flat support base before breaching it. The price label visible on the right axis reads $120.34, with the -20.10% label marking the current decline from the pattern’s reference level. Price is now confirmed below both the horizontal support and the ascending upper trendline — a double breakdown of the structure’s boundaries.
Three-Stage Analyst Thesis — Now at Stage Three
What makes this call structurally significant is the sequential discipline behind it. Stage one: the analyst identified the Lower High in March 2026, refusing to call it a continuation — instead flagging it as a bearish signal within the broadening top. Stage two: the support line broke. Stage three, now confirmed: -20% from the pattern highs, with the analyst’s reaction notably composed rather than triumphant. The “😌” emoji in the update communicates one thing — this was anticipated, not reactive. For traders who missed the initial call, this matters: the breakdown is not fresh news. It is the third data point in a consistent thesis.
The broader context for COIN is not isolated. Crypto equities have faced compounding pressure as Bitcoin whale distribution has weighed on the broader crypto market, with COIN’s stock price historically correlated to BTC sentiment cycles. When the underlying asset faces selling pressure, exchange revenue models — and their equity proxies — face proportional headwinds.
What the -20.10% Label Tells You
The -20.10% figure is not an arbitrary round number — it is the annotated decline visible on the weekly chart at the time of the analyst’s post, with the price label reading $120.34. This is not a projected move or a measured target. It is the confirmed, realized decline already embedded in COIN’s price action from the pattern’s breakdown zone. The analyst’s update is a progress report on an active, unfolding breakdown — not a new call. That distinction matters for anyone assessing whether this move has legs or is approaching exhaustion.
It is worth noting what the analyst does not provide: no explicit downside price target, no invalidation level, no support zone below current price. The post quantifies the damage so far — it does not project where the damage ends. Any specific downside targets beyond the current -20% would be inference beyond what the analyst has stated.
What Confirmation of Continuation Would Require
For the breakdown thesis to extend, COIN would need to sustain trade below the broken horizontal support on a weekly closing basis — a retest of broken support that fails to reclaim it would be the textbook continuation signal within this pattern. The analyst’s prior note specifically said the support will be broken — that condition is now met. What comes next is a function of whether any reclaim attempt materializes and whether it succeeds.
Macro context adds pressure. As Bitcoin tests critical long-term moving averages, crypto-correlated equities like COIN tend to amplify directional moves in both directions. A stabilization in BTC would not automatically rescue COIN’s technical structure, but a continued BTC decline would likely accelerate it.
The Right-Angled Broadening Top on COIN has confirmed its breakdown. The analyst called the Lower High, called the support break, and is now tracking -20.10% of realized downside at $120.34. Watch the broken support level as the first line of reclaim — until price closes a weekly candle back above it, the structure remains bearish.
Source: x.comFrequently Asked Questions
What is a Right-Angled Broadening Top pattern and why is it bearish for COIN?
How long has the analyst been tracking this COIN breakdown call?
What would invalidate the bearish breakdown structure on COIN?
Has the analyst provided a downside price target below the current -20% decline?
Source: Cryptobullet1 · Published by CoinsProbe Markets Desk
The opinions and market insights shared on CoinsProbe represent the views of individual authors based on prevailing market conditions at the time of publication. Cryptocurrency investments carry significant risk and volatility. Readers are encouraged to conduct their own research and seek professional financial advice before making investment decisions. CoinsProbe and its contributors do not accept responsibility for financial losses or decisions made based on published content.
CoinsProbe may publish sponsored articles, affiliate links, or promotional collaborations. All sponsored material is clearly labeled to maintain transparency with our audience. Our editorial decisions remain fully independent, and advertising partnerships do not influence reviews, rankings, or published opinions.
Since 2023, CoinsProbe has delivered reliable insights on cryptocurrency, blockchain, and digital assets. Our content is created by experienced researchers and analysts who follow strict editorial standards focused on accuracy, transparency, and credibility. Every article is carefully reviewed and verified using trusted sources and current market data. We provide unbiased analysis and timely updates covering everything from emerging crypto projects to major industry developments.