
- Bitcoin total demand improved by 27,170 BTC on Nov 16, 2026 — first day-over-day reduction from peak negative readings per CryptoQuant
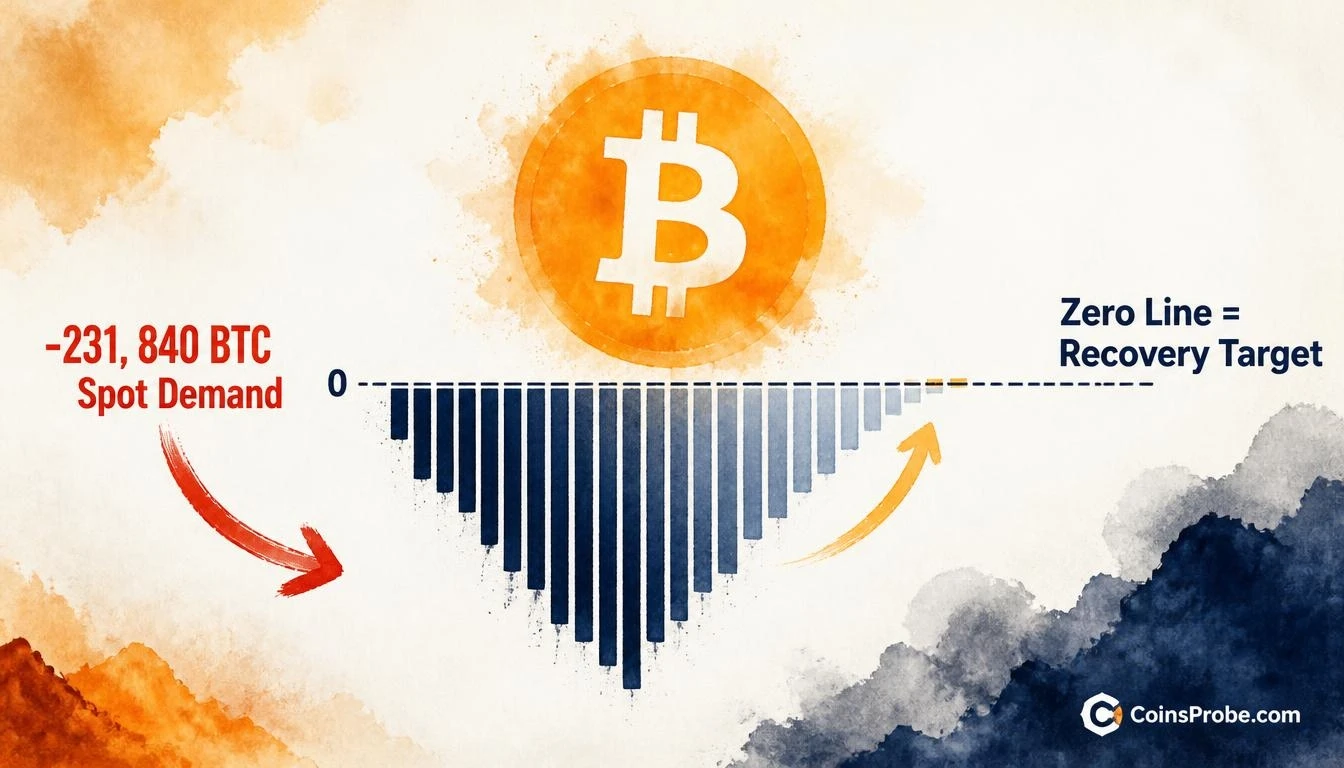
- Spot demand remains at −231,840 BTC and futures demand at −160,540 BTC — both still deeply negative
- CryptoQuant analyst CW_ states a full recovery requires total demand to cross zero — 'there is still a long way to go'
- BTC trading at $64,570 (−0.11% 24h) with $1.30T market cap at time of writing
Bitcoin is trading at approximately $64,570 — down 0.11% over the past 24 hours — with a market cap of roughly $1.30 trillion. Beneath the relatively stable price surface, a critical on-chain demand metric has just posted its first meaningful improvement in weeks, though analysts warn the recovery is far from complete.
An on-chain analyst at CryptoQuant, publishing under the handle CW_, flagged the development in a November 17, 2026 Quicktake note: “While this rebound in demand is a positive sign, the demand remains in negative territory, and a full recovery will require more time.” The report tracks CryptoQuant’s Bitcoin total demand metric — a composite reading that aggregates both spot and perpetual futures demand into a single rolling figure. The analyst’s conclusion is deliberate in its restraint: this is an improvement, not a reversal.
The Metric — What CryptoQuant’s Bitcoin Demand Reading Actually Measures
CryptoQuant’s Bitcoin demand indicator measures net buying pressure across spot and perpetual futures markets simultaneously, expressed as a rolling sum. When the figure is positive, more Bitcoin is being absorbed than sold or shorted on a net basis. When negative — as it has been — the market is in sustained net outflow and de-leveraging. The depth of the negative reading reflects cumulative selling pressure, not a single-day event. It is a structural signal, not a momentum oscillator.
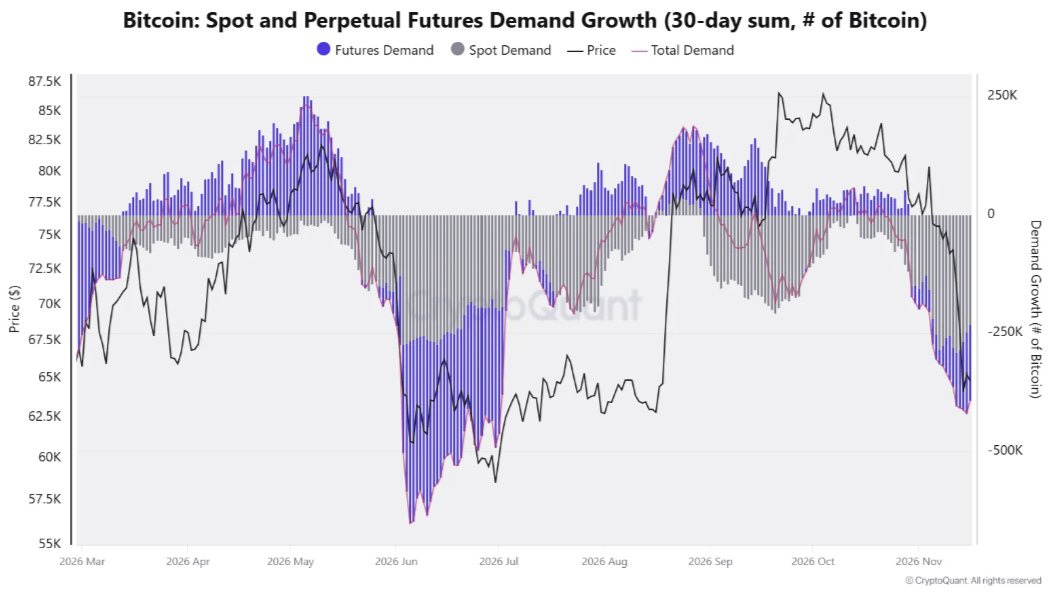
According to CryptoQuant, the metric broke down into three specific components on November 16, 2026:
| Demand Component | Previous Day | Latest Reading | Change |
|---|---|---|---|
| Spot Demand (negative value) | −247,730 BTC | −231,840 BTC | +15,890 BTC |
| Futures Demand (negative value) | −171,820 BTC | −160,540 BTC | +11,280 BTC |
| Total Demand (negative value) | (prior day peak) | (post-improvement) | +27,170 BTC |
Data via CryptoQuant
The combined improvement of 27,170 BTC in total demand represents the first day-over-day reduction in net outflow pressure since the metric reached its most negative extreme. Both legs — spot and derivatives — moved in the same direction simultaneously, which the analyst characterizes as a positive early signal.
Why the Recovery Is Real — And Why It Is Not Yet Enough
The CryptoQuant chart covering March through November 2026 shows the full anatomy of the demand collapse. Spot demand bars and futures demand bars both reached deep negative troughs mid-chart, with the total demand line (combining both) tracing its lowest readings during the same window. The price line, running in parallel, reflects that deterioration — sitting near its lowest visible range on the right side of the chart, in the low $60,000s per printed axis labels.
The partial recovery in the demand line is visible as a slight upward curl from the trough — but crucially, the line remains well below the zero threshold. This is the distinction the analyst is drawing. A less negative reading is not the same as positive demand. Net outflows have slowed, but they have not stopped. This matters because, as the CryptoQuant note states explicitly: “an upward trend will only emerge once total demand shifts into positive territory. There is still a long way to go.”
To put the remaining distance in context: total demand sits at approximately −231,840 BTC on the spot side and −160,540 BTC on the futures side. The combined negative figure still runs in the hundreds of thousands of BTC. A single day’s improvement of 27,170 BTC, while directionally meaningful, represents a fraction of the gap that must close before the demand metric crosses into positive territory. This context is what prevents the latest data point from being read as a trend change — it is a potential inflection, not a confirmed one. Readers tracking the broader selling dynamic can find additional context in this earlier analysis of Bitcoin whale selling activity over a two-week period.
The Structural Requirement for a Demand Recovery
CryptoQuant’s analyst is explicit about what a genuine demand recovery requires: total demand — the combined spot and futures reading — must move from negative to positive territory. That is the specific threshold, not a percentage improvement or a multi-day streak of less-negative readings. The zero line is the binary condition.
Until that threshold is crossed, the prevailing structural backdrop remains one of net demand destruction. Price stability or modest bounces within this environment are possible — markets can trade sideways or recover temporarily while underlying demand remains negative — but they do not constitute evidence that the structural picture has changed. The demand metric is a leading condition for sustained directional price movement, not a coincident indicator of daily price action.
This aligns with the broader on-chain picture. Earlier data tracking Bitcoin’s position relative to short-term holder cost basis showed bears maintaining structural control below key realized-price levels. The demand metric reading adds a demand-side layer to that same structural picture.
What the Data Says — And What It Doesn’t
The CryptoQuant data confirms one specific thing with precision: the magnitude of net outflow pressure decreased by 27,170 BTC on November 16, 2026 — with both spot demand improving by 15,890 BTC and futures demand improving by 11,280 BTC. That is a verifiable, quantified reduction in downward pressure.
What the data does not say is that Bitcoin demand has turned bullish, that selling has ended, or that the structural backdrop has changed. The analyst’s own language — “a full recovery will require more time” and “there is still a long way to go” — sets the appropriate register. The improvement is genuine. The recovery is not yet real.
Notably, the demand improvement is occurring against a backdrop of continued exchange inflow activity in altcoin markets. Data tracking altcoin netflows on Binance shows some AI and DeFi tokens experiencing outflows — a divergent signal worth monitoring as a potential leading indicator of capital rotation back into Bitcoin demand.
At $64,570, Bitcoin is trading 0.11% lower on the day. The demand metric has posted its first directional improvement in weeks. Whether that improvement compounds over the next several sessions — and whether the total demand line can close the gap to zero — is now the precise question the data will answer. Watch the CryptoQuant total demand reading: a sustained move toward and through zero is the structural confirmation the market needs.
Frequently Asked Questions
What does CryptoQuant’s Bitcoin demand metric measure?
What specific threshold must Bitcoin demand cross for a confirmed recovery?
Does the demand improvement mean Bitcoin’s price will recover soon?
Why are both spot and futures demand readings important together?
Source: CryptoQuant · Published by CoinsProbe Markets Desk
The opinions and market insights shared on CoinsProbe represent the views of individual authors based on prevailing market conditions at the time of publication. Cryptocurrency investments carry significant risk and volatility. Readers are encouraged to conduct their own research and seek professional financial advice before making investment decisions. CoinsProbe and its contributors do not accept responsibility for financial losses or decisions made based on published content.
CoinsProbe may publish sponsored articles, affiliate links, or promotional collaborations. All sponsored material is clearly labeled to maintain transparency with our audience. Our editorial decisions remain fully independent, and advertising partnerships do not influence reviews, rankings, or published opinions.
Since 2023, CoinsProbe has delivered reliable insights on cryptocurrency, blockchain, and digital assets. Our content is created by experienced researchers and analysts who follow strict editorial standards focused on accuracy, transparency, and credibility. Every article is carefully reviewed and verified using trusted sources and current market data. We provide unbiased analysis and timely updates covering everything from emerging crypto projects to major industry developments.