
- SUI trades at $0.9130 (+6.06% 24h, -26.69% 30d) after printing a TD Sequential 9 buy signal on the 3-day chart per @alicharts
- All three altcoins — SUI, AAVE ($127.55), and LINK ($11.11) — printed simultaneous 3-day TD Sequential exhaustion counts in one analyst thread
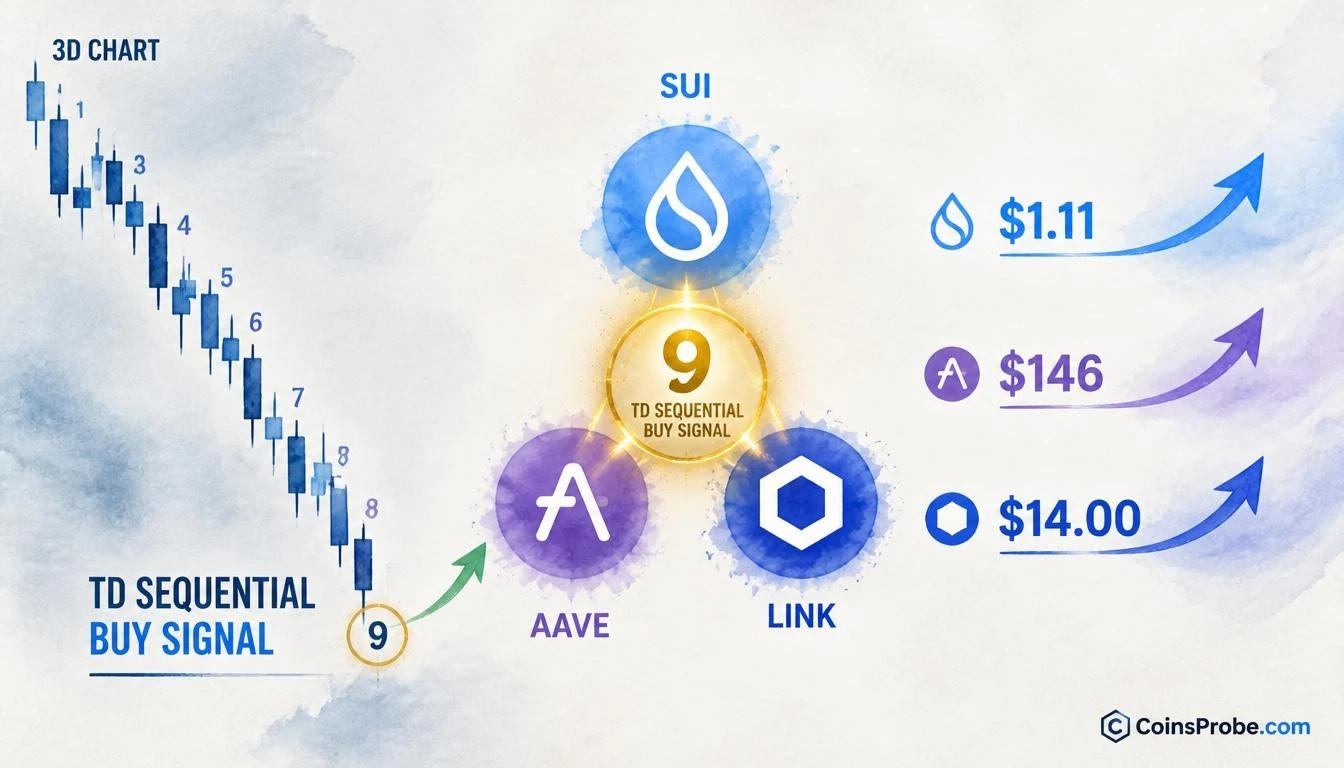
- SUI must close above $0.90 on the 3-day chart to open targets at $1.11 then $1.20; AAVE watches $146; LINK watches $12.50
Three altcoins are printing simultaneous exhaustion signals on their 3-day charts — and one analyst is watching all three at once. SUI is currently trading at $0.9130, up 6.06% in the past 24 hours, but down 26.69% over the past 30 days, with a market cap of approximately $3.78 billion. The TD Sequential buy signal — a momentum exhaustion indicator — has just completed its nine-count on SUI’s 3-day chart, flagging a potential trend reversal at a critical price zone.
An analyst identifying as @alicharts published a five-part thread on November 4, 2026, flagging identical TD Sequential buy signals across SUI, AAVE, and Chainlink on the same timeframe. “The TD Sequential has flashed a buy signal on the 3-day chart, suggesting a rebound could be near,” the analyst wrote of SUI. The same exhaustion structure has appeared across all three assets within the same analytical window — a convergence that is statistically uncommon and structurally significant. This follows a broader pattern: ETH, SOL, and ADA flashed identical 3-day TD Sequential buy signals in a prior cycle, underscoring how this indicator tends to cluster across altcoins during broad downtrend exhaustion phases.
What the TD Sequential Actually Measures
The TD Sequential is a momentum exhaustion indicator, not a price-level tool. It counts nine consecutive candlestick closes in the same direction — lower closes for a buy signal — to identify when a trending move has statistically overextended itself. The “9” print is not a prediction of reversal; it is a flag that the directional move has used up its momentum budget. The market then either reverses, consolidates, or continues with significantly reduced force. The signal is most reliable on higher timeframes. A 3-day chart signal carries more structural weight than a 4-hour or daily signal because each candle represents 72 hours of price discovery.
Signal 1 — SUI: $0.90 Is the Line
SUI has completed a TD Sequential 9 buy signal on its 3-day chart after a sustained descending sequence from above $1.40 toward the current $0.9130 area. The 3-day chart shows a clear downtrend, with the exhaustion count completing near the dashed $0.897 price marker. The signal is present — but price remains at the resistance threshold, not above it.
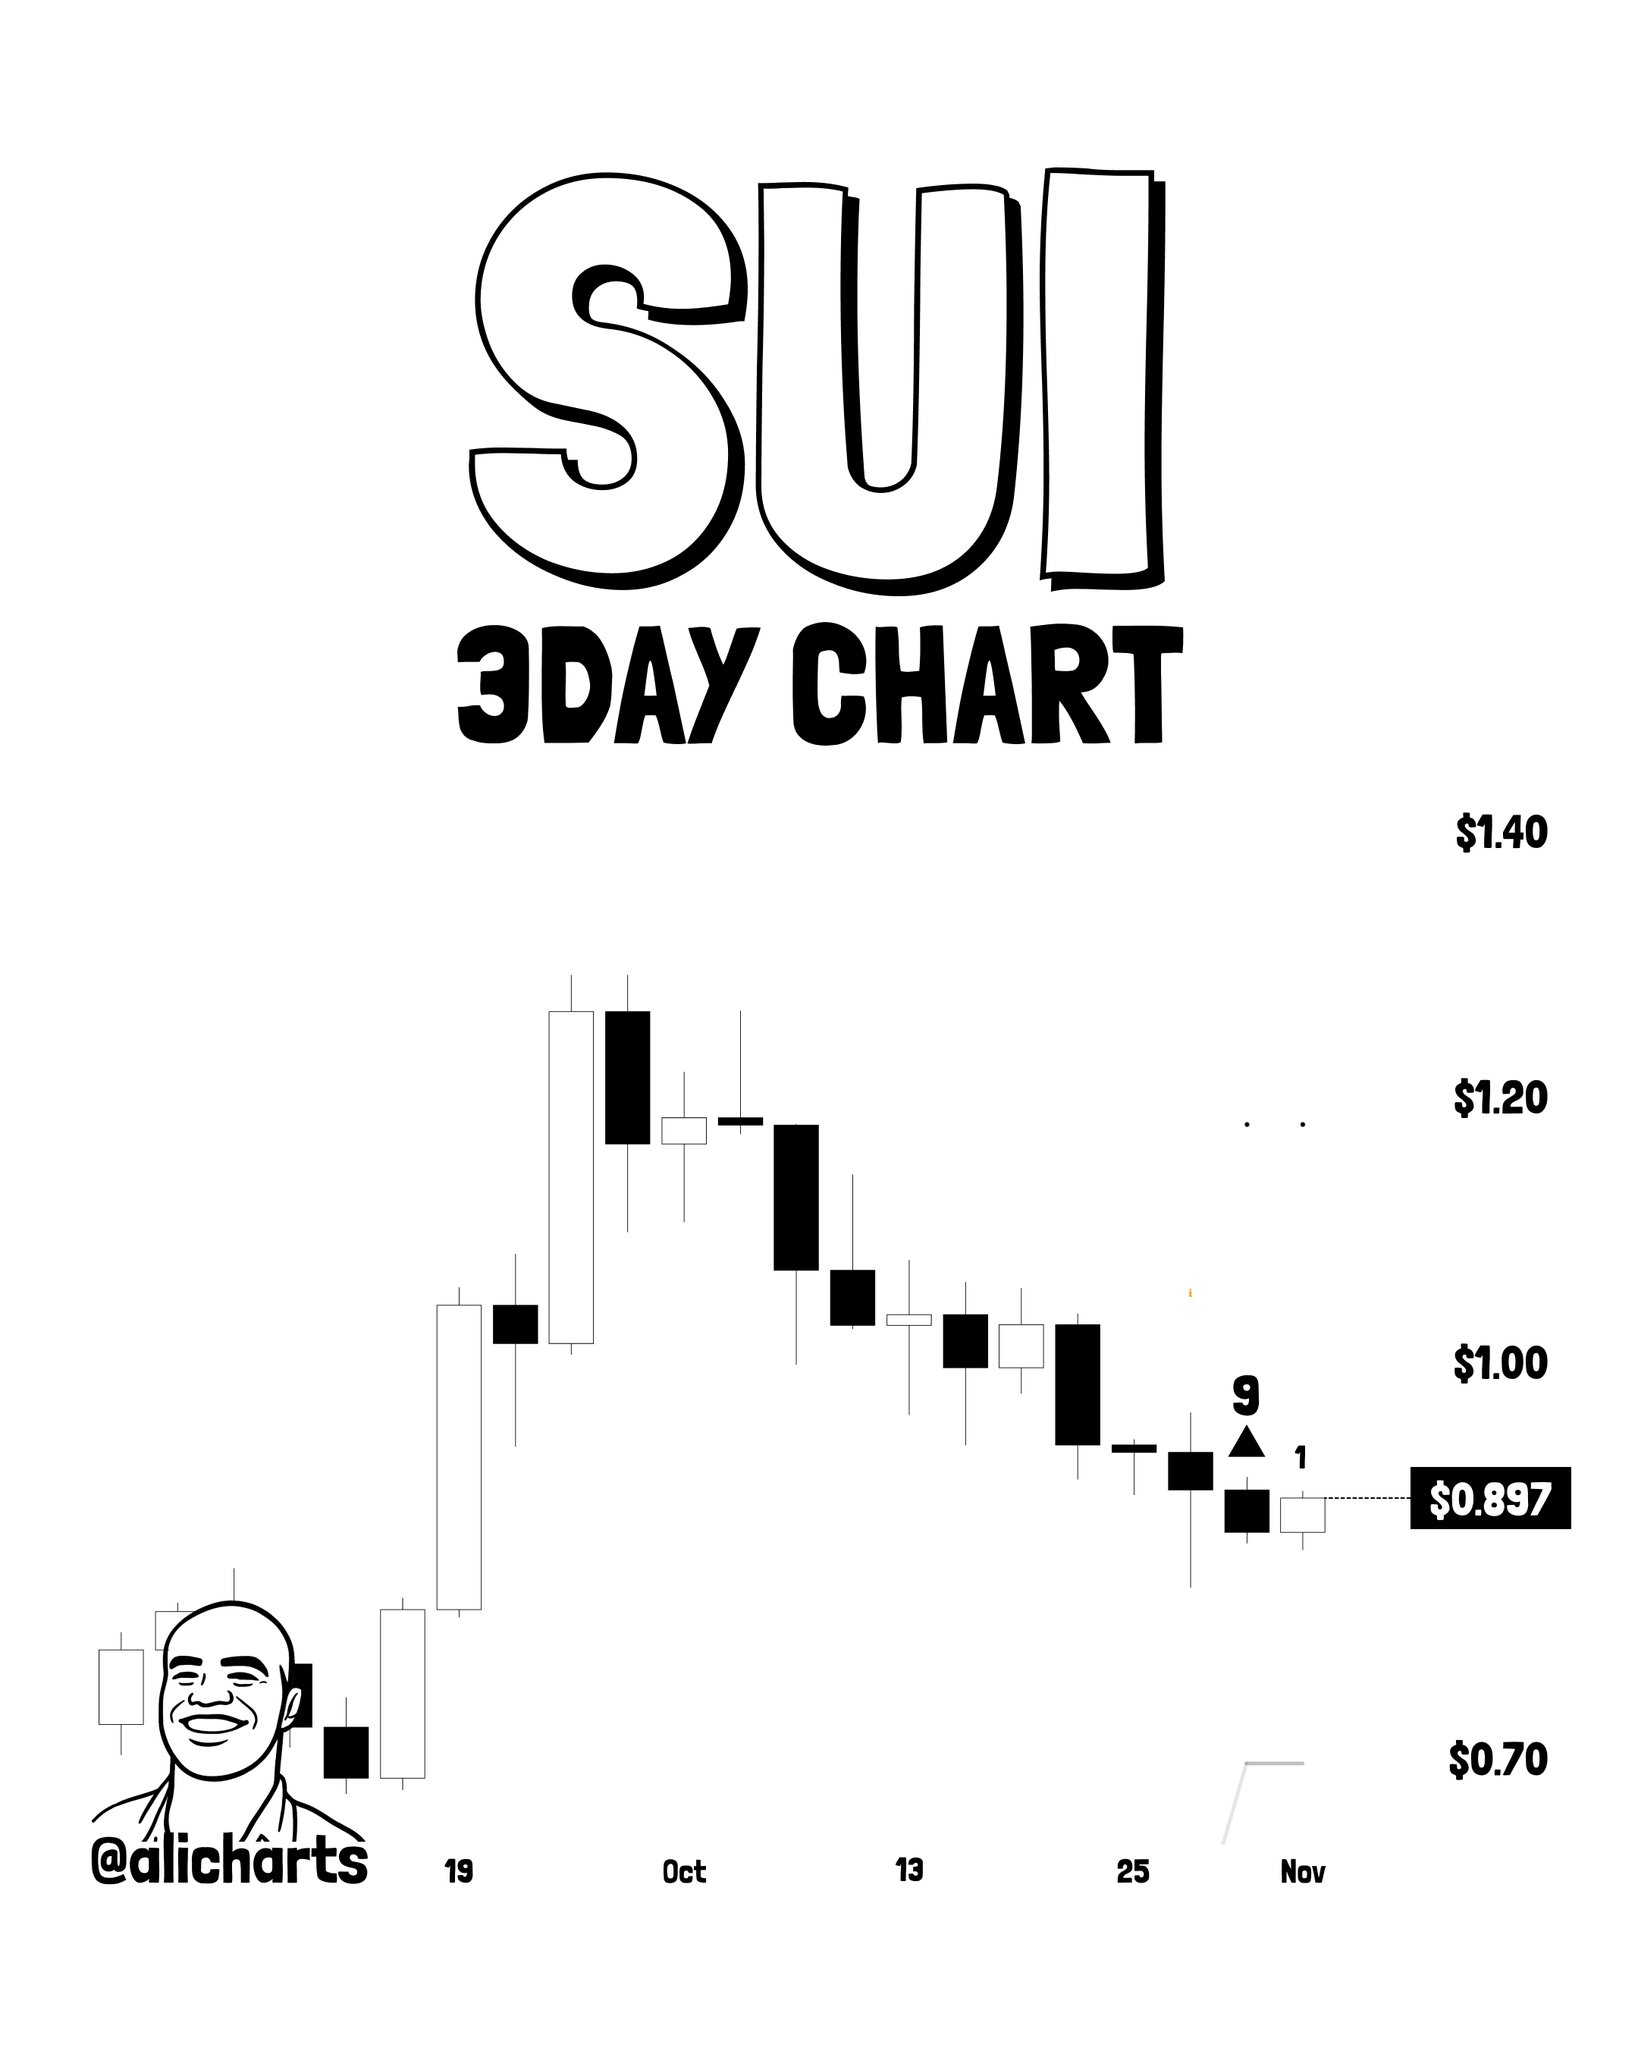
The analyst identifies $0.90 as the immediate resistance level to clear. A confirmed close above $0.90 on the 3-day chart would open a path toward $1.11 as the first target, followed by the setup resistance trendline near $1.20. At current pricing of $0.9130, SUI is marginally above the $0.897 chart marker but has not yet produced a confirmed 3-day close above $0.90. The pattern is still forming — no breakout has been confirmed on this chart.
Signal 2 — AAVE: Below Support, But Exhaustion Flashing
AAVE’s setup carries a more complex structure. Two TD Sequential “9” signals appear on the 3-day chart: one bearish count (marked with a downward arrow at a prior high) and a fresh bullish count (upward arrow at the current low near $127.55). The chart also shows a horizontal rectangular box drawn across the chart — price has broken below the lower boundary of that structure, confirming a breakdown below support.
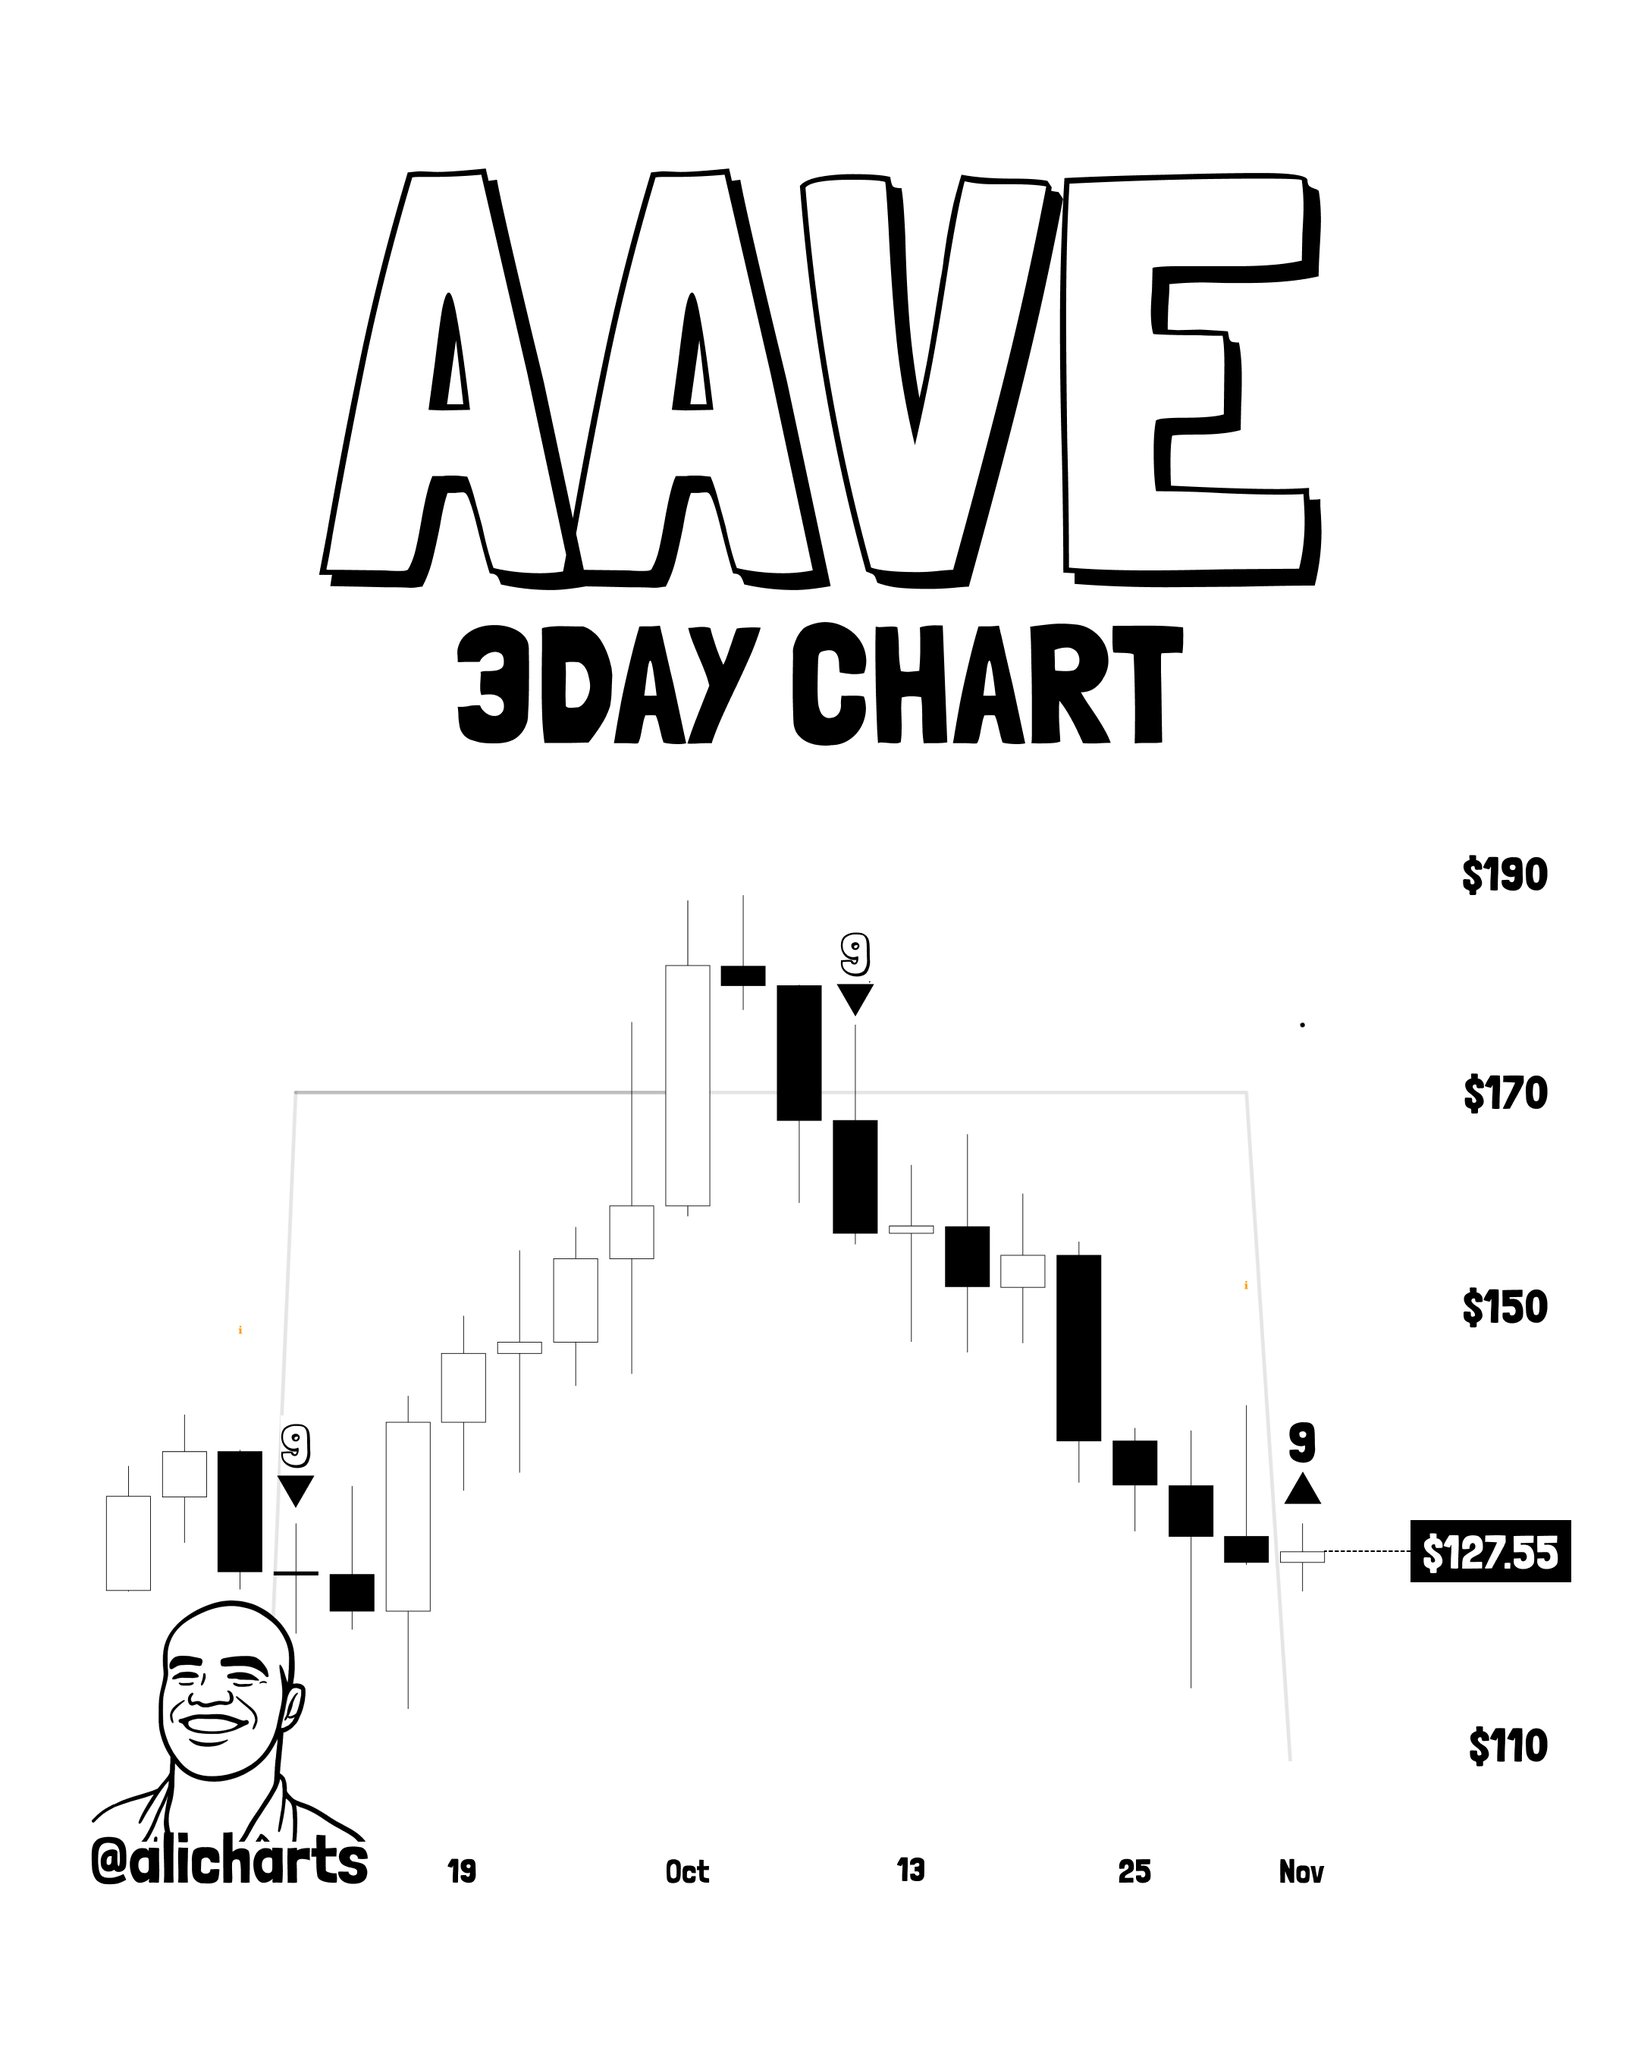
This creates a nuanced read: price is in breakdown territory (below the drawn box), but the TD Sequential is simultaneously flagging selling exhaustion. The analyst is watching for buying pressure to materialize, with an initial rebound target of $146. A move through $146 would open the path toward the next level. The breakdown context means the signal requires confirmation through price action — not just the count completion — before it can be acted on with conviction.
Signal 3 — LINK: Exhaustion at $11.11
Chainlink completes the trio. The 3-day LINK chart shows a prior TD Sequential sell signal (9-count with downward arrow) that marked an earlier high, followed by a prolonged bearish sequence. At the current low near $11.11, a fresh TD Sequential buy signal has printed — count “9” with an upward triangle, followed by candle “1” beginning the new sequence.
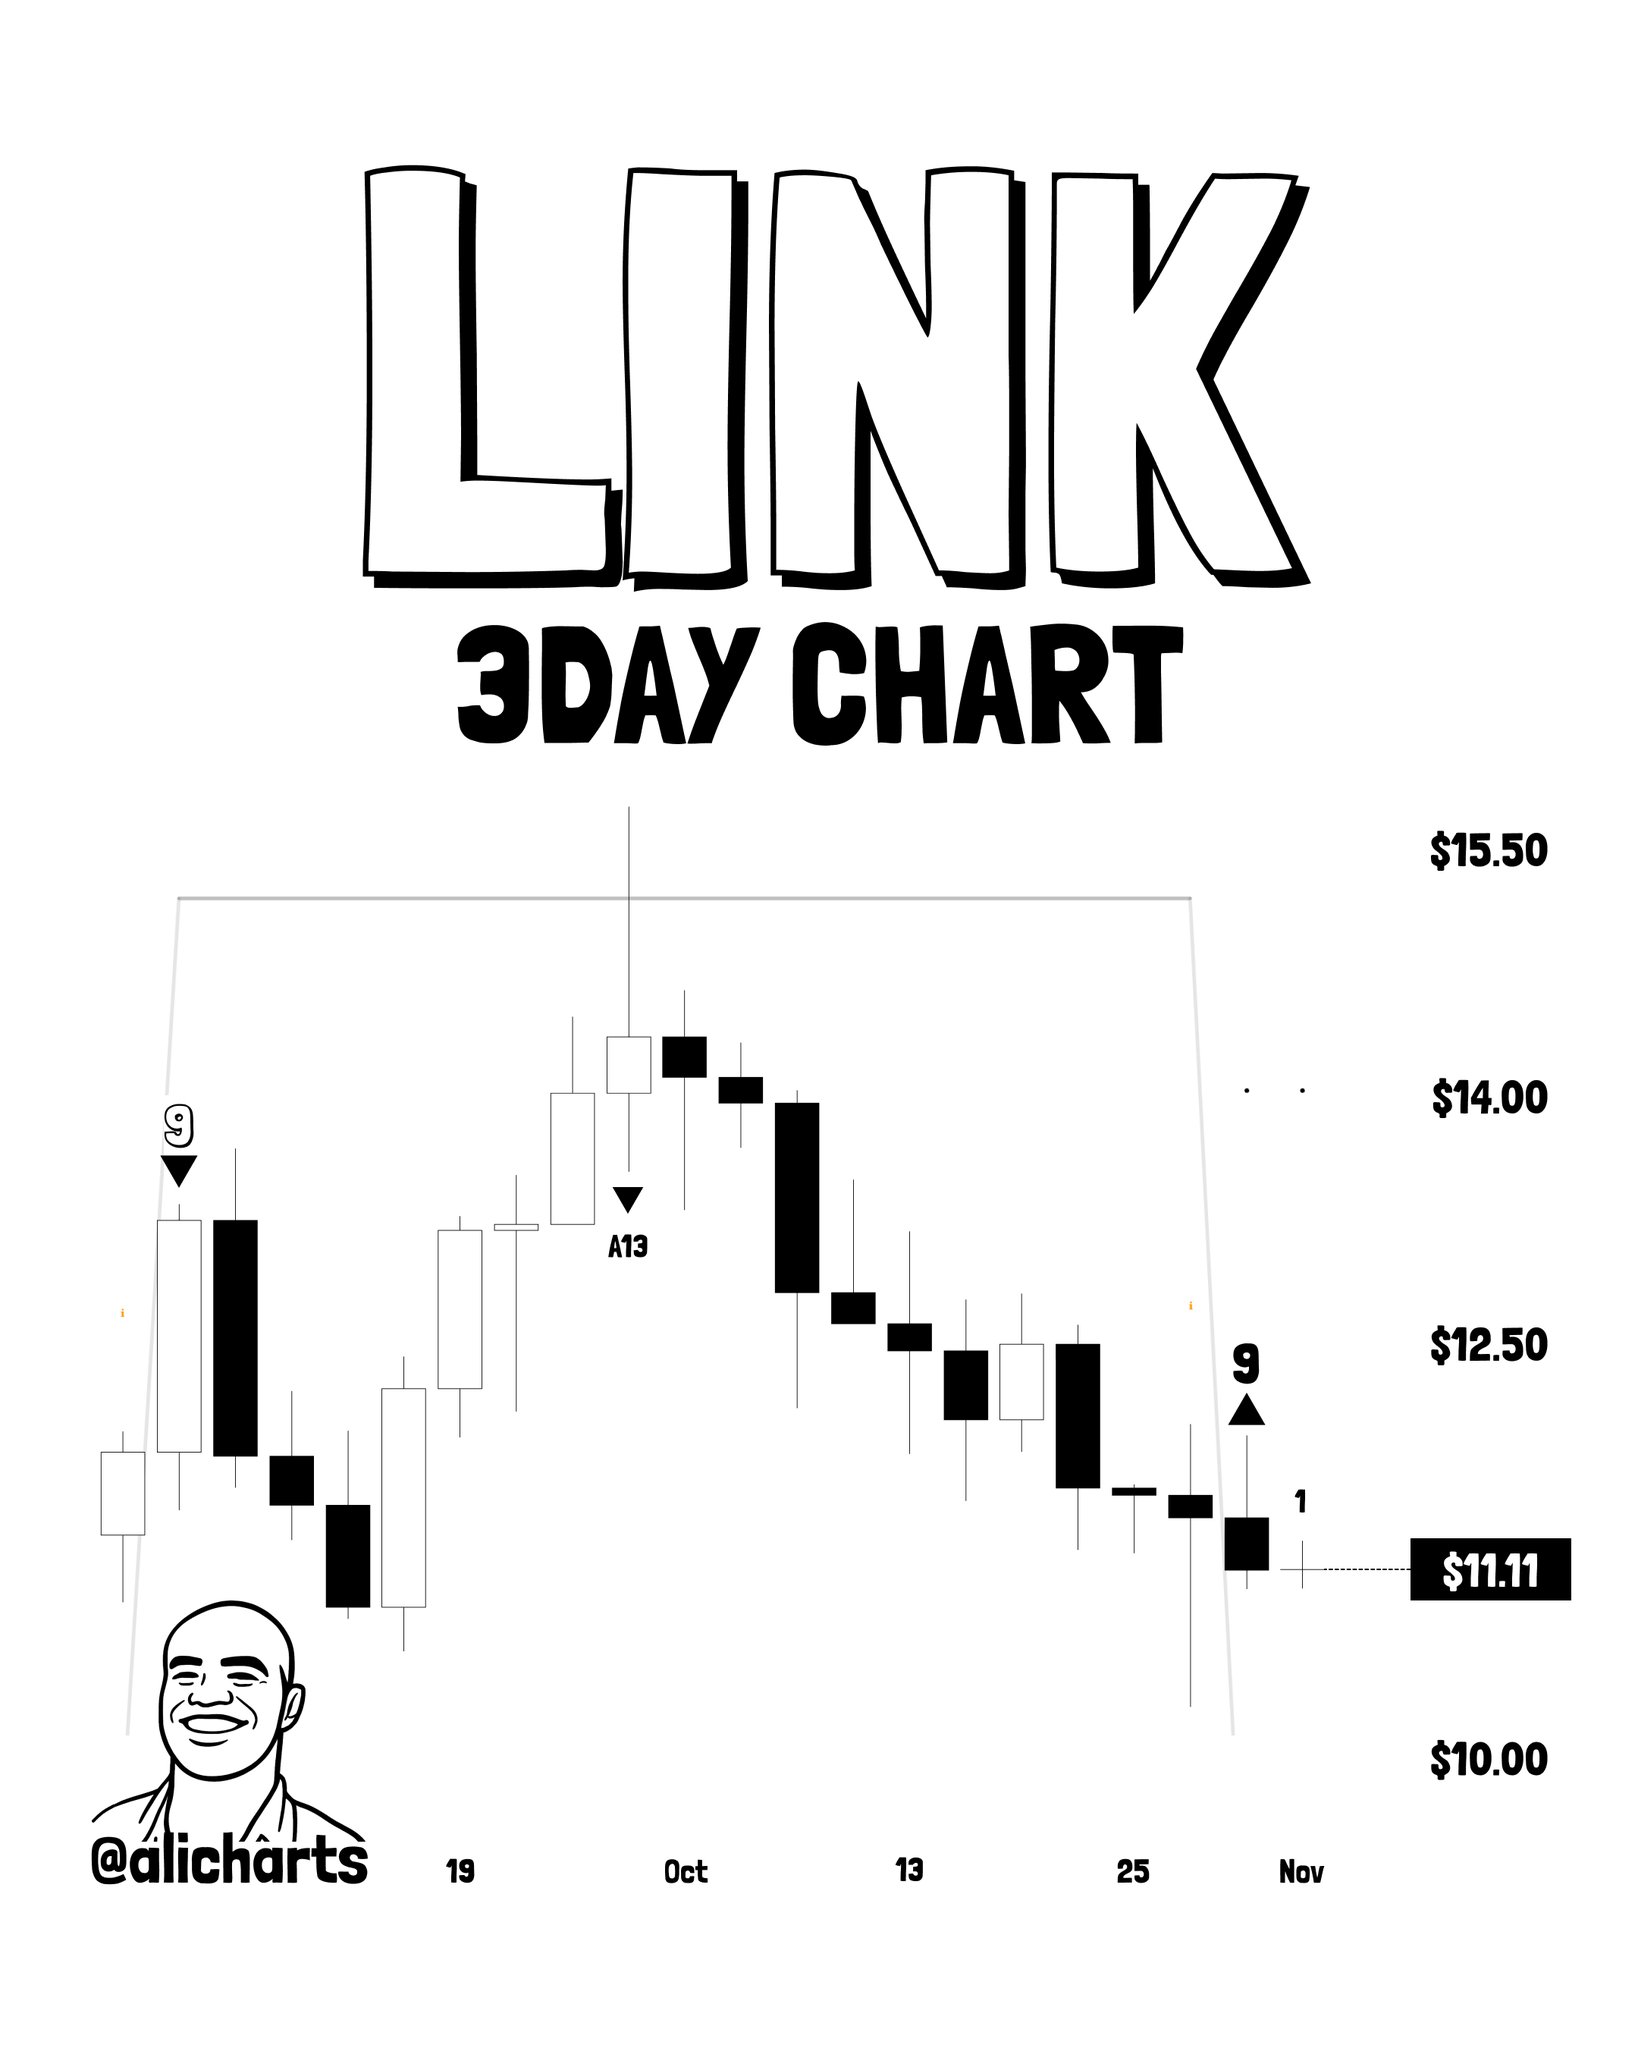
Price sits at the $11.11 dashed level, well below the $12.50 axis marker and significantly beneath prior resistance near $14.00. The pattern is still forming — count “1” has just appeared, meaning the reversal structure is in its earliest phase. No upside breakout has been confirmed. The analyst’s framework on LINK mirrors SUI and AAVE: exhaustion is present, but price must follow through.
Why Three Simultaneous Signals Matter
Isolated TD Sequential signals occur regularly across individual assets. Three assets printing the same 3-day exhaustion count at the same time — during a period of broad altcoin weakness, with SUI down 26.69% over 30 days — is a different category of observation. It suggests the selling pressure across mid-cap altcoins has reached a collective exhaustion point rather than a single-asset technical event. The TOTAL2 wave structure context matters here: if the broader altcoin market is approaching a macro inflection, these simultaneous signals would arrive at the structurally correct moment.
That said, simultaneous signals are not simultaneous confirmations. Each asset requires its own price action to validate the exhaustion read. The signal says the downtrend has counted out — it does not say when the reversal begins, or how large it will be. Stablecoin liquidity conditions will also determine whether the buying pressure needed to validate these signals is available in the market.
Levels That Define Each Setup
| Asset | Current Price | Key Resistance | Target 1 | Target 2 |
|---|---|---|---|---|
| SUI | $0.9130 | $0.90 (3-day close) | $1.11 | $1.20 trendline |
| AAVE | $127.55 | Box lower boundary | $146 | Not specified |
| LINK | $11.11 | $12.50 | $14.00 zone | Not specified |
Levels per @alicharts thread, November 4, 2026
Three altcoins, one timeframe, one indicator, three simultaneous exhaustion prints. The TD Sequential has flagged that the sellers on SUI, AAVE, and LINK have counted out on the 3-day chart — but the burden of proof now falls on the buyers. For SUI, that proof arrives at a confirmed 3-day close above $0.90. For AAVE, it requires buying pressure to absorb the breakdown and push price back toward $146. For LINK, it means holding $11.11 and beginning the first meaningful recovery candle above $12.50. Watch $0.90 on SUI — that is the first domino.
Source: x.comFrequently Asked Questions
What does a TD Sequential 9 buy signal on the 3-day chart mean for SUI, AAVE, and LINK?
What price must SUI close above to validate the TD Sequential buy signal?
Why is AAVE’s TD Sequential signal more complex than SUI’s or LINK’s?
Is a TD Sequential buy signal the same as a confirmed bullish reversal?
Source: Ali Charts · Published by CoinsProbe Markets Desk
The opinions and market insights shared on CoinsProbe represent the views of individual authors based on prevailing market conditions at the time of publication. Cryptocurrency investments carry significant risk and volatility. Readers are encouraged to conduct their own research and seek professional financial advice before making investment decisions. CoinsProbe and its contributors do not accept responsibility for financial losses or decisions made based on published content.
CoinsProbe may publish sponsored articles, affiliate links, or promotional collaborations. All sponsored material is clearly labeled to maintain transparency with our audience. Our editorial decisions remain fully independent, and advertising partnerships do not influence reviews, rankings, or published opinions.
Since 2023, CoinsProbe has delivered reliable insights on cryptocurrency, blockchain, and digital assets. Our content is created by experienced researchers and analysts who follow strict editorial standards focused on accuracy, transparency, and credibility. Every article is carefully reviewed and verified using trusted sources and current market data. We provide unbiased analysis and timely updates covering everything from emerging crypto projects to major industry developments.