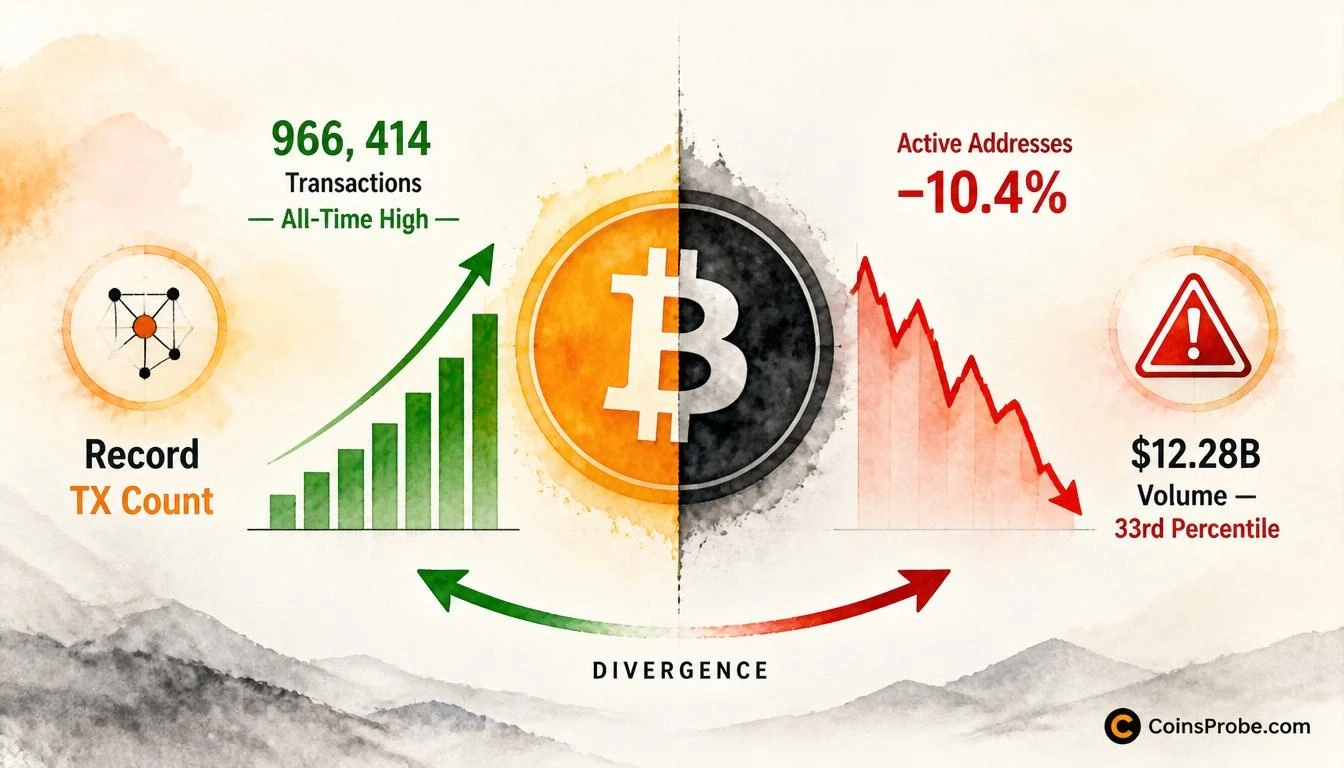

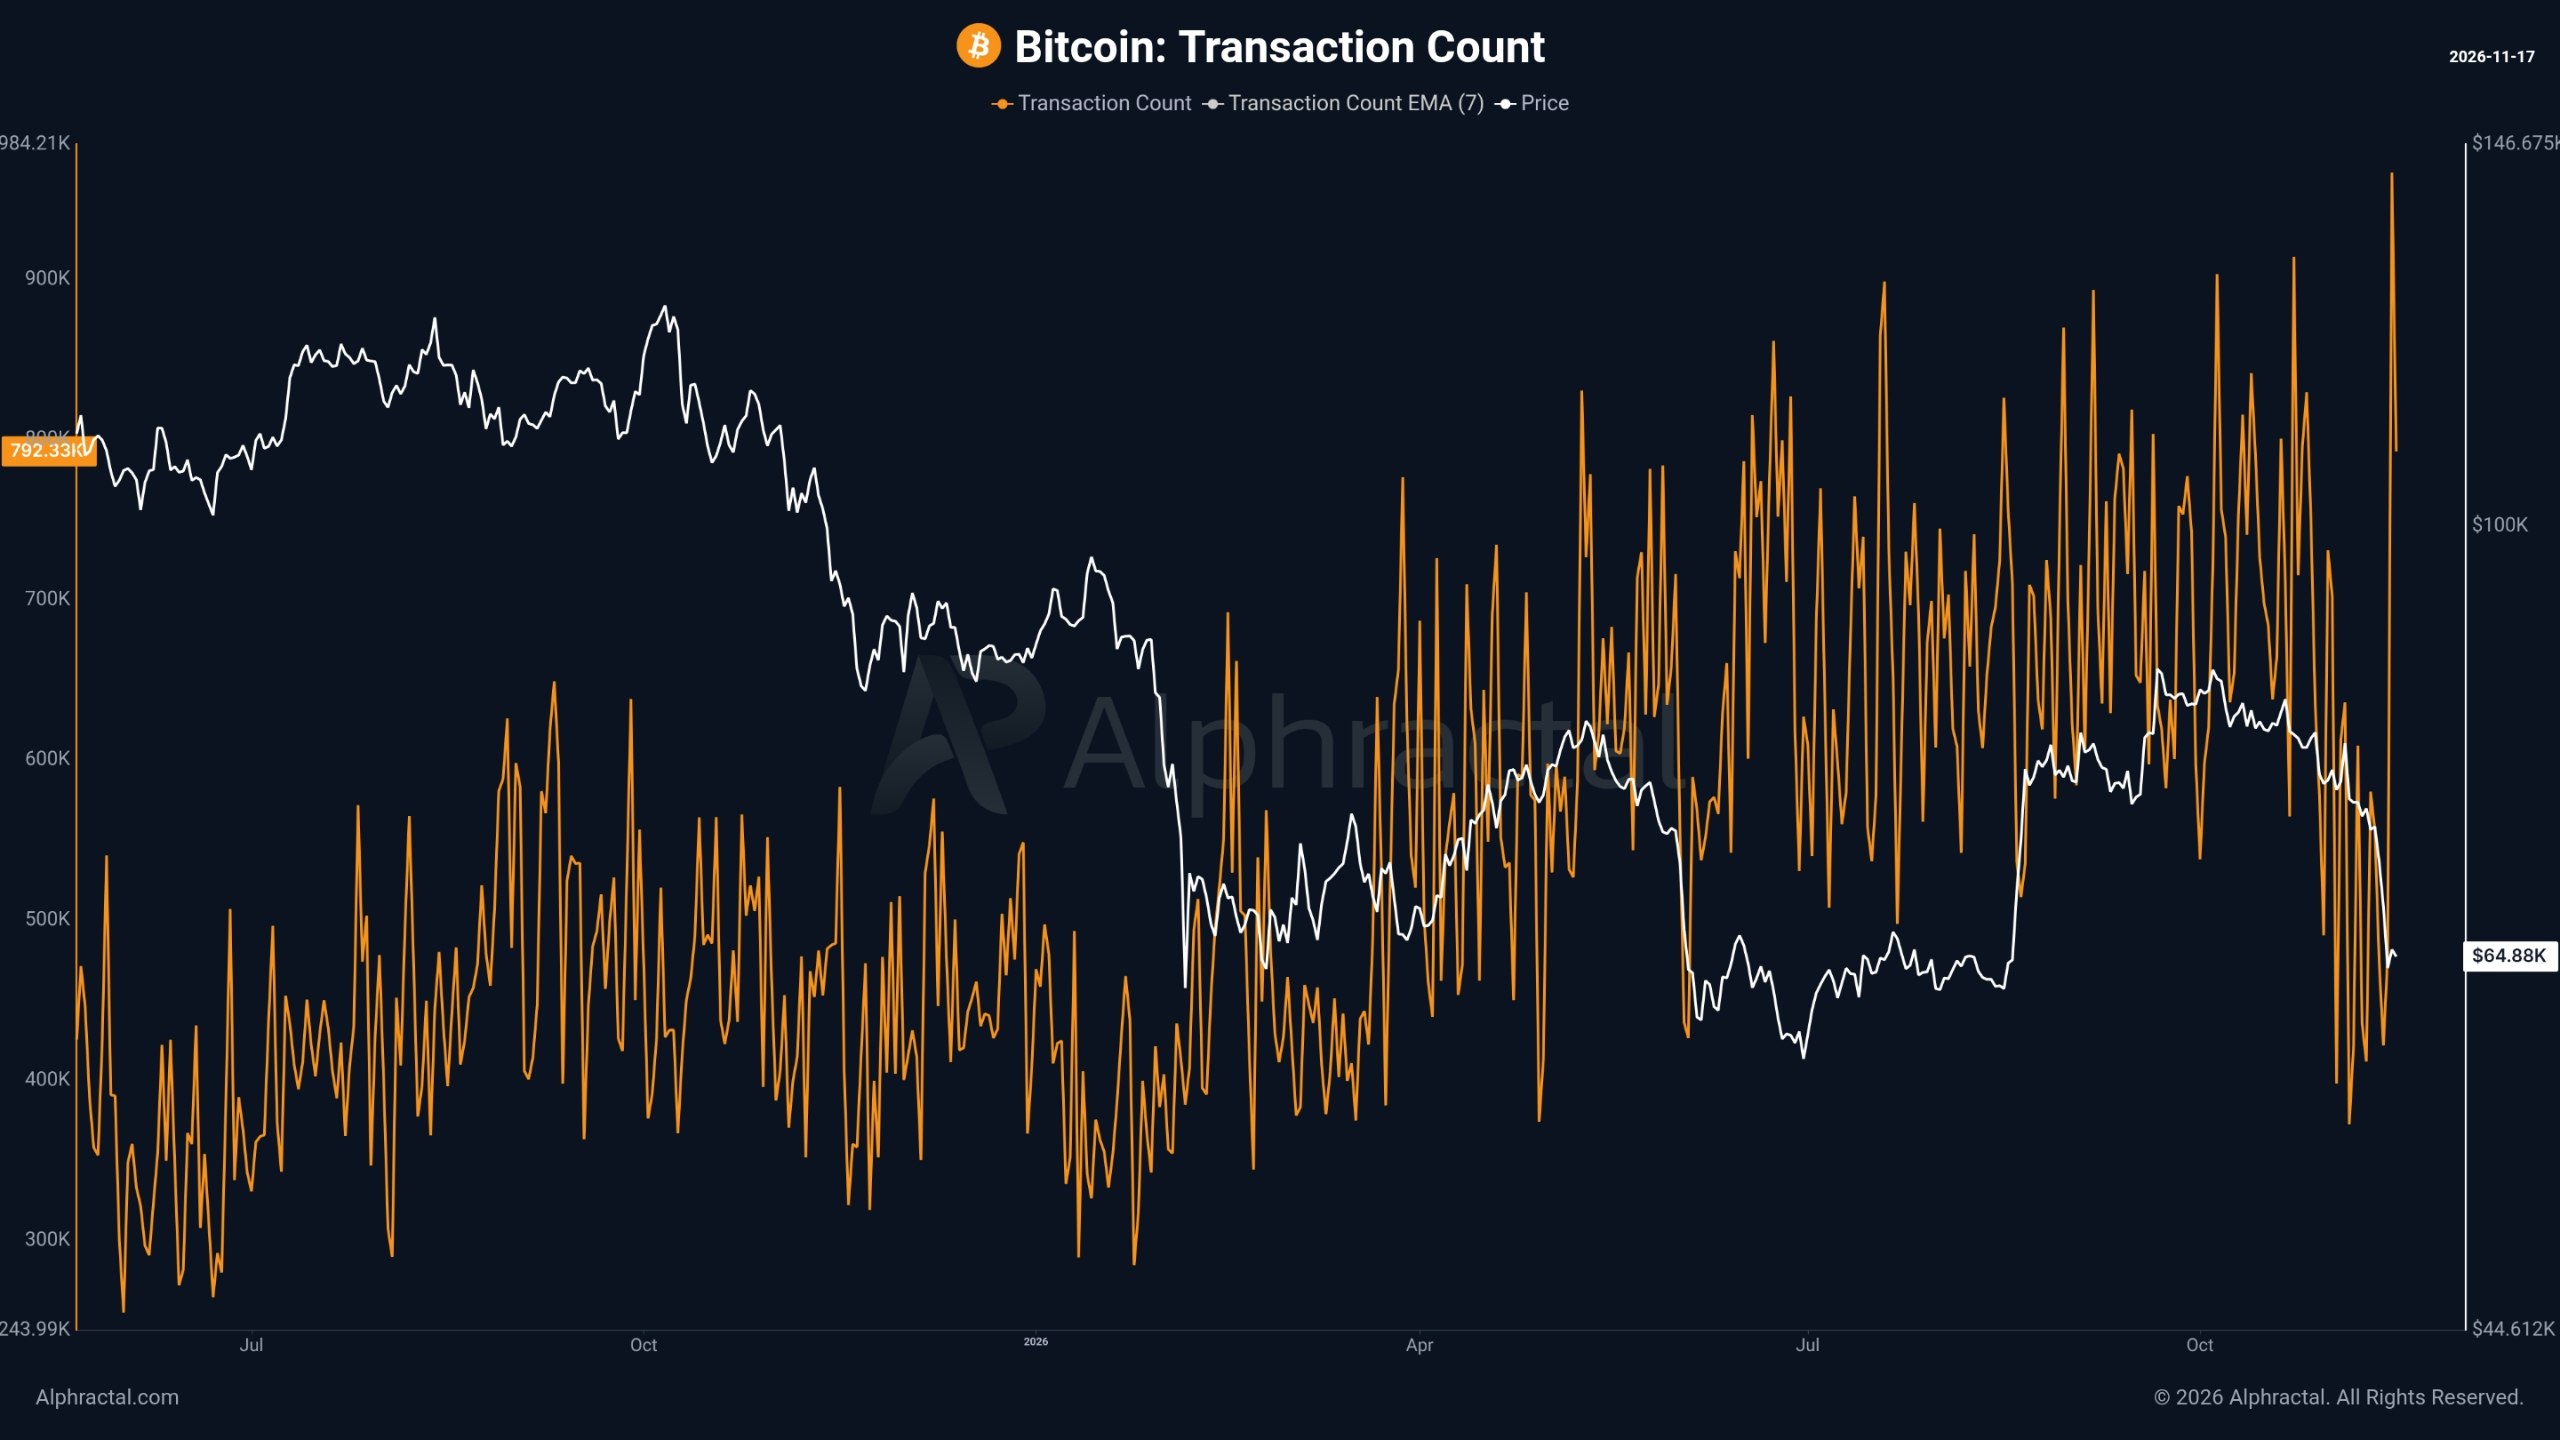
- Bitcoin logged 966,414 daily transactions on Nov 15 — an all-time high, breaking the Apr 23, 2024 record of 928,131
- Active addresses fell to 563,721 on the same day — down 10.4% daily and 9.0% weekly, contradicting the transaction surge
- Adjusted on-chain volume was $12.28B — only the 33rd percentile of the past 90 days, per Alphractal
- Bitcoin is trading at $64,958 (-0.05% 24h) with a $1.31T market cap at time of writing
Bitcoin is trading at $64,958 — essentially flat over the past 24 hours, down just 0.05% — with a market cap of $1.31 trillion. On November 15, the network logged 966,414 daily transactions, the highest single-day count in Bitcoin’s history. That number demands attention. But the data surrounding it demands more scrutiny than the headline will typically receive.
The analysis comes from the Alphractal research channel, which published the full breakdown on November 17. Their finding is not simply that a record was broken — it is that the record was broken in a way that contradicts the narrative typically attached to it. The channel’s exact framing: “But here’s the part the narrative will skip.” What follows that line is the article’s actual story.
The Record — What It Shows
The previous all-time high for Bitcoin daily transaction count was 928,131, set on April 23, 2024. November 15, 2026 broke that with 966,414 — a new ceiling after roughly 18 months. The acceleration was equally striking: just seven days earlier, on November 8, the daily count stood at 435,238. That means the network processed +122% more transactions in one week.
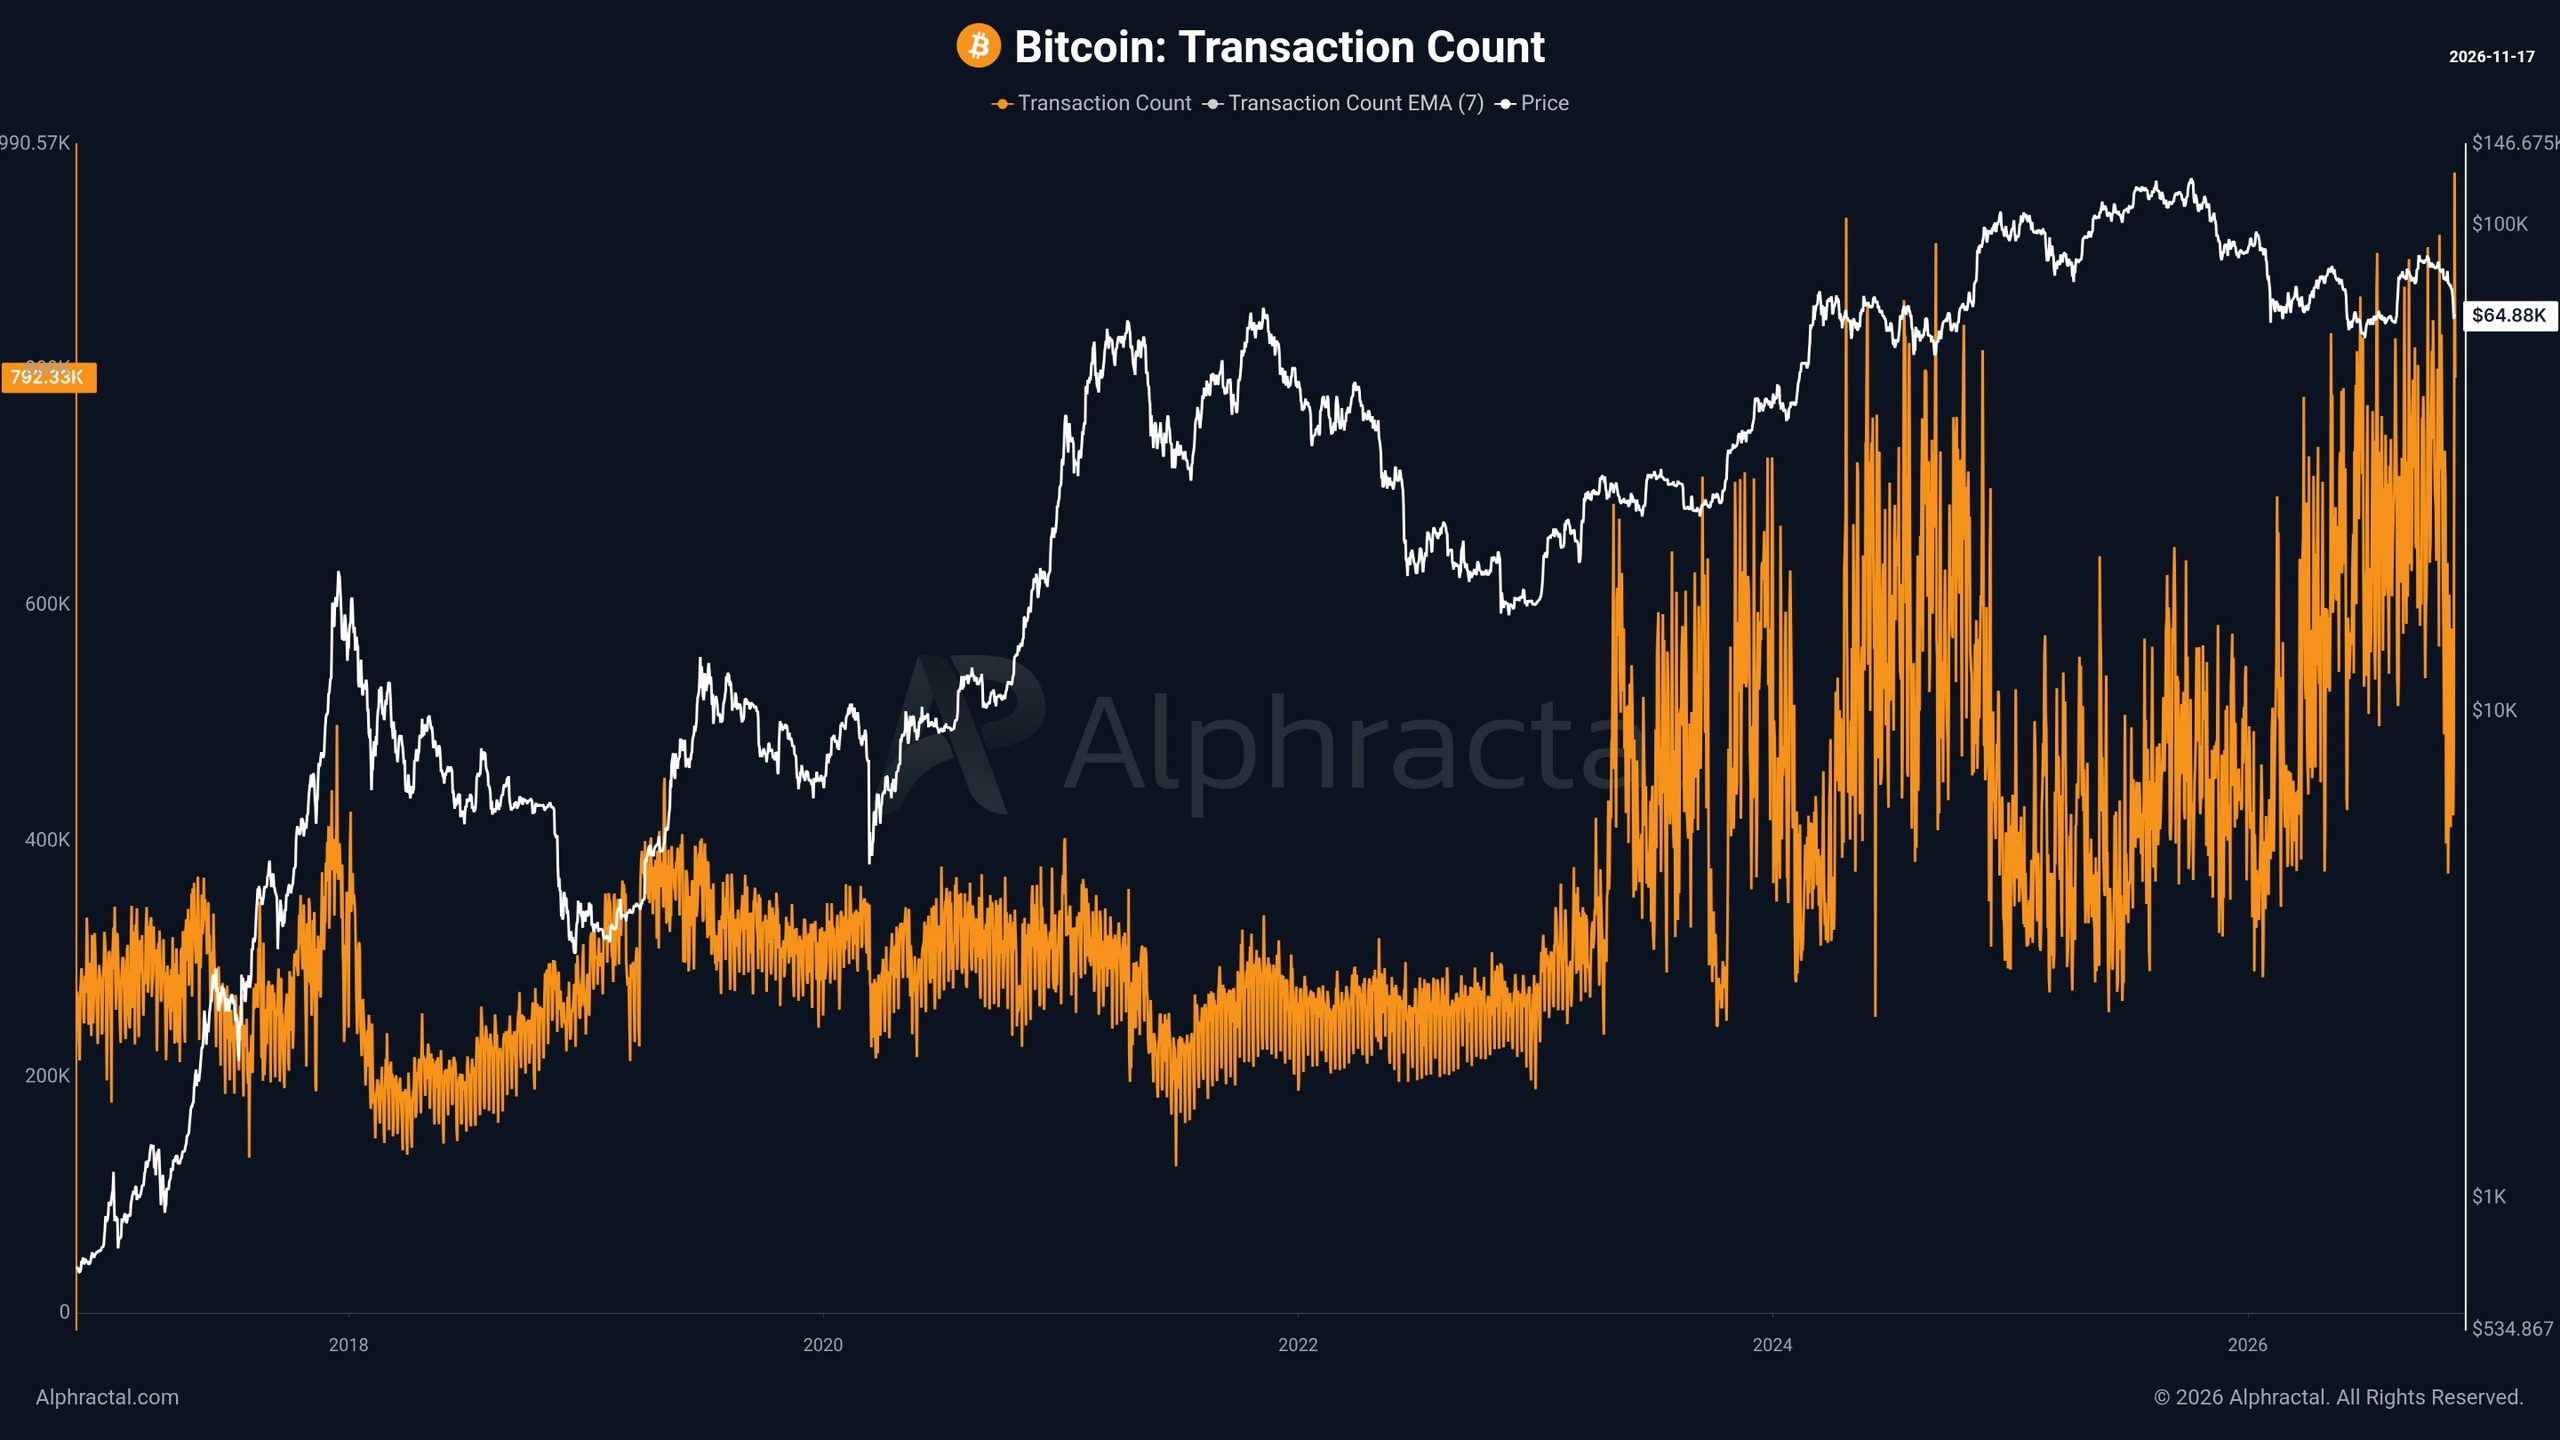
For context, a year prior the daily count was 485,232. The network has effectively doubled its transaction throughput in twelve months on this metric alone. At face value, this reads as a signal of explosive network activity — the kind of data point that gets cited in bull case arguments as evidence of genuine on-chain demand growth.
The Contradiction — What the Record Does Not Show
Alphractal’s note is precise about what broke down simultaneously with the transaction record. Active addresses — the number of unique Bitcoin addresses that sent or received funds on November 15 — fell to 563,721. That is a decline of 10.4% in a single day and 9.0% over the week. The same session that produced a record transaction count produced fewer active participants than the days preceding it.
This divergence is structurally important. When transaction count rises while active addresses fall, it means fewer wallets are generating more transactions per address — not that more participants are entering the network. The two metrics measure different things: transaction count measures activity volume, active addresses measure network breadth. A record in one paired with a decline in the other is not confirmation of the same thesis — it is a split reading that requires a different explanation.
The adjusted on-chain volume figure reinforces the caution. On November 15, adjusted on-chain volume was $12.28 billion. Alphractal places that at the 33rd percentile of the last 90 days. That is not an extreme reading in either direction — it sits in the lower third of recent daily volume. A network record for transaction count, produced on a day when volume was below two-thirds of its recent range, points toward a specific structural explanation: the surge in transactions likely reflects a high volume of small-value transfers, protocol-level activity, or batched operations — not a broad-based surge in economic throughput.
This pattern has appeared before in Bitcoin’s history. Periods where transaction count spikes without a corresponding surge in adjusted volume or active addresses have frequently coincided with Ordinals inscription activity, BRC-20 token minting, or layer-2 settlement batching — all of which generate on-chain transactions without representing direct peer-to-peer economic activity in the traditional sense. Alphractal does not explicitly name which mechanism is driving the current split, but the data signature is consistent with that category of activity. That context matters for interpreting what the record actually means for Bitcoin’s market structure. For recent context on whale-level positioning during this period, see Bitcoin Whales Sold $3.40 Billion in BTC Over Two Weeks — Selling Hasn’t Stopped.
Reading the Data Correctly — Two Metrics, Two Stories
The honest read of November 15 is this: Bitcoin set a new all-time high in one specific on-chain metric (daily transaction count) while two other on-chain metrics (active addresses, adjusted volume) provided no corroborating confirmation of a broad demand surge. That is not a bearish conclusion — it is a precise one.
The data table below summarizes the split reading:
| Metric | Nov 15 Reading | Signal |
|---|---|---|
| Daily Transaction Count | 966,414 (all-time high) | Record — above Apr 23, 2024 high of 928,131 |
| Active Addresses | 563,721 (−10.4% day / −9.0% week) | Declining breadth |
| Adjusted On-Chain Volume | $12.28B | 33rd percentile of 90-day range |
| 7-Day Transaction Growth | +122% (from 435,238 on Nov 8) | Acceleration, not steady growth |
Source: Alphractal (Telegram, November 17, 2026)
The 7-day acceleration from 435,238 to 966,414 is itself a flag worth examining. Organic network demand growth does not typically produce +122% weekly spikes. Gradual adoption curves look different. A near-doubling in one week suggests a specific event or activity type drove the count — further supporting the interpretation that this is protocol-level or inscription-driven activity rather than a broad expansion of Bitcoin’s active user base. For perspective on where Bitcoin’s price support structure stands independently of this transaction data, see Bitcoin RSI Hits Deeply Oversold — 200DMA and CVDD at $50.8K Now in Focus.
What This Means for Bitcoin’s Current Market Position
At $64,958, Bitcoin is not currently pricing the transaction record as a major catalyst — the 24-hour move is effectively zero. That flat response is itself informative. Markets tend to price genuine demand signals. A record transaction count that co-occurs with declining active addresses and below-median volume is apparently not registering as a demand signal to participants who trade on on-chain data.
The more relevant on-chain question for Bitcoin’s near-term trajectory is whether the active address count recovers — specifically, whether the decline from the November 15 session reverses in the sessions that follow. Rising transaction count with rising active addresses and rising adjusted volume would constitute a convergent bullish on-chain picture. The current divergence does not.
Alphractal’s framing — “the part the narrative will skip” — is the methodological point worth retaining. Single-metric records in complex on-chain systems are regularly cited selectively. The transaction count record is real. What it confirms about Bitcoin’s demand structure on November 15 is more limited than the headline implies.
Watch active addresses and adjusted on-chain volume in the sessions following November 15. If both recover toward or above their 90-day medians while transaction count holds elevated, the record gains corroborating weight. If active addresses continue declining while transaction count stays high, the divergence points to protocol-level activity — not a demand-driven network expansion — and the record loses most of its market-structure significance.
Frequently Asked Questions
Why did Bitcoin’s transaction count hit an all-time high while active addresses declined?
What does the 33rd percentile adjusted on-chain volume reading mean?
What would confirm that Bitcoin’s transaction record reflects genuine demand growth?
How significant is the +122% jump in Bitcoin transactions in seven days?
Source: Alphractal · Published by CoinsProbe Markets Desk
The opinions and market insights shared on CoinsProbe represent the views of individual authors based on prevailing market conditions at the time of publication. Cryptocurrency investments carry significant risk and volatility. Readers are encouraged to conduct their own research and seek professional financial advice before making investment decisions. CoinsProbe and its contributors do not accept responsibility for financial losses or decisions made based on published content.
CoinsProbe may publish sponsored articles, affiliate links, or promotional collaborations. All sponsored material is clearly labeled to maintain transparency with our audience. Our editorial decisions remain fully independent, and advertising partnerships do not influence reviews, rankings, or published opinions.
Since 2023, CoinsProbe has delivered reliable insights on cryptocurrency, blockchain, and digital assets. Our content is created by experienced researchers and analysts who follow strict editorial standards focused on accuracy, transparency, and credibility. Every article is carefully reviewed and verified using trusted sources and current market data. We provide unbiased analysis and timely updates covering everything from emerging crypto projects to major industry developments.