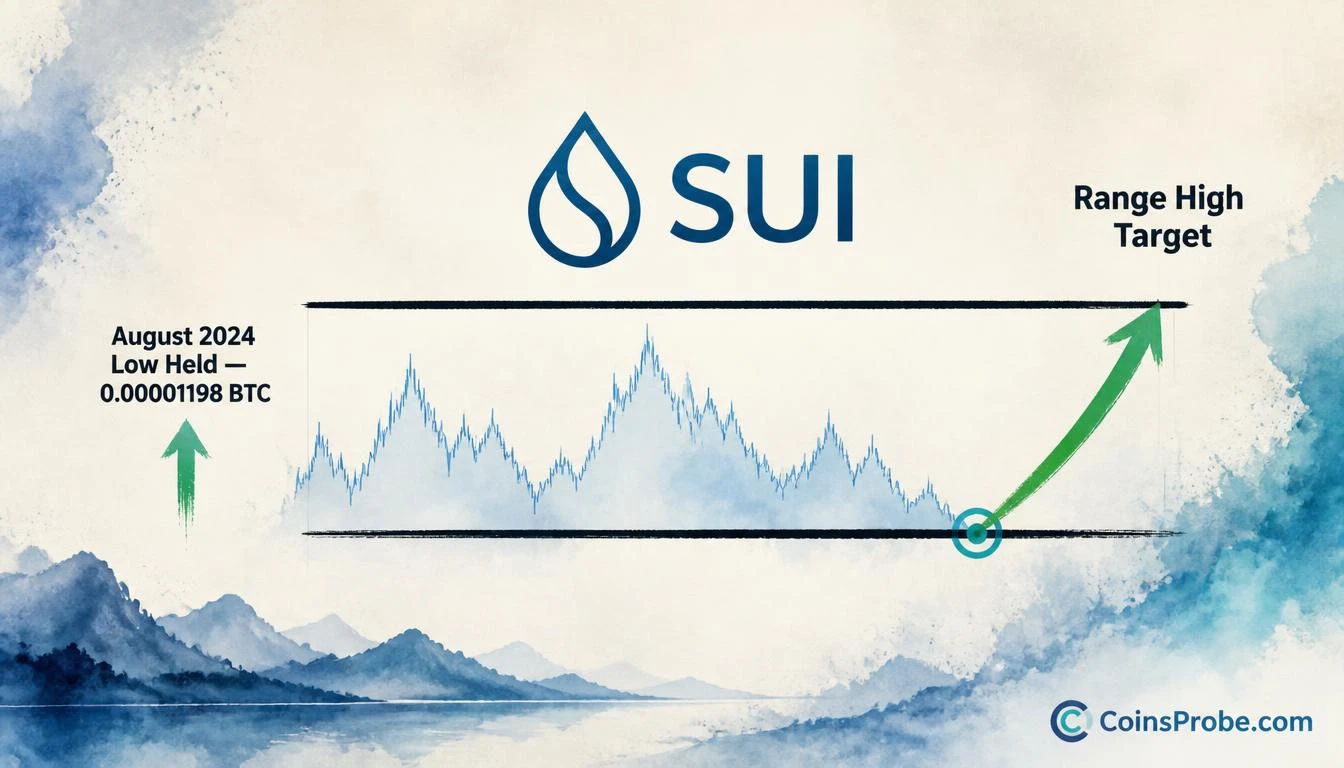
- SUI/BTC is trading at 0.00001206 BTC — defending the August 2024 range low (weekly low: 0.00001198 BTC)
- Analyst @CryptoBullet1 identifies the entire price action as a "huge range" and expects a return to the Range High
- Invalidation level: a weekly close below 0.00001198 BTC breaks the entire range structure
- Bitcoin trades at $81,619 (-2.27% 24h) — SUI gaining BTC-relative strength amplifies any USD-denominated move
SUI is trading at $3.58 against the US dollar, but the more significant data point right now is not the USD price — it is what SUI is doing measured in Bitcoin. On the SUI/BTC weekly chart, the pair is holding at 0.00001206 BTC, a level that corresponds directly to the August 2024 low. That defense of support is the basis for one of the most structurally clear range setups currently on the board for any major altcoin.
Analyst @CryptoBullet1 flags the setup directly: “$SUI held its August 2024 low against $BTC and now I view all this entire PA as a huge range. I’m expecting $SUI to return back to the Range High — very bullish for $SUIUSD.” The framing is not a speculative target. It is a structural reading of price action: every swing from August 2024 to present has been contained within two horizontal boundaries, and the pair is currently sitting at the lower one.
The SUI/BTC Range — Structure and Current Position
The weekly SUI/BTC chart shared by @CryptoBullet1 shows a broad horizontal consolidation defined by two thick black boundary lines. The lower boundary marks the August 2024 low, which the chart’s current candle is testing at 0.00001206 BTC — with a weekly low printed at 0.00001198 BTC, a level that held without closing below the range floor. The upper boundary, which @CryptoBullet1 identifies as the Range High, sits at the upper horizontal line visible on the chart, with axis ticks printing at levels including 0.00004500 and above in the longer-term projection window. The analyst’s large green arrow on the chart projects price from the current range low back toward the upper boundary — the directional call made explicit by the annotation.
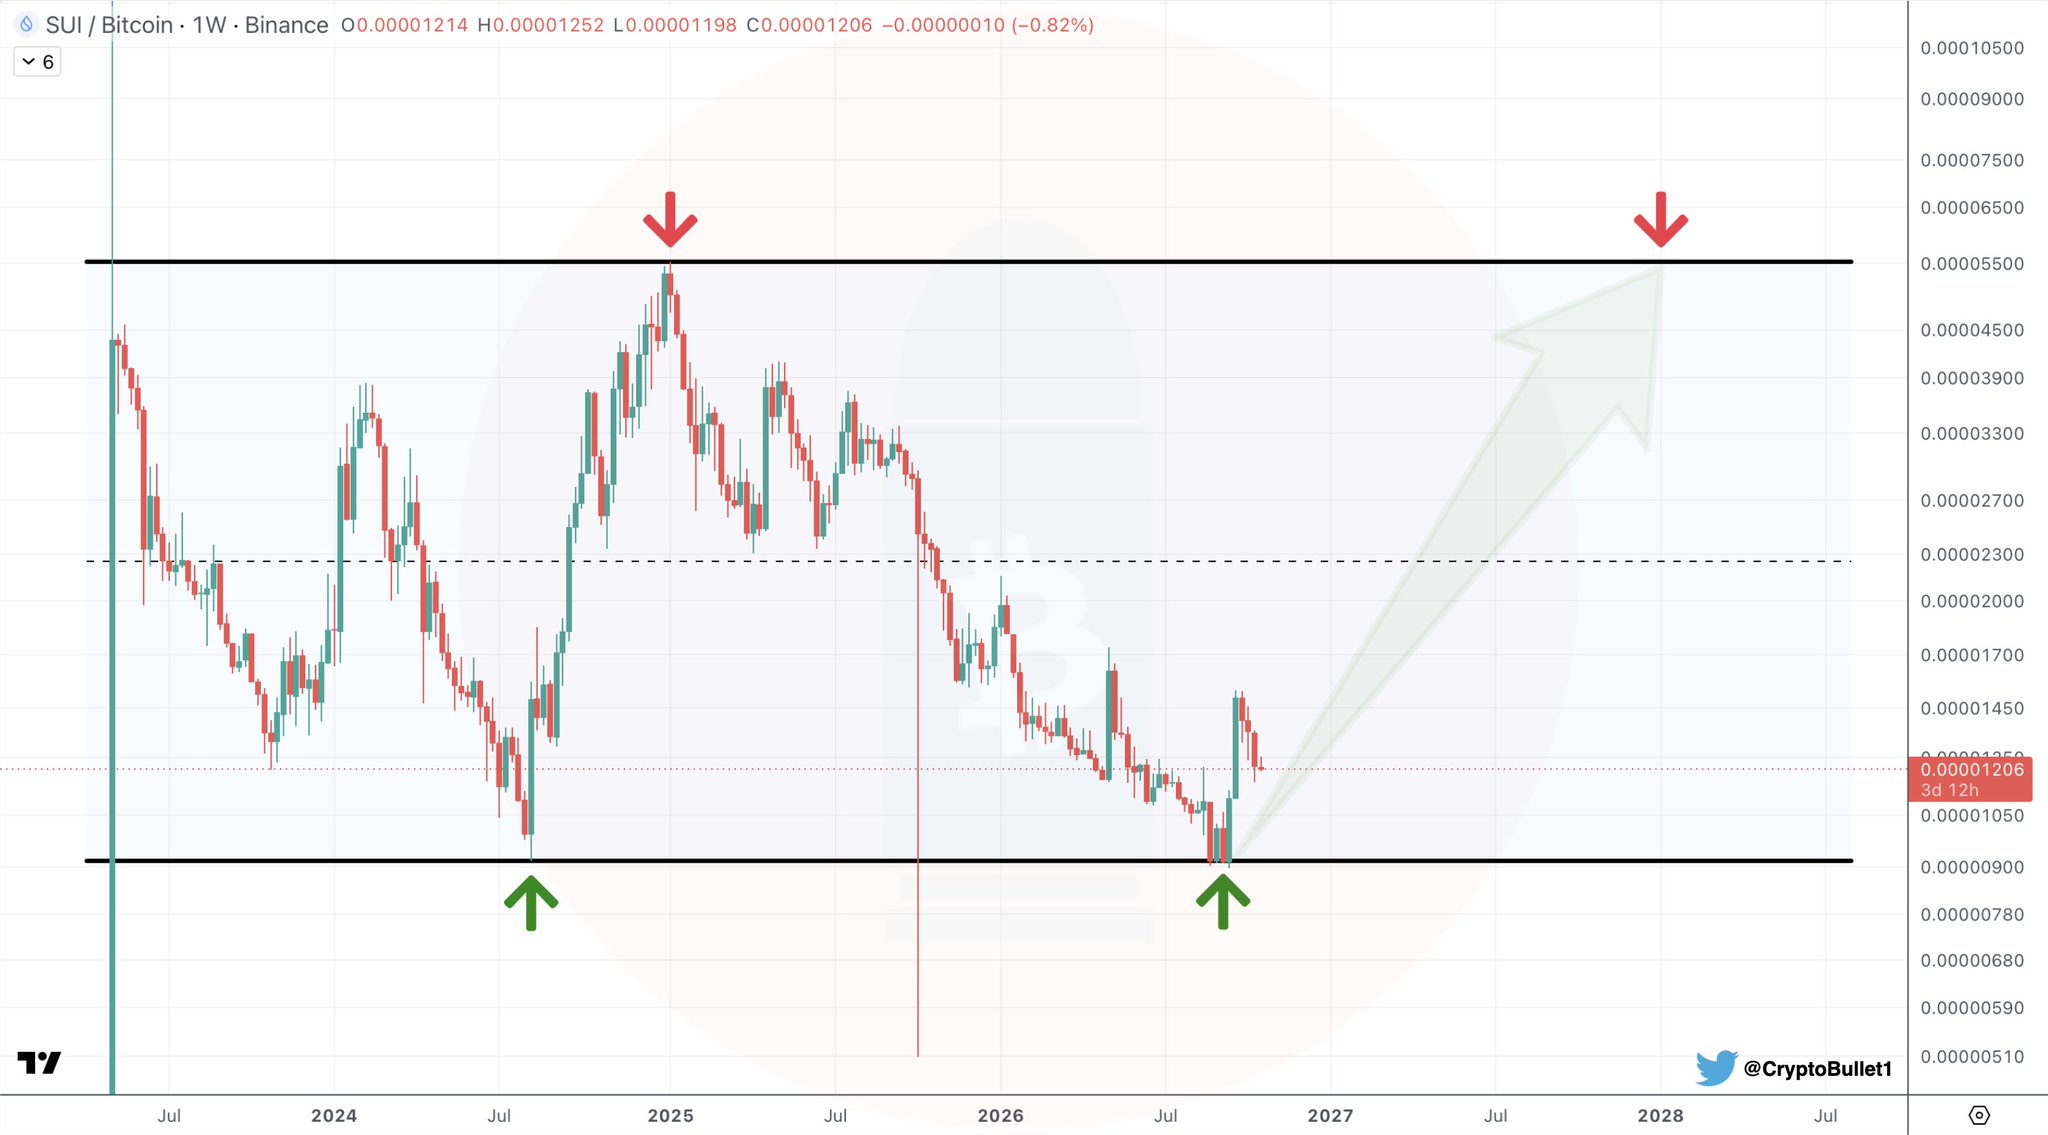
The range has been confirmed by at least two distinct lows (green arrows at the bottom boundary) and two distinct highs (red arrows at the upper boundary), forming a textbook horizontal range structure on the weekly timeframe. A range of this construction — with multiple confirmed touches on both sides and a clear support defense at the anchor low — gives traders a defined invalidation point and a defined target simultaneously. The invalidation is a weekly close below 0.00001198 BTC. The target is the upper boundary. There is no ambiguity in the setup.
Why the August 2024 Low Matters as an Anchor
The August 2024 low is not an arbitrary price level. It was the capitulation point set during a broader crypto market flush — the point at which SUI’s Bitcoin-denominated value found its deepest relative exhaustion. A pattern that holds its prior cycle low on a weekly close basis is demonstrating that buyer absorption is occurring at a structurally significant level, not at a random point. The fact that the pair has revisited this level in 2026 and, according to the chart, has again held it on a closing basis is precisely what makes the range structure credible rather than coincidental.
For context on the broader SUI technical picture, the asset has previously generated multiple macro-level buy signals. A weekly Parabolic SAR flip emerged after an 83% drawdown, and a SuperTrend buy signal on the weekly chart preceded a 77.53% rally in a prior instance. The current SUI/BTC range hold adds a relative-strength dimension to those USD-denominated signals — SUI is not merely recovering in dollar terms, it is holding its ground against Bitcoin itself.
The BTC/USD Context
At the time of writing, Bitcoin is trading at $81,619 — down 2.27% in the past 24 hours, with a market cap of approximately $1.64 trillion and 24-hour volume of $38.33 billion. The SUI/BTC reading of 0.00001206 at this Bitcoin price places SUI’s implied USD value in context: if SUI/BTC returns to its range high while Bitcoin trades at or above current levels, the USD-denominated gain would be amplified. This is the mechanism behind @CryptoBullet1’s parenthetical — “very bullish for $SUIUSD” — SUI gaining Bitcoin-relative strength during a period when Bitcoin itself is not collapsing is a structurally favorable combination for the USD-priced asset.
SUI has previously reclaimed key mid-range levels with defined channel targets, a pattern consistent with what the current weekly setup is now projecting on the BTC pair.
Bullish and Bearish Scenarios
Bullish Scenario
SUI/BTC sustains above the August 2024 low (0.00001198 BTC on a weekly closing basis) and begins a directional move toward the upper range boundary. The target, as annotated by @CryptoBullet1, is the range high defined by the upper horizontal line on the weekly chart. A weekly close above the midpoint of the range would be the first intermediate confirmation that the move has begun. The USD-denominated SUI price would see amplified gains if Bitcoin holds or advances concurrently.
Bearish Scenario
A weekly close below 0.00001198 BTC — the range low and August 2024 anchor — would invalidate the range structure entirely. That would mean SUI is making a new relative low against Bitcoin, breaking the horizontal support that the entire setup depends on. Under that scenario, the range thesis is off the table and the pair would be in price discovery below the prior cycle low on the BTC-denominated basis.
The setup @CryptoBullet1 has identified is binary in the cleanest possible sense: the range support holds or it does not. As of the current weekly candle, it has held. The level to watch is 0.00001198 BTC — the weekly close that separates the range trade from its invalidation.
Source: x.comFrequently Asked Questions
What is the SUI/BTC range low that @CryptoBullet1 is watching?
Why does the SUI/BTC chart matter for the USD price of SUI?
What confirms that the SUI/BTC range trade is underway?
How far is the SUI/BTC range high from the current level?
Source: Cryptobullet1 · Published by CoinsProbe Markets Desk
The opinions and market insights shared on CoinsProbe represent the views of individual authors based on prevailing market conditions at the time of publication. Cryptocurrency investments carry significant risk and volatility. Readers are encouraged to conduct their own research and seek professional financial advice before making investment decisions. CoinsProbe and its contributors do not accept responsibility for financial losses or decisions made based on published content.
CoinsProbe may publish sponsored articles, affiliate links, or promotional collaborations. All sponsored material is clearly labeled to maintain transparency with our audience. Our editorial decisions remain fully independent, and advertising partnerships do not influence reviews, rankings, or published opinions.
Since 2023, CoinsProbe has delivered reliable insights on cryptocurrency, blockchain, and digital assets. Our content is created by experienced researchers and analysts who follow strict editorial standards focused on accuracy, transparency, and credibility. Every article is carefully reviewed and verified using trusted sources and current market data. We provide unbiased analysis and timely updates covering everything from emerging crypto projects to major industry developments.