
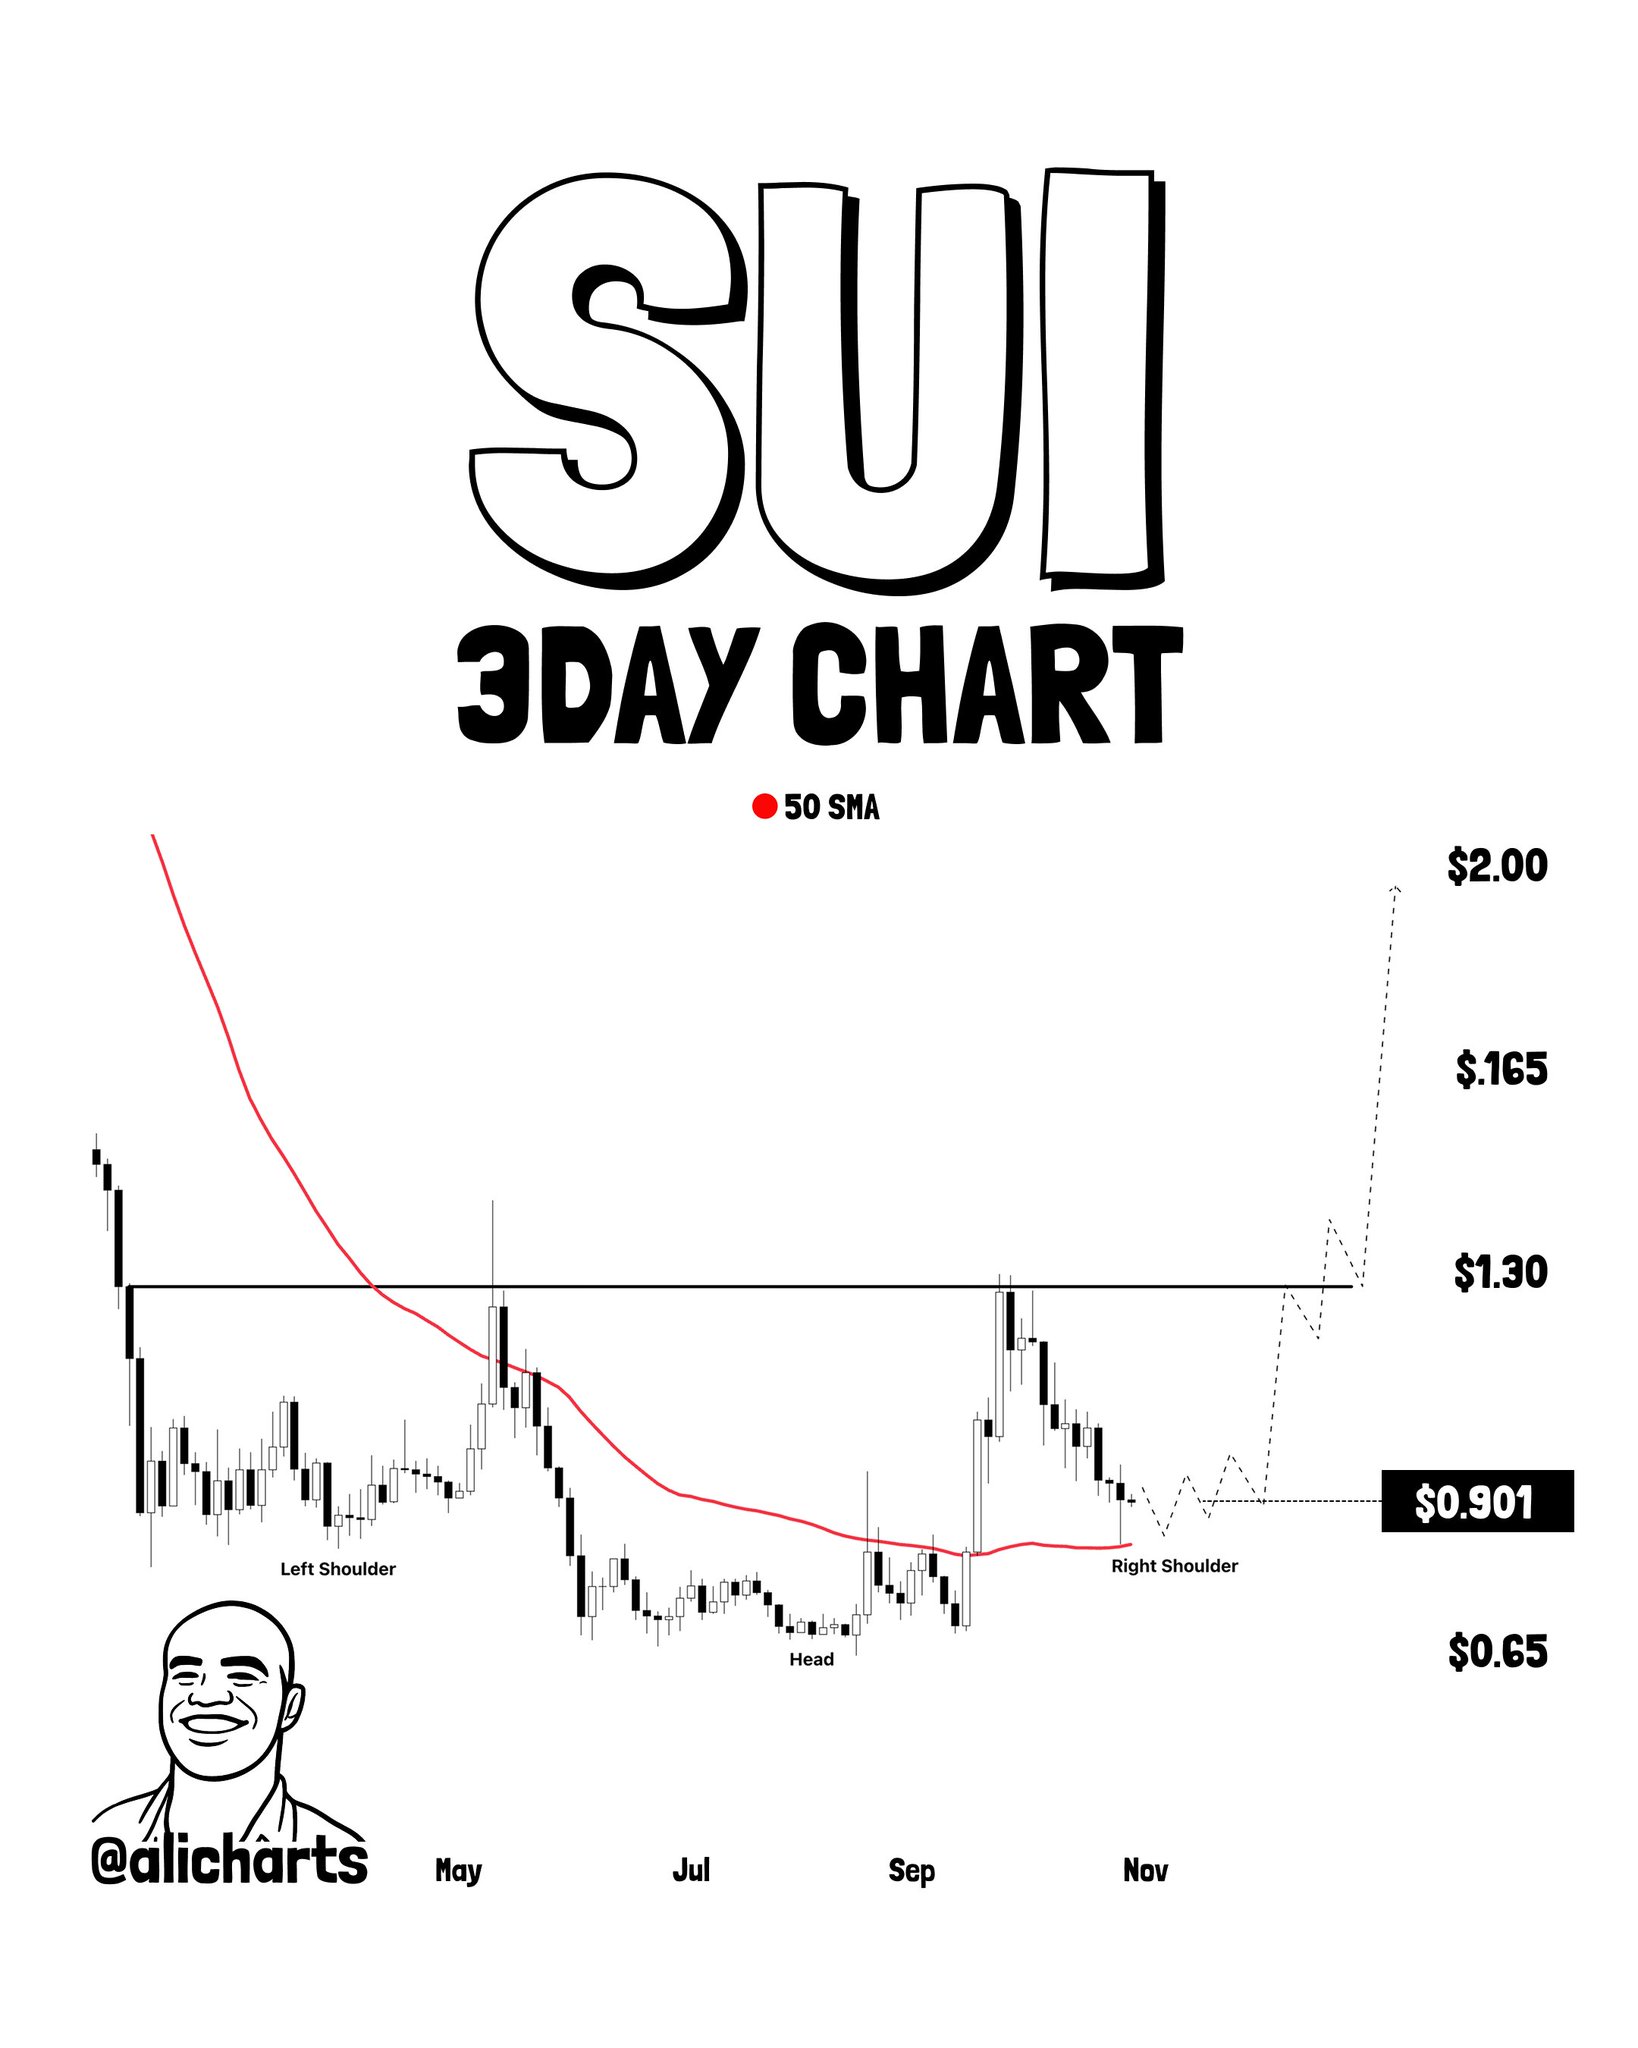
- SUI trades at $0.8971 — down 23.19% over 30 days — as an inverse H&S forms on the 3-day chart per analyst @alicharts
- Analyst cites 40.6M TPS live test, Alibaba Cloud AI-agent payments, and Samsung Wallet USDC integration as fundamental catalysts
- $1.30 neckline is the confirmation level; $0.80 (3-day 50 SMA) is the invalidation floor — $2.00 is the measured move target
SUI is trading at $0.8971 — up 0.84% in the past 24 hours but down 5.22% over seven days and 23.19% over the past 30 days — while an inverse head-and-shoulders pattern develops on the 3-day chart, with a neckline at $1.30 and a breakout extension target of $2.00 if that level is cleared with conviction. The market cap stands at approximately $3.69 billion.
The setup, identified by a crypto analyst at @alicharts in post 4 of an 8-part thread published on October 31, 2026, is not purely technical. The analyst cites a trio of fundamental developments that give the chart structure added weight: a live throughput test that processed 40.6 million transactions per second through off-chain tunnels settling to Sui Network, an active collaboration with Alibaba Cloud on AI-agent payment infrastructure, and Samsung Wallet’s announced plan to offer USDC natively on Sui. The analyst states they are accumulating SUI on the current pullback.
Signal 1 — Inverse Head & Shoulders: The Chart Structure
An inverse head-and-shoulders is a three-trough reversal pattern. The left shoulder and right shoulder form at similar price depths, while the head — the central and deepest trough — marks the exhaustion low. A horizontal neckline connecting the interim peaks between troughs acts as the key breakout threshold. A sustained close above the neckline is required to confirm the pattern; until that occurs, the structure is forming but unresolved.
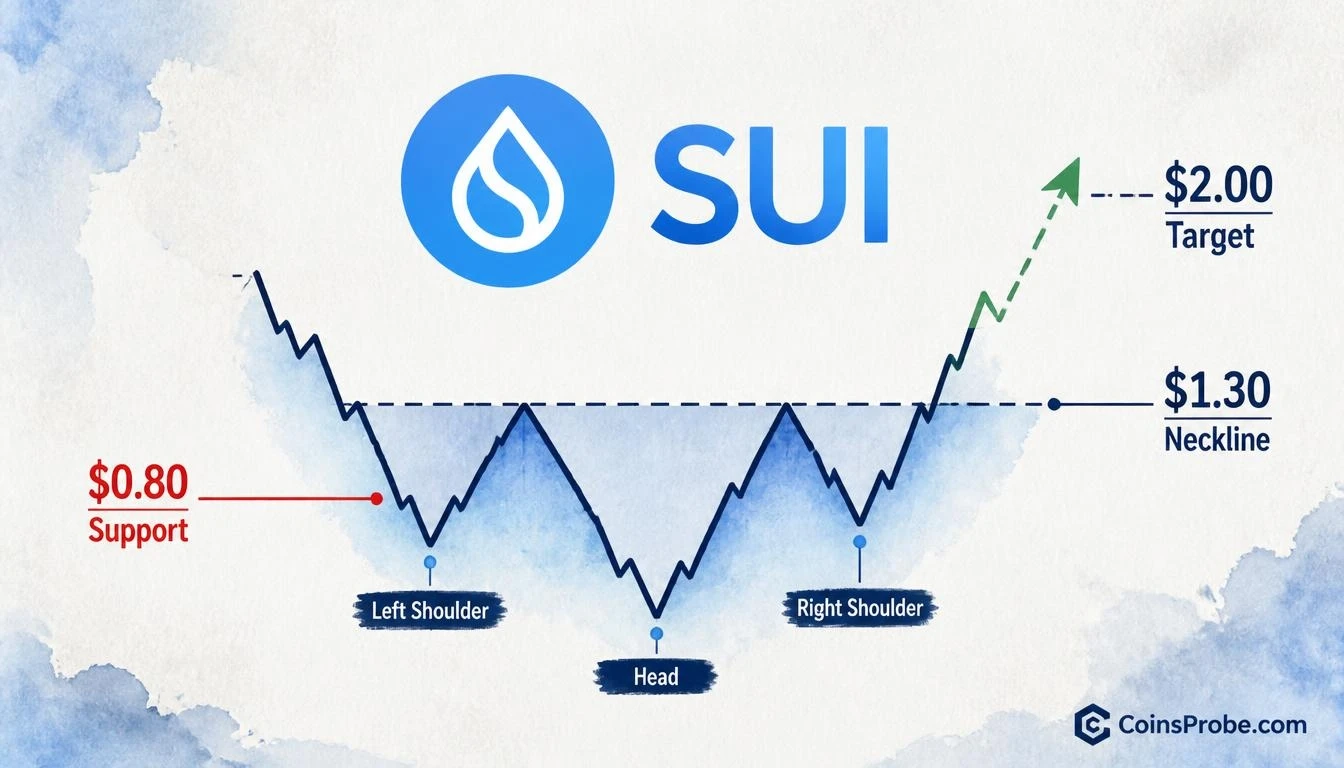
On the 3-day chart shared by the analyst, the three troughs are clearly labeled: left shoulder, head (the deepest trough in the sequence), and right shoulder. The neckline sits at approximately $1.30, which is also the first major resistance level. Current price at $0.901 is above the $0.65 support zone but well below the $1.30 neckline — the pattern is still forming. A dashed projection line on the chart traces an anticipated path toward and through $1.30, but this is a projected trajectory, not a confirmed move. The 3-day 50 SMA near $0.80 is flagged by the analyst as the level that must hold on any further pullback — losing it would undermine the right shoulder structure.
Signal 2 — Fundamentals Providing the Structural Floor
Technical patterns do not form in a vacuum. What distinguishes this setup from a generic oversold bounce is the convergence of three verifiable, named catalysts that each expand SUI’s real-world utility surface.
40.6 Million TPS Test: A live throughput test processed 40.6 million transactions per second through off-chain tunnels that settle to Sui Network. This is not a simulated benchmark — the analyst explicitly describes it as a live test. For context, Visa’s peak network capacity is frequently cited at approximately 65,000 TPS. A 40.6M TPS demonstration, even through off-chain infrastructure, signals infrastructure capability at a scale relevant to institutional payment rails.
Alibaba Cloud AI-Agent Payments: Sui Network is working with Alibaba Cloud specifically on AI-agent payment infrastructure — a sector that intersects two of the most capital-intensive narratives in technology in 2026. The collaboration places Sui at the intersection of AI compute and programmable money flows.
Samsung Wallet USDC Integration: Samsung Wallet’s plan to offer USDC on Sui opens a consumer-facing distribution channel for SUI-based stablecoin activity. Samsung shipped approximately 226 million smartphones in 2025. Native USDC access within Samsung Wallet would represent a direct user onboarding vector without requiring any app download or crypto-native behavior from end users.
These are not roadmap promises — they are named, sourced developments cited by the analyst as reasons to accumulate on the current pullback. For broader context on how on-chain fundamentals interact with price structure in crypto markets, see our analysis: ETH Enters ‘Buy The Dip’ Zone — $2,000–$2,300 After 200-Week MA Break.
On-Chain Data — Current DeFiLlama Readings
DeFiLlama data for the Sui chain shows a TVL of $462.63 million, with $36.99 million in 24-hour DEX volume and $178.31 million in 7-day DEX volume. Fees generated in the past 24 hours total $123,200, with $677,100 over the past seven days. These figures confirm that Sui’s DeFi ecosystem is operationally active, though TVL and fee generation remain at levels that leave meaningful room for growth relative to larger L1 chains.
The Two Levels That Define This Trade
$0.80 — The 3-Day 50 SMA (Invalidation Level): The analyst explicitly identifies the 3-day 50 SMA near $0.80 as the level that must hold. With current price at $0.8971, there is approximately 11% of cushion between spot and this moving average. A sustained close below $0.80 on the 3-day timeframe would damage the right shoulder structure and reduce confidence that the inverse H&S will resolve to the upside.
$1.30 — The Neckline (Confirmation Level): A decisive close above $1.30 on the 3-day chart would confirm the inverse head-and-shoulders. That level sits approximately 45% above current price. The analyst then identifies $2.00 as the pattern’s measured extension target — a further 54% above the neckline, or approximately 123% above current price at $0.8971.
Macro context is relevant here: upcoming U.S. economic data — including Nonfarm Payrolls on November 6 and CPI on November 10 — could introduce volatility across risk assets in the near term, potentially affecting the pace at which SUI tests the $1.30 neckline.
Bullish Scenario — Neckline Reclaim
A confirmed 3-day close above $1.30, with the 3-day 50 SMA at $0.80 holding as support, would technically confirm the inverse H&S and open the measured move toward $2.00. The fundamental backdrop — 40.6M TPS capacity, Alibaba Cloud collaboration, Samsung Wallet distribution — provides a credible narrative to support institutional interest during any such move.
Bearish Scenario — Loss of the 50 SMA
A 3-day close below $0.80 would invalidate the right shoulder structure. In that case, the inverse H&S interpretation fails, and the chart reverts to a downtrend context with $0.65 as the next labeled support level on the analyst’s chart — representing an additional ~27% decline from the $0.80 trigger.
What the Pattern Says — and What It Doesn’t
The inverse H&S is a reversal signal, not a guarantee. It measures the probability that selling exhaustion has occurred and that buyers are systematically establishing higher lows. What it confirms, if the neckline breaks: that three distinct waves of selling — left shoulder, head, right shoulder — produced diminishing lows, and that demand absorbed each wave. What it does not confirm: the magnitude or timing of the subsequent move. The $2.00 target is a measured move projection derived from pattern geometry, not a price guarantee. The $0.80 SMA is a reference level for structural integrity, not a stop-loss recommendation. For context on other risk signals moving through the broader crypto market simultaneously, see: Bitcoin STH Net P/L Flips Negative — First Loss Signal in 72 Days.
SUI is trading at $0.8971, holding above the analyst-identified 3-day 50 SMA near $0.80, with an inverse head-and-shoulders still forming and a neckline at $1.30 that has not yet been tested. The fundamental case — 40.6M TPS live throughput, Alibaba Cloud AI-agent payments, and Samsung Wallet USDC integration — gives the technical setup a named, verifiable foundation. Watch $0.80 as the level that keeps the right shoulder intact, and $1.30 as the close that would confirm the entire structure and open the path toward $2.00.
Frequently Asked Questions
What is the inverse head-and-shoulders neckline level for SUI, and why does it matter?
What level would invalidate the SUI inverse head-and-shoulders pattern?
What are the fundamental catalysts cited for SUI’s potential recovery?
How far is SUI from the $1.30 neckline breakout target right now?
Source: Ali Charts · Published by CoinsProbe Markets Desk
The opinions and market insights shared on CoinsProbe represent the views of individual authors based on prevailing market conditions at the time of publication. Cryptocurrency investments carry significant risk and volatility. Readers are encouraged to conduct their own research and seek professional financial advice before making investment decisions. CoinsProbe and its contributors do not accept responsibility for financial losses or decisions made based on published content.
CoinsProbe may publish sponsored articles, affiliate links, or promotional collaborations. All sponsored material is clearly labeled to maintain transparency with our audience. Our editorial decisions remain fully independent, and advertising partnerships do not influence reviews, rankings, or published opinions.
Since 2023, CoinsProbe has delivered reliable insights on cryptocurrency, blockchain, and digital assets. Our content is created by experienced researchers and analysts who follow strict editorial standards focused on accuracy, transparency, and credibility. Every article is carefully reviewed and verified using trusted sources and current market data. We provide unbiased analysis and timely updates covering everything from emerging crypto projects to major industry developments.