
- SUI trades at $0.7842 — down 3.73% in 24h and 25.99% over 30 days, market cap $3.25B
- An analyst flags a potential inverse H&S on SUI's daily chart with a $2.2–$2.5 breakout target
- Pattern is still forming — neckline in the $1.25–$1.45 zone has not yet been reclaimed
SUI is trading at approximately $0.7842 — down 3.73% in the past 24 hours, 9.73% over the past seven days, and 25.99% over the past 30 days — with a market cap of $3.25 billion. Despite the drawdown, a classic technical reversal pattern is forming on the daily chart that could reset the entire trend if confirmed. The structure in question is an inverse Head & Shoulders, and an analyst is watching it closely.
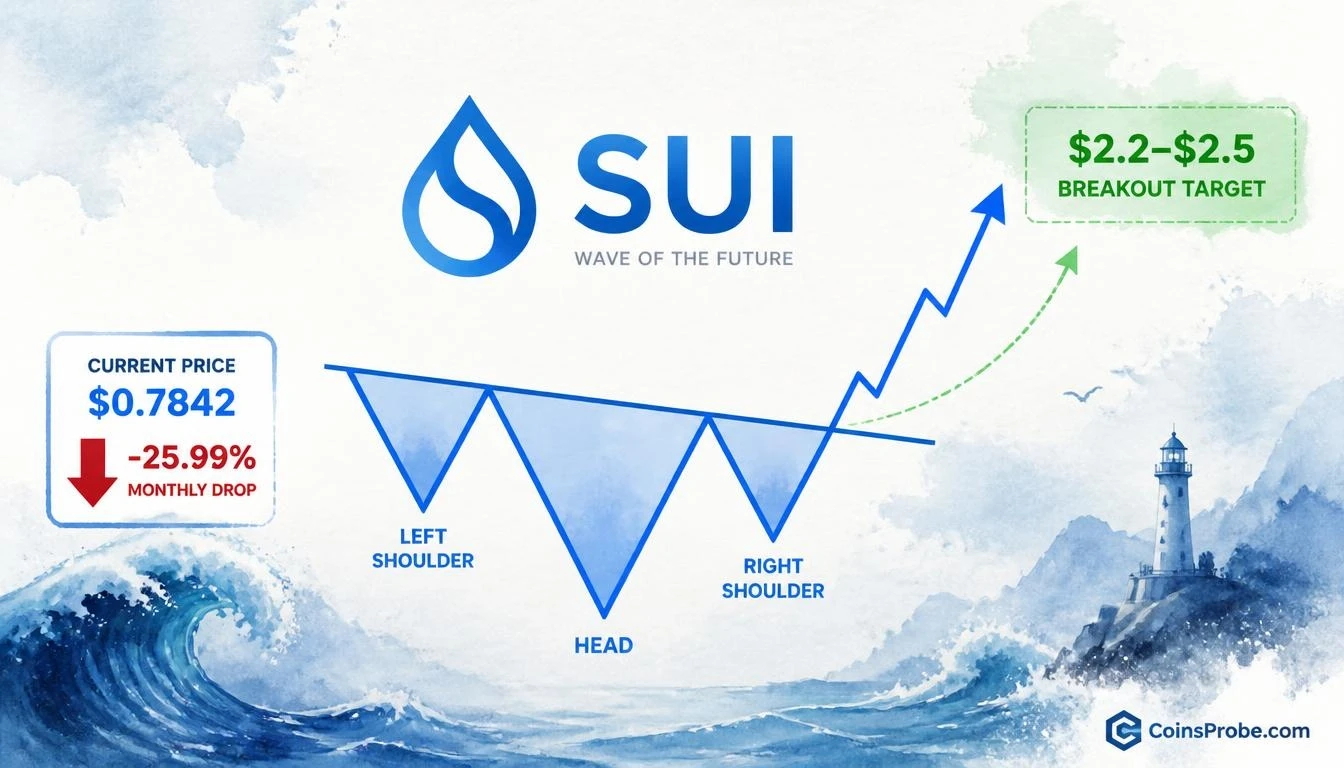
One analyst flagged the formation directly on November 12, 2026, identifying what they describe as a potential inverse Head & Shoulders on the SUI daily chart on Binance, with a breakout target zone of $2.2–$2.5. The pattern has not yet completed — price remains below the neckline — but the structural setup is becoming identifiable at the right shoulder formation stage.
Signal — Inverse Head & Shoulders on the Daily Chart
An inverse Head & Shoulders is a bottoming reversal pattern characterized by three troughs: a deeper central trough (the head) flanked by two shallower troughs (the shoulders). A neckline connects the two intervening peaks. The pattern is not confirmed until price closes above the neckline with conviction — until that happens, it remains a developing structure.
On the SUI daily chart, the three-trough structure is visible. The deepest trough formed near the $0.64 zone — the head. Two flanking troughs at shallower levels form the shoulders. The neckline is downward-sloping, descending from approximately the $1.45 level toward the $1.25 zone. At the time of writing, SUI at $0.7842 sits well beneath the neckline, placing the pattern firmly in the still-forming stage. The analyst identifies this as the right shoulder formation zone.
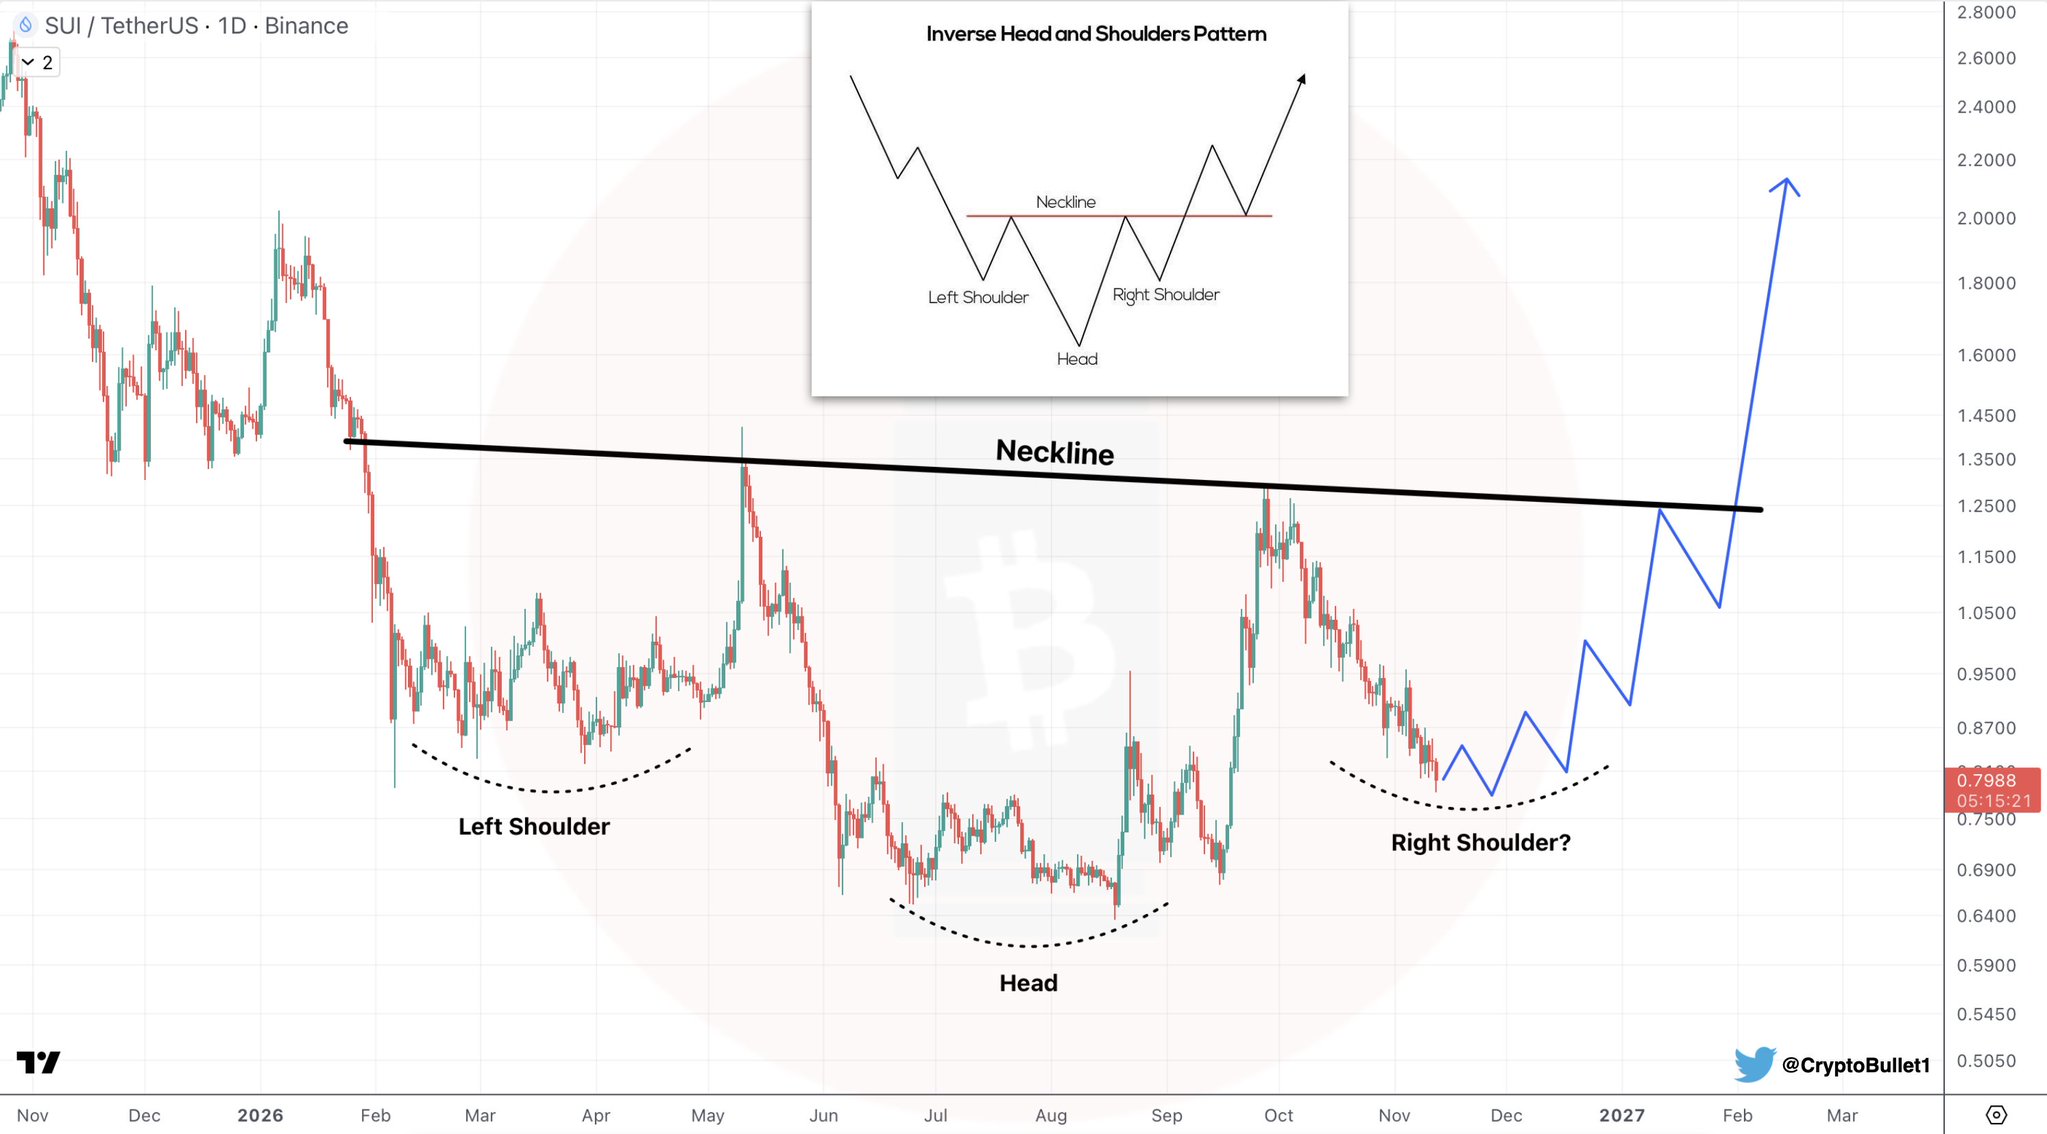
The projected breakout trajectory — drawn in blue on the chart — targets the $2.2–$2.5 zone, representing a potential move of approximately +180% to +219% from current levels if the neckline is reclaimed and the pattern measures to target. This is a measured-move projection based on the depth from neckline to head, applied upward from the breakout point — a standard inverse H&S calculation methodology.
Where SUI Stands Now — Pattern Still Forming
The critical distinction here is timing. This is not a breakout confirmation article. The neckline — sloping from roughly $1.45 down toward $1.25 — has not been tested from below yet. SUI must first recover toward and through that neckline level, then sustain a close above it, before the inverse H&S is technically triggered. Right now, price is in the right shoulder zone near $0.7842, which is a constructive location structurally — but confirmation remains ahead.
The 25.99% thirty-day decline that brought SUI to this level is precisely the kind of price action that forms right shoulder structures in potential bottoming patterns. Sellers who dominated the past month may be exhausting their pressure at a structurally significant location. Whether that’s the case will only be confirmed by what happens at and above the neckline.
On-Chain Context — SUI Network Fundamentals
SUI’s on-chain data from DeFiLlama shows the network carrying $394.55 million in total value locked, with $19.42 million in 24-hour DEX volume and $133.58 million in seven-day DEX volume. The network generated $146,000 in fees over the past 24 hours and $724,700 over the past seven days. These are modest figures relative to the asset’s $3.25 billion market cap, but they confirm baseline activity continues.
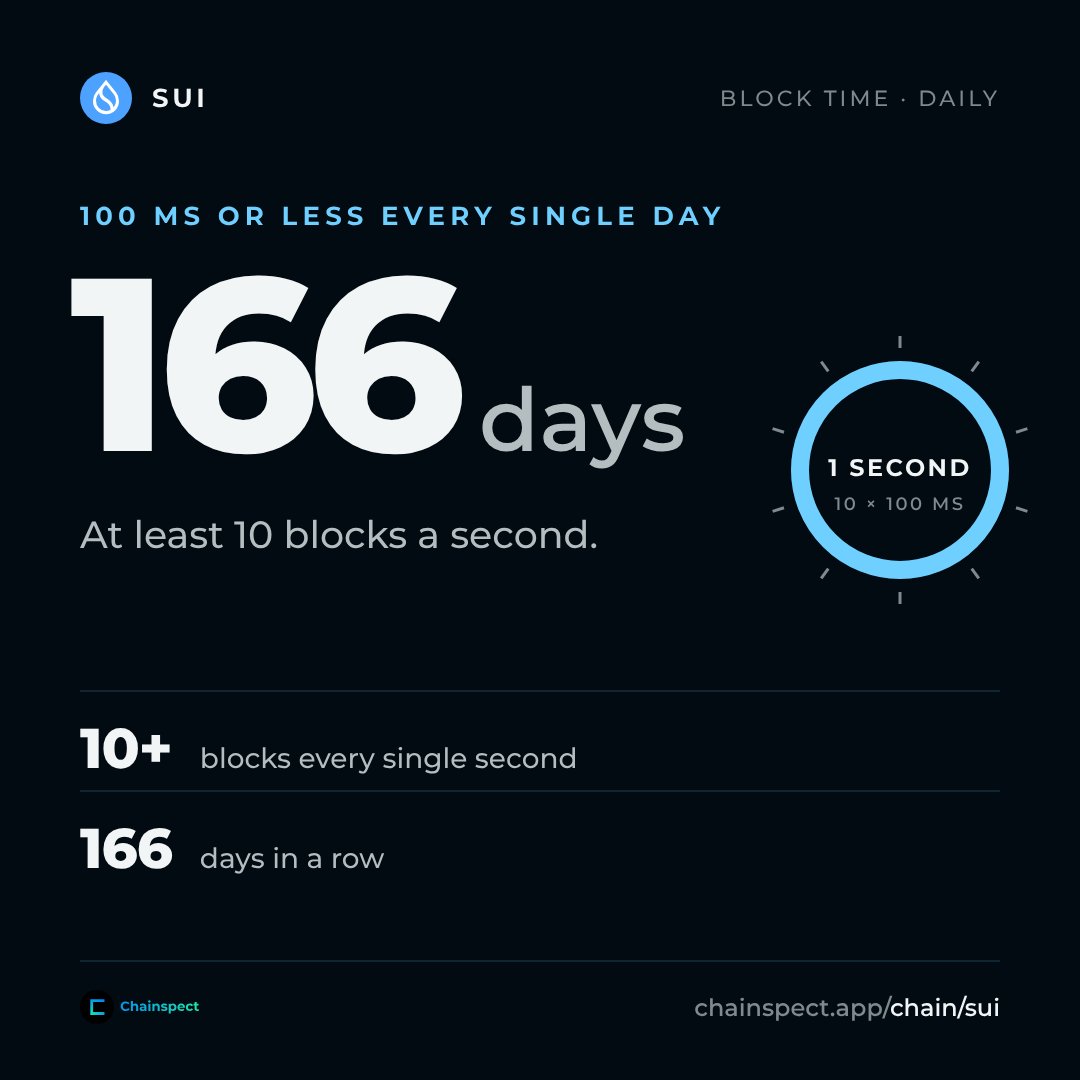
Developer and network-level activity adds further context. SUI Network has maintained 100-millisecond blocks or faster for 166 consecutive days per Chainspect — meaning at least 10 blocks per second sustained over that entire period. This kind of infrastructure consistency matters when evaluating whether a network can support renewed demand if price recovers. The technical foundation is active even as the token price corrects.
Macro Backdrop
The timing of this pattern formation coincides with a dense macro calendar. PPI releases November 13, Retail Sales on November 17, and both GDP and PCE on November 25. These events create binary volatility windows for risk assets including crypto. For a pattern still in the formation stage, macro shock risk is real — a sharp equity selloff or inflation surprise ahead of a neckline test could reset the right shoulder lower. Conversely, a soft PPI and benign retail data print could provide the liquidity backdrop a breakout requires. Traders watching this SUI setup should track those dates as potential catalysts in either direction.
SUI’s technical setup shares the broader altcoin risk environment. XRP has similarly reversed recent gains, with its own key structural level defining the near-term thesis. AAVE has entered a defined buying zone after a 29% monthly drop — a comparable magnitude of correction to SUI’s current drawdown.
Key Levels to Watch
Three levels define the trade structure on the current setup:
- $0.64 zone — The head of the pattern. A breach back to this level would damage the right shoulder structure and call the formation into question.
- $1.25–$1.45 — The neckline range (sloping downward). A sustained daily close above this zone is the confirmation event the analyst is watching for.
- $2.2–$2.5 — The analyst’s stated breakout target, derived from the measured-move projection of the inverse H&S depth applied from the neckline upward.
Bullish Scenario
SUI recovers from the right shoulder zone, advances through the $1.25–$1.45 neckline with a confirmed daily close above it, and the measured-move projection activates. The analyst’s stated target of $2.2–$2.5 becomes the primary objective — a +180% to +219% advance from current levels of $0.7842.
Bearish Scenario
Failure to hold the right shoulder structure, with a breakdown back toward the $0.64 head zone, would invalidate the inverse H&S formation entirely. In that case, the pattern reverts to a continuation of the existing downtrend rather than a reversal signal.
The inverse Head & Shoulders on SUI’s daily chart is a developing setup, not a confirmed breakout. Price at $0.7842 sits in the right shoulder formation zone — structurally constructive but requiring a neckline reclaim in the $1.25–$1.45 band to confirm the reversal thesis. The analyst’s $2.2–$2.5 target is the measured-move projection if that neckline is broken with conviction. Watch the neckline — a sustained daily close above $1.25 is the first requirement before any target discussion becomes relevant.
Source: x.com
Frequently Asked Questions
What is an inverse Head and Shoulders pattern and why does it matter for SUI?
What price must SUI reclaim to confirm the inverse Head and Shoulders breakout?
What is the analyst’s price target if SUI breaks out of this pattern?
What would invalidate the SUI inverse Head and Shoulders setup?
Source: Cryptobullet1 · Published by CoinsProbe Markets Desk
The opinions and market insights shared on CoinsProbe represent the views of individual authors based on prevailing market conditions at the time of publication. Cryptocurrency investments carry significant risk and volatility. Readers are encouraged to conduct their own research and seek professional financial advice before making investment decisions. CoinsProbe and its contributors do not accept responsibility for financial losses or decisions made based on published content.
CoinsProbe may publish sponsored articles, affiliate links, or promotional collaborations. All sponsored material is clearly labeled to maintain transparency with our audience. Our editorial decisions remain fully independent, and advertising partnerships do not influence reviews, rankings, or published opinions.
Since 2023, CoinsProbe has delivered reliable insights on cryptocurrency, blockchain, and digital assets. Our content is created by experienced researchers and analysts who follow strict editorial standards focused on accuracy, transparency, and credibility. Every article is carefully reviewed and verified using trusted sources and current market data. We provide unbiased analysis and timely updates covering everything from emerging crypto projects to major industry developments.