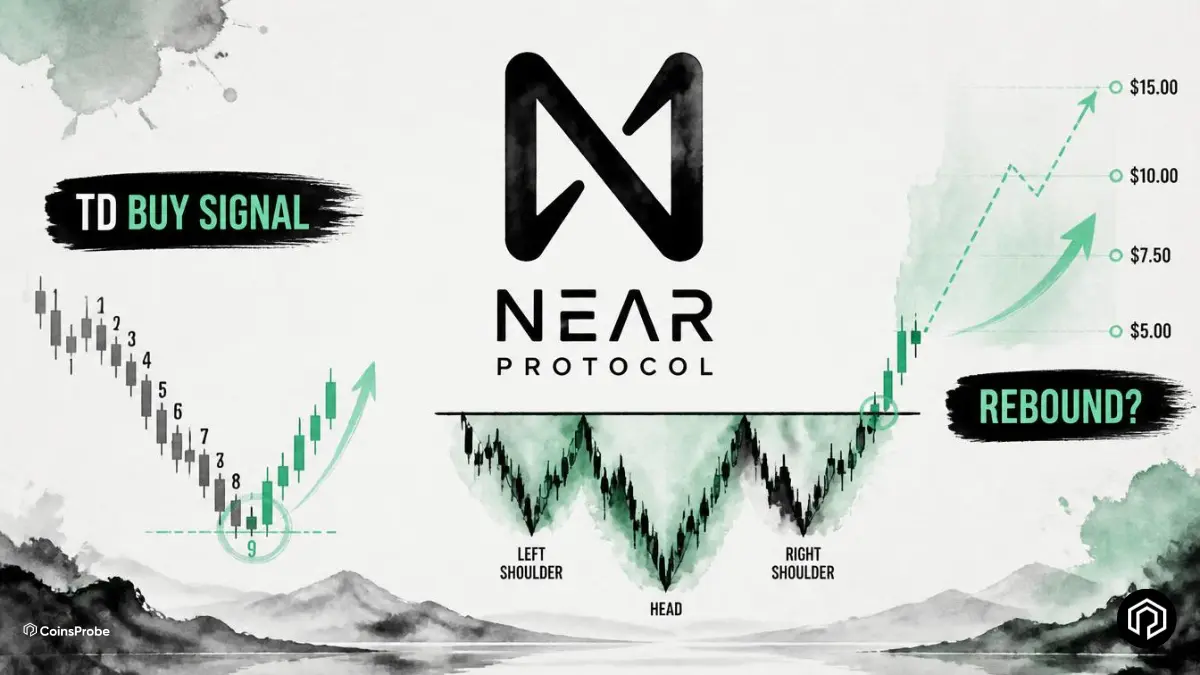
- A TD Sequential buy signal has appeared on the daily chart, hinting at a potential trend reversal.
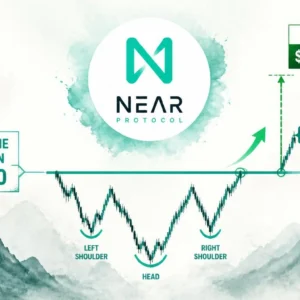
- The weekly chart is forming an inverse head and shoulders, with $2.88 as the key upside target.
- A drop below $1.23 would invalidate the bullish setup.
NEAR Protocol is showing the same TD Sequential buy signal that @alicharts has been tracking on the daily chart through multiple prior turning points — and this time it is arriving at the lowest price level in the current sequence, with the weekly chart simultaneously building an inverse head and shoulders structure that provides a longer-term recovery framework if the signal holds.
NEAR is trading at $1.65 — up +4.28% in 24 hours — with a market cap of approximately $2.14 billion. Despite today’s recovery, NEAR remains under pressure on a 7-day (-12.34%) and 30-day (-7.16%) basis — reflecting the sustained selling that has brought the token to its current levels from the higher price zones visible earlier in the chart sequence.

TD Sequential Buy Signal on the Daily Chart
Analyst @alicharts has identified a TD Sequential buy signal on NEAR’s daily chart — the same indicator whose prior signals on this specific chart have been tracked with documented outcomes.
Reading the @alicharts daily chart:
The chart shows the full sequence of prior TD Sequential signals and their subsequent price outcomes — providing historical context for interpreting the current signal:
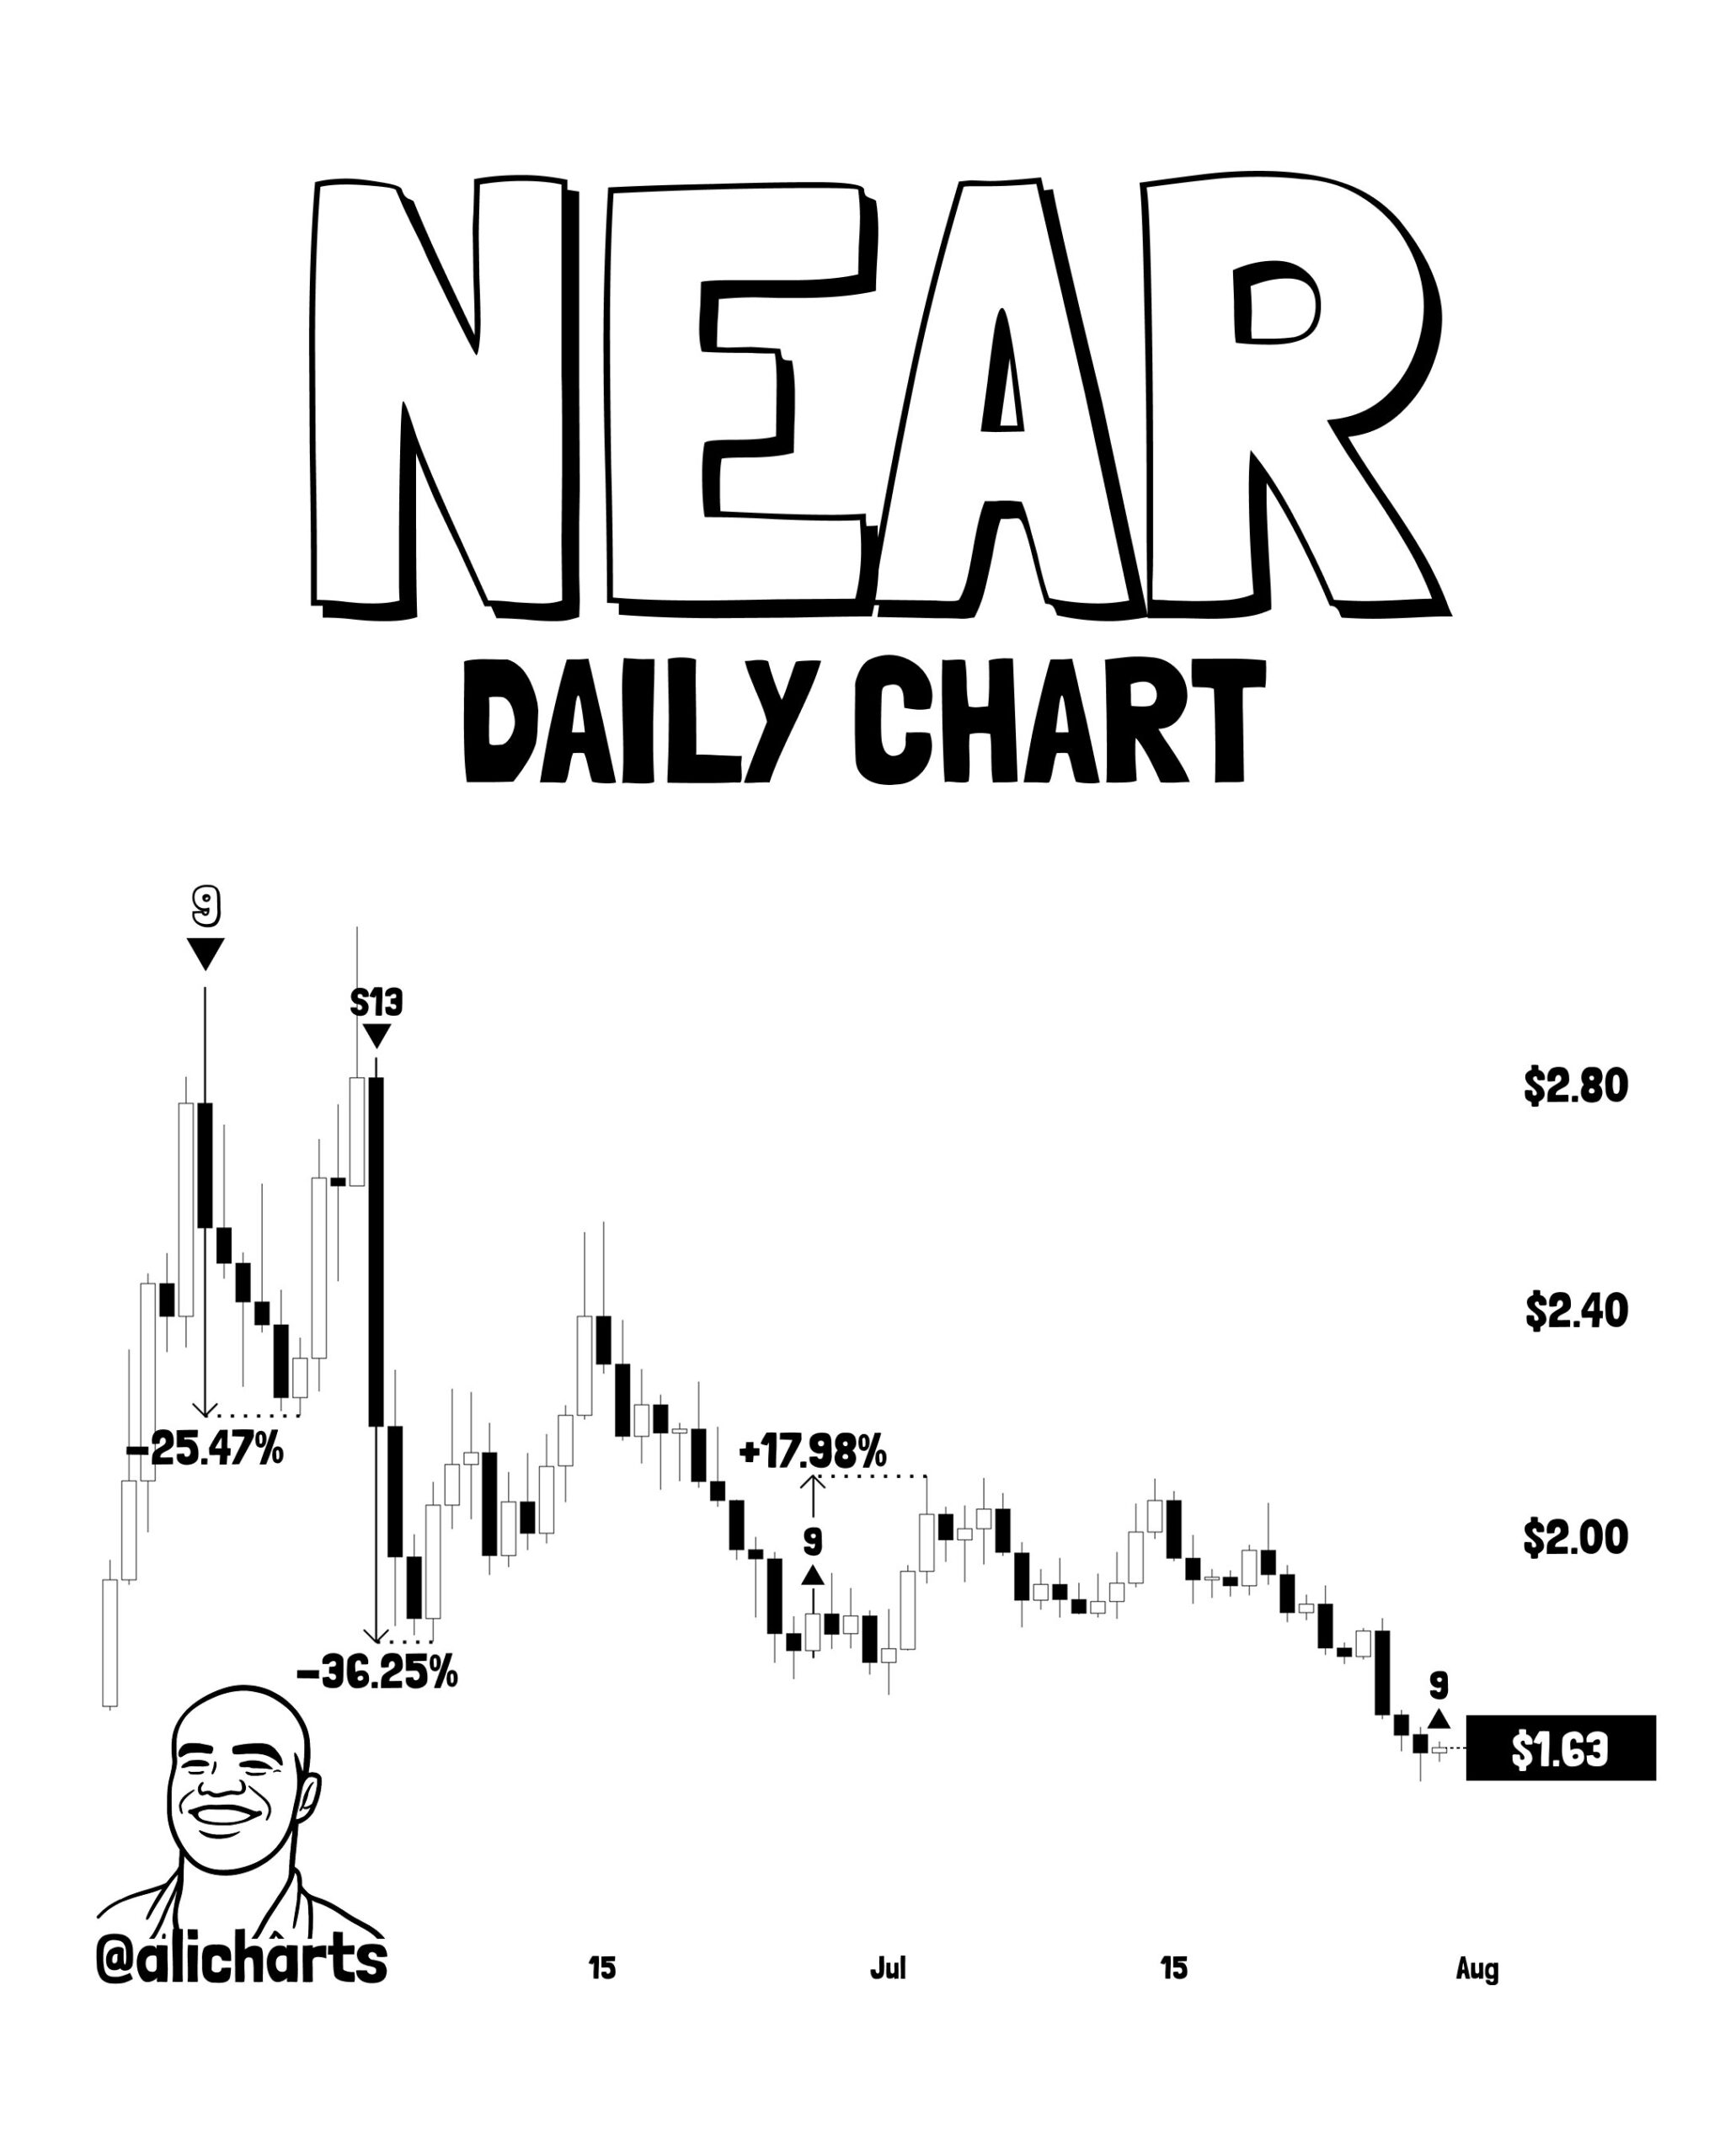
The prior buy signal in early July — which produced a +17.98% bounce — is the most directly comparable precedent for the current signal. Both are buy signals appearing after extended declines, at progressively lower price levels, with the current one appearing at $1.63 — the lowest level in the sequence visible on the chart.
What the TD Sequential buy signal means:
The TD Sequential buy signal (count of 9) identifies a point of potential trend exhaustion on the downside — where the sequence of lower closes has run its statistical course and a reversal becomes more probable. As we covered in our DOGE 4-timeframe TD Sequential article — these signals are most reliable when appearing after extended downtrends, which NEAR’s current position following weeks of consistent selling directly reflects.
The signal does not guarantee a specific price outcome — as the prior sell signals on this same chart correctly identified both the -25.47% and -36.25% corrections, the indicator has demonstrated accuracy on this specific asset that adds weight to the current buy signal appearing at $1.63.
Weekly Inverse Head and Shoulders
On the weekly timeframe, NEAR is developing a structural pattern that provides a longer-term recovery framework if the daily TD Sequential signal holds and price follows through:
The inverse head and shoulders pattern:
An inverse head and shoulders is a bullish reversal pattern defined by three successive lows — a left shoulder, a deeper head, and a right shoulder (higher than the head) — connected by a neckline at the highs between the three troughs. When price breaks above the neckline, the pattern projects a measured move equal to the distance from the head to the neckline, applied above the breakout point.
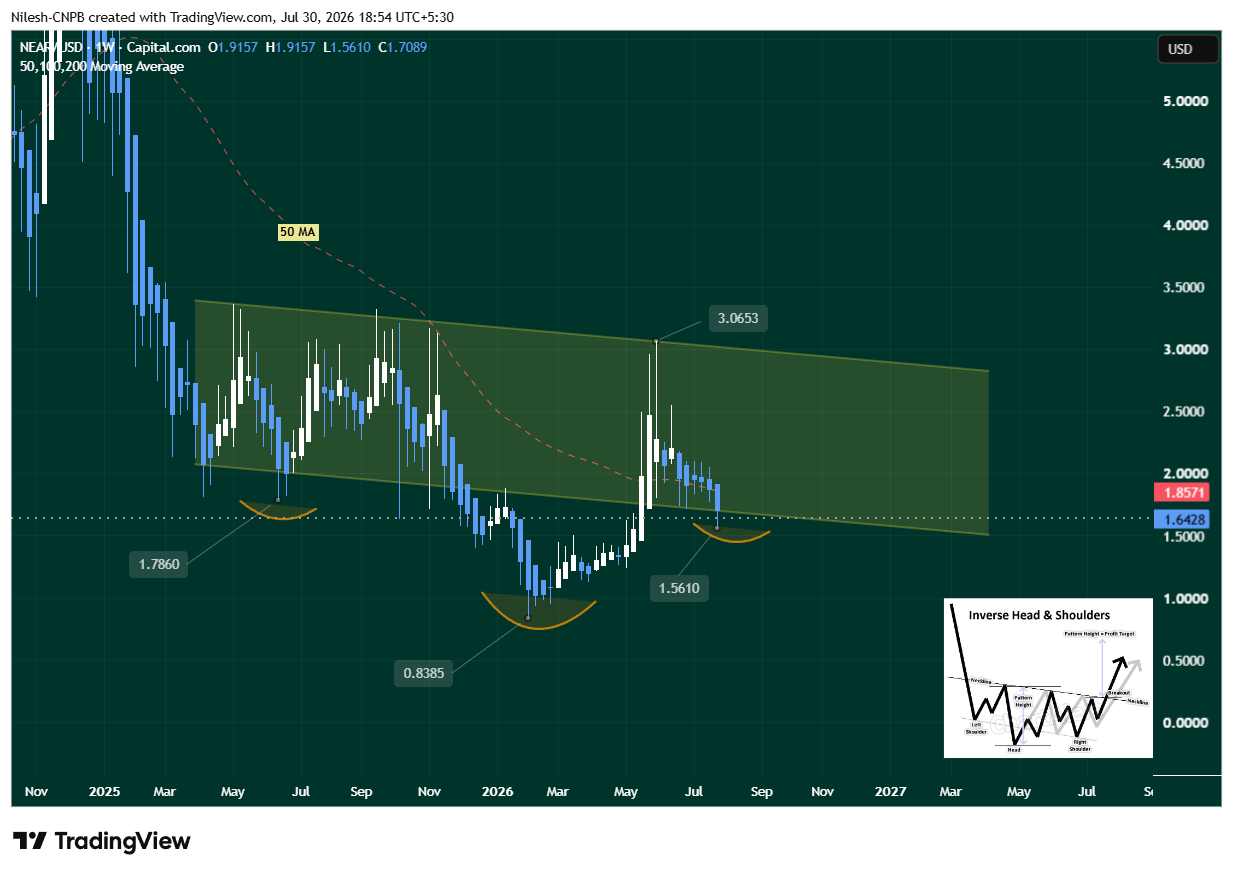
NEAR’s current pattern stage:
The right shoulder low appears to be forming near $1.5610 — the level that has been providing the near-term floor during the current decline. The current bounce to $1.63 represents the early stages of the right shoulder recovery.
The sequential confirmation levels:
Step 1 — Reclaim the 50 MA at $1.8571:
Before the neckline becomes relevant, NEAR needs to reclaim the 50-day moving average at approximately $1.8571. This moving average reclaim is the first meaningful technical confirmation that the right shoulder is forming constructively rather than failing — and it represents approximately +13.9% upside from the current $1.63 level.
Step 2 — Test the neckline at $2.88:
A sustained move above the 50 MA would open the path toward the inverse head and shoulders neckline around $2.88 — the level whose breakout would confirm the broader pattern. From the current price of $1.63, reaching $2.88 represents approximately +76.7% upside.
Step 3 — Confirmed neckline breakout:
A confirmed breakout above $2.88 — ideally on elevated weekly volume — would fully activate the inverse head and shoulders pattern and project the measured move target above that level based on the pattern’s depth.
Bullish Scenario — 50 MA Reclaim and Neckline Test
The TD Sequential buy signal at $1.63 holds — price sustains above the right shoulder low at $1.5610 and begins building toward the 50 MA at $1.8571. A confirmed reclaim of the 50 MA shifts the weekly momentum from bearish to neutral-to-bullish and opens the path toward the $2.88 neckline as the inverse head and shoulders continues to develop. This scenario mirrors the prior TD Sequential buy signal that produced the +17.98% bounce from the early July low.
Bearish Scenario — Below $1.23
A sustained decline below $1.23 would invalidate the inverse head and shoulders setup entirely — breaking below the structural level that defines the right shoulder and confirming that the pattern has failed rather than resolved. In this scenario the weekly recovery thesis requires a complete reset to a lower price structure.
Bottom Line
NEAR’s today’s +4.28% bounce to $1.63 arrives with two specific technical signals supporting the recovery thesis — a TD Sequential buy signal on the daily chart whose prior occurrences on this same asset have tracked accurately, and a developing inverse head and shoulders on the weekly chart whose right shoulder low is forming near $1.5610.
The recovery path is sequential and level-based: $1.5610 must hold as the right shoulder floor, $1.8571 (50 MA) is the first confirmation gate, and $2.88 (neckline) is the full pattern target. The invalidation is equally clear at $1.23 — the level below which the pattern structure fails.
Watch whether today’s TD Sequential buy signal develops follow-through in the sessions ahead — the prior signal at the equivalent stage produced +17.98%. Whether the current signal at $1.63 can match or exceed that outcome will be the near-term test of the recovery thesis.
Frequently Asked Questions (FAQ)
Is NEAR good for the rest of 2026?
NEAR has shown resilience with a fresh TD Sequential buy signal and a developing inverse head and shoulders pattern. While short-term recovery looks promising if key levels are reclaimed, its performance for the rest of 2026 will depend on broader market conditions, adoption of its AI and chain abstraction features, and overall crypto sentiment.
What is NEAR Protocol known for?
NEAR is a high-performance Layer-1 blockchain focused on scalability, usability, and chain abstraction, with growing emphasis on AI-related applications and simplified cross-chain experiences.
The opinions and market insights shared on CoinsProbe represent the views of individual authors based on prevailing market conditions at the time of publication. Cryptocurrency investments carry significant risk and volatility. Readers are encouraged to conduct their own research and seek professional financial advice before making investment decisions. CoinsProbe and its contributors do not accept responsibility for financial losses or decisions made based on published content.
CoinsProbe may publish sponsored articles, affiliate links, or promotional collaborations. All sponsored material is clearly labeled to maintain transparency with our audience. Our editorial decisions remain fully independent, and advertising partnerships do not influence reviews, rankings, or published opinions.
Since 2023, CoinsProbe has delivered reliable insights on cryptocurrency, blockchain, and digital assets. Our content is created by experienced researchers and analysts who follow strict editorial standards focused on accuracy, transparency, and credibility. Every article is carefully reviewed and verified using trusted sources and current market data. We provide unbiased analysis and timely updates covering everything from emerging crypto projects to major industry developments.