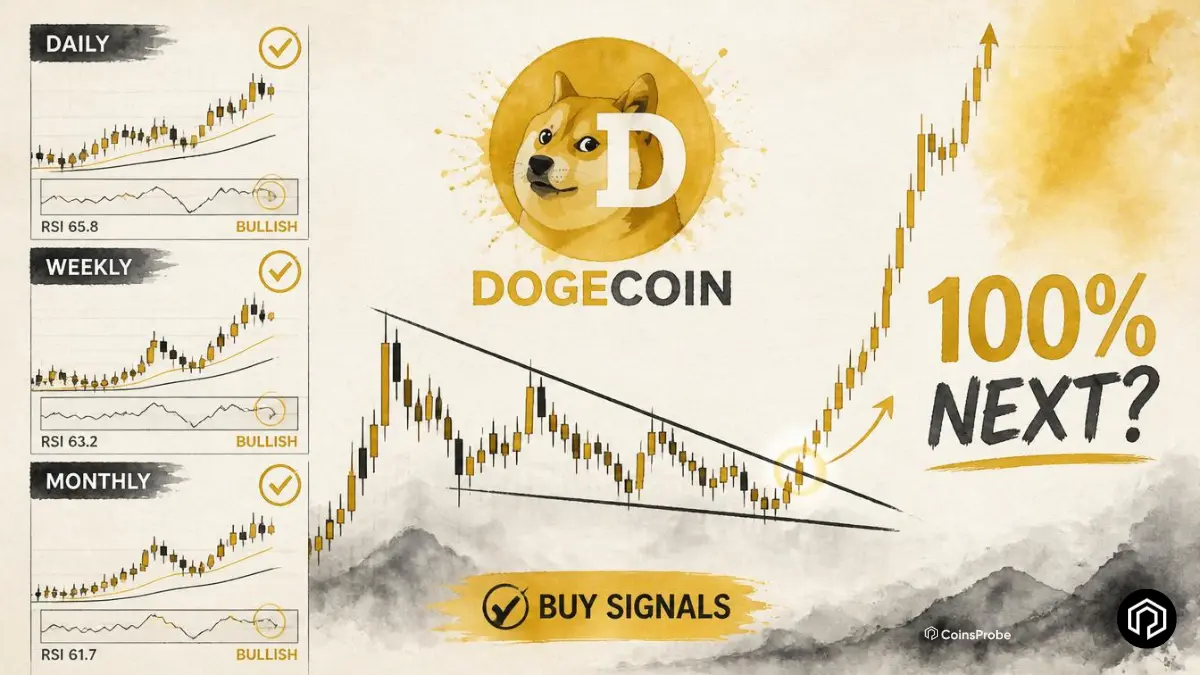

- TD Sequential buy signals have appeared across the monthly, weekly, 3-day, and daily charts, pointing to potential seller exhaustion.
- A falling wedge could target $0.0925, $0.1186, and $0.1516, implying over 100% upside if the setup plays out.
- SHIB’s 17% weekly gain signals renewed momentum across the broader memecoin sector.
Dogecoin is setting up a technical case that is more specific and multi-layered than most memecoin recoveries — a genuinely rare alignment of TD Sequential buy signals across four separate timeframes, arriving simultaneously while a falling wedge pattern bounces from its lower support boundary. Whether that translates into a confirmed breakout or simply a better-informed accumulation window is what the coming sessions will determine.
DOGE is trading near $0.0726 — up +0.85% over 7 days — with a market cap of approximately $11.27 billion. Despite the modest weekly recovery, DOGE remains -38% year-to-date and approximately -90% below its all-time high — reflecting the sustained pressure the broader memecoin sector has faced throughout 2026.

The Broader Context — Memecoins Finding Stability
After months of double-digit losses across the memecoin sector, early signs of stabilisation are emerging. Shiba Inu (SHIB) is the clearest expression of this, posting approximately +17% over the past 7 days — outpacing DOGE’s more modest recovery and suggesting that risk appetite is returning to the memecoin space more broadly.
DOGE and SHIB tend to move in the same directional current — when one shows strength, it often reflects a broader shift in retail and speculative sentiment toward the memecoin category rather than a token-specific catalyst. SHIB’s stronger near-term performance provides the sector-level context within which DOGE’s technical setup is developing.
Signal 1 — A Rare 4-Timeframe TD Sequential Alignment
Technical analyst @alicharts flagged one of the more unusual technical developments visible on DOGE’s charts right now. The TD Sequential indicator — which counts a specific sequence of candles to identify points of trend exhaustion — has fired buy signals simultaneously across four separate timeframes:
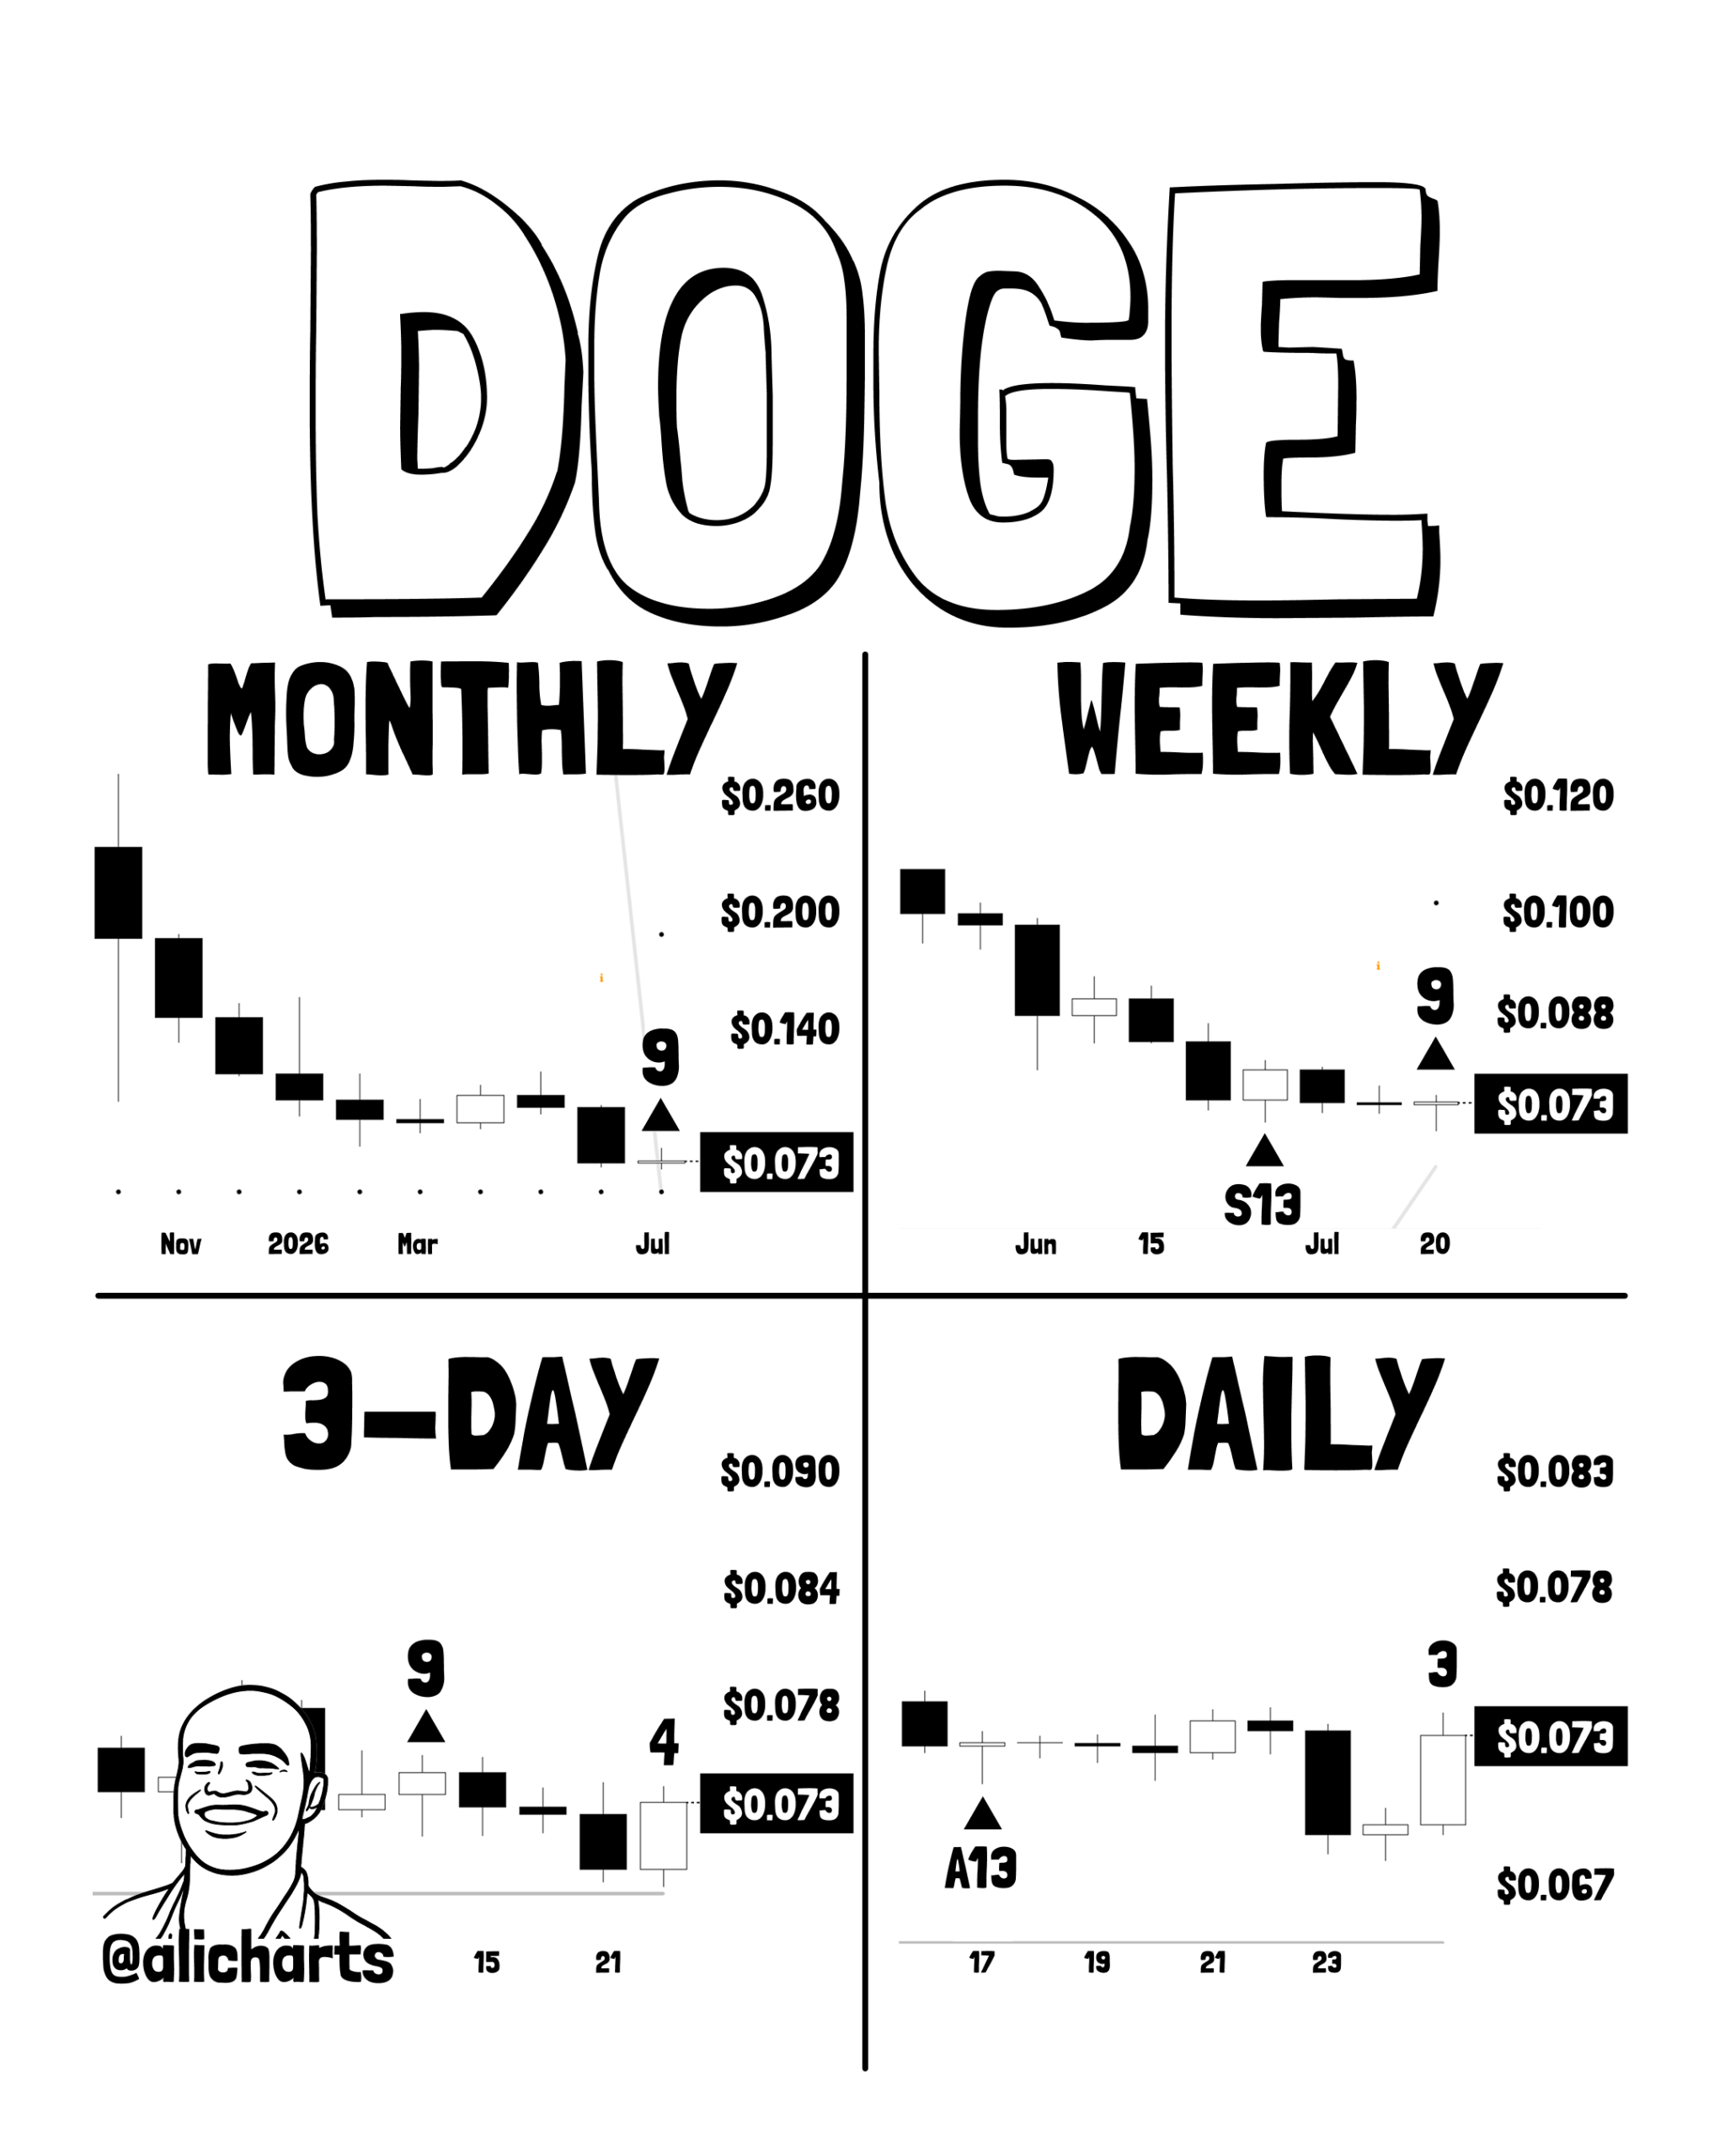
@alicharts framed the significance directly:
“Dogecoin $DOGE is screaming BULLISH! The TD Sequential has flashed buy signals on the monthly, weekly, 3-day, and daily charts. It’s rare to see this kind of alignment across so many timeframes at once.”
Why multi-timeframe TD Sequential alignment matters:
On any individual timeframe, a TD Sequential buy signal identifies a point of potential trend exhaustion — where selling pressure has statistically run its course and a reversal becomes more probable. On the daily chart alone, this typically points to a 1–4 day bounce. On the weekly or monthly chart, the signal is far rarer and has historically pointed to more sustained directional shifts.
When all four timeframes fire simultaneously — daily, 3-day, weekly, and monthly — it means the exhaustion signal is appearing at every level of analysis at once. The daily signal says short-term sellers may be done. The weekly says medium-term sellers may be done. The monthly says long-term sellers may be done. This convergence across all four is what makes the current setup genuinely unusual rather than a routine technical observation.
As we covered in our Ethereum monthly TD Sequential buy signal article — the monthly TD Sequential on ETH was the same indicator that preceded +235% and +182% expansions in prior instances. The monthly signal alone carries significant historical weight — seeing it confirmed simultaneously on three additional timeframes adds meaningful further conviction.
Signal 2 — Falling Wedge With 100% Potential
On the daily chart, DOGE is forming a falling wedge — one of the most reliably bullish reversal patterns in technical analysis when it appears after an extended downtrend.
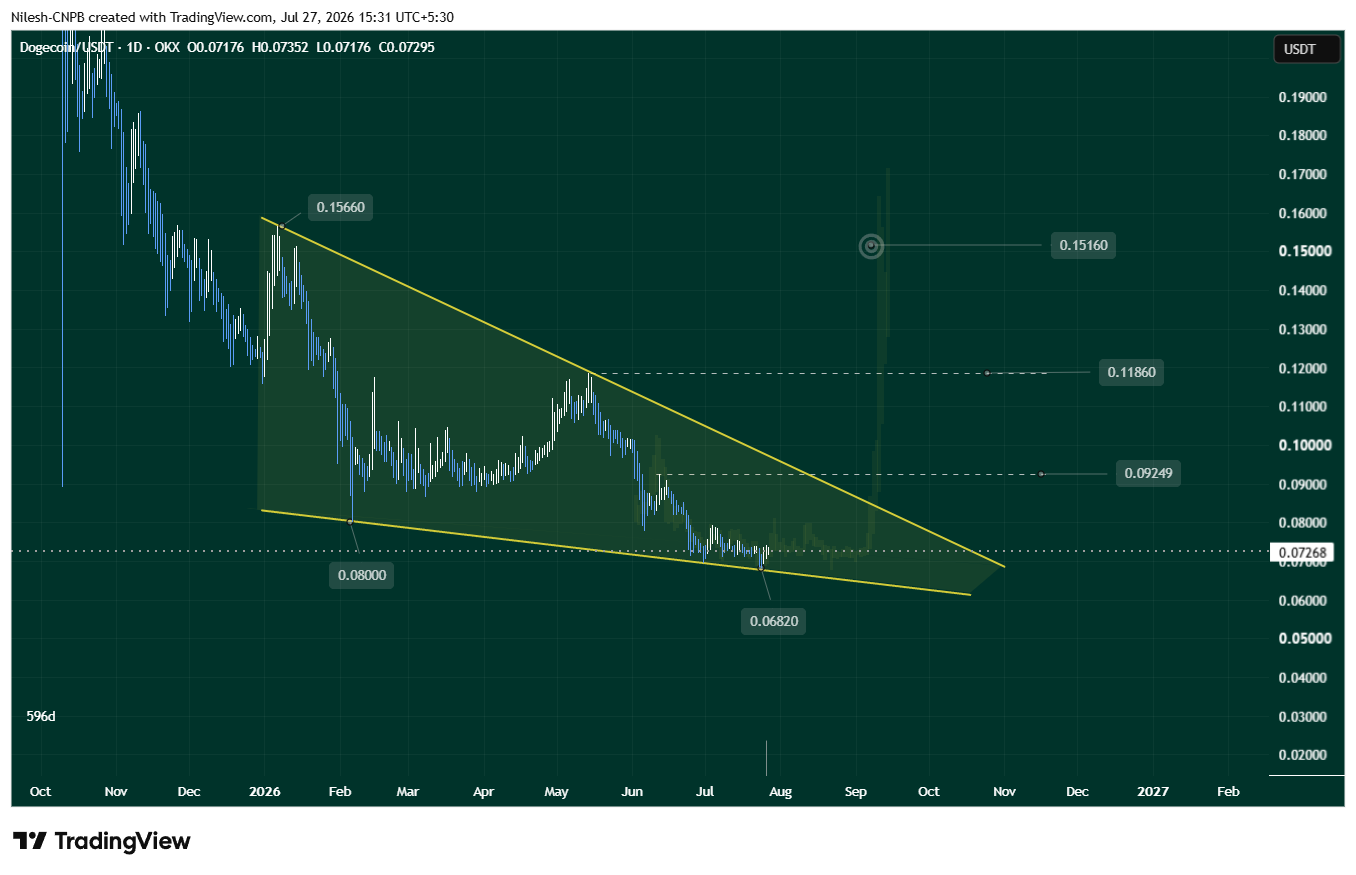
DOGE’s current position within the wedge:
Price recently bounced from the lower support trendline near $0.06820 — holding above it at the current level of approximately $0.07267. As long as this support remains intact, the falling wedge structure is valid and the bullish interpretation holds.
The three upside breakout targets:
| Target | Level | Upside From Current |
|---|---|---|
| Near-term resistance | $0.09249 | ~+27% |
| Intermediate target | $0.1186 | ~+63% |
| Full measured target | $0.1516 | ~+108% |
The $0.1516 full measured target — representing more than 100% potential upside from current levels — is calculated using the standard falling wedge measured move methodology, which projects the height of the pattern’s widest point above the breakout level.
The invalidation:
A daily close below the lower support trendline near $0.06820 would invalidate the falling wedge structure and could open the door to further downside. This level is the specific threshold that distinguishes the current accumulation phase from a continued decline — and it is the most important level to monitor for anyone considering the bullish thesis.
Why Both Signals Together Matter
The specific combination of the 4-timeframe TD Sequential alignment and the falling wedge bouncing from lower support creates a more complete picture than either signal would provide independently.
The TD Sequential signals measure momentum exhaustion — they identify when selling pressure has run its statistical course across multiple timeframes simultaneously. The falling wedge measures price structure — it provides the specific level-based framework for where the recovery begins ($0.06820 support) and where it targets ($0.09249, $0.1186, $0.1516).
Together they describe the same underlying dynamic from two different analytical frameworks: the selling that produced DOGE’s -38% YTD decline and its -90% drawdown from the ATH may be approaching exhaustion, and the price structure is forming the pattern that historically precedes a relief recovery — if the lower support holds and a breakout above the upper descending trendline confirms.
What Confirmation Looks Like
Two specific events would elevate the current setup from potential to confirmed:
Volume expansion on upward moves — A breakout from the falling wedge’s upper trendline accompanied by meaningfully elevated volume would confirm that genuine buying conviction is behind the move rather than low-liquidity drifting.
A sustained daily close above the upper descending trendline — The specific price action confirmation that the falling wedge has resolved to the upside and the pattern’s measured moves are activated.
Until both occur, the $0.068–$0.073 zone remains the key short-term battleground — the lower boundary of the accumulation phase within the wedge, where the bullish thesis is either confirmed by support holding or invalidated by a close below $0.06820.
Bottom Line
Dogecoin is presenting a rare and specific technical setup — a 4-timeframe TD Sequential buy signal convergence arriving simultaneously with a falling wedge bouncing from lower support — within a broader context of memecoin sector stabilisation led by SHIB’s +17% weekly move.
The full measured target at $0.1516 represents more than 100% upside from current levels — but it requires a confirmed breakout above the upper wedge trendline to activate. The immediate focus is on $0.06820 holding as support, then a volume-confirmed close above the upper trendline that would put the three sequential targets in play.
Watch the support. Watch the trendline. And watch whether the 4-timeframe TD Sequential signals translate into the same kind of sustained recovery they have historically produced at comparable exhaustion points on the monthly chart.
Frequently Asked Questions
What is the TD Sequential buy signal showing for DOGE?
The TD Sequential has fired buy signals simultaneously on four timeframes — monthly, weekly, 3-day, and daily — a rare multi-timeframe alignment that analyst @alicharts identifies as a signal of potential seller exhaustion after DOGE’s extended downtrend.
Is Dogecoin (DOGE) good for the rest of 2026?
It has a bullish falling wedge + multi-timeframe buy signals that could push it toward $0.15 (+100%), but it remains highly speculative and dependent on Bitcoin and overall market sentiment.
The opinions and market insights shared on CoinsProbe represent the views of individual authors based on prevailing market conditions at the time of publication. Cryptocurrency investments carry significant risk and volatility. Readers are encouraged to conduct their own research and seek professional financial advice before making investment decisions. CoinsProbe and its contributors do not accept responsibility for financial losses or decisions made based on published content.
CoinsProbe may publish sponsored articles, affiliate links, or promotional collaborations. All sponsored material is clearly labeled to maintain transparency with our audience. Our editorial decisions remain fully independent, and advertising partnerships do not influence reviews, rankings, or published opinions.
Since 2023, CoinsProbe has delivered reliable insights on cryptocurrency, blockchain, and digital assets. Our content is created by experienced researchers and analysts who follow strict editorial standards focused on accuracy, transparency, and credibility. Every article is carefully reviewed and verified using trusted sources and current market data. We provide unbiased analysis and timely updates covering everything from emerging crypto projects to major industry developments.