

- NEAR is trading at $3.70 — down 26.08% in 30 days — after a 39.42% decline from the October $6.00 high
- TD Sequential '9' buy signal printed on the daily chart at $3.72 — the same indicator that called the top via Sequential Aggressive 13 on October 12
- First rebound target is $4.30; setup resistance trendline sits at $4.80 — a close above $4.30 is needed to validate the thesis
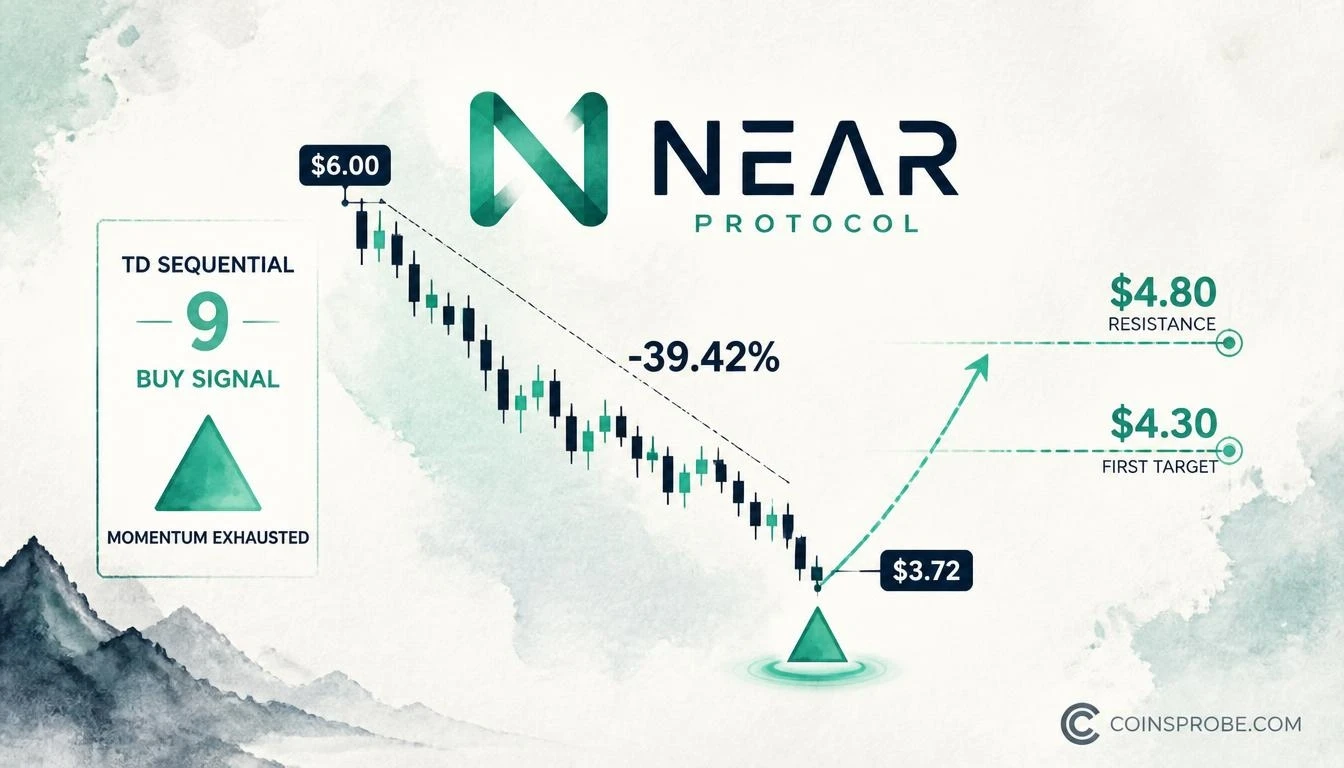
NEAR Protocol is trading at $3.70 — down 6.23% in 24 hours, 13.20% over seven days, and 26.08% over the past 30 days — with a market cap of $4.85 billion. After shedding 39.42% from its October peak of $6.00 to a dotted support reference near $3.72, the daily chart has now printed a TD Sequential “9” buy signal. That is the same indicator that called the top of the prior move before the correction began.
An analyst who covers momentum signals on the NEAR daily chart flagged the setup on November 6, 2026, writing: “While the broader market remains under pressure, the TD Sequential has flashed a buy signal on $NEAR daily chart. This indicator recently anticipated a major trend shift. On October 12, it flashed a Sequential Aggressive 13” — a signal that preceded the 39.42% decline from $6.00 to $3.63. The same framework is now reading exhaustion to the downside.
The TD Sequential — What It Actually Measures
The TD Sequential counts nine consecutive daily closes in the same direction to identify momentum exhaustion — not a price level, not a support zone. A “9” buy signal means the market has closed lower for nine consecutive bars, reaching a statistical state where selling momentum is typically spent. It is a non-directional counter at its core: it marks exhaustion, not guaranteed reversal. The analyst’s prior application of this same indicator on NEAR was the Sequential Aggressive 13 on October 12 — a sell-side exhaustion count that correctly front-ran the 39.42% decline. The signal now appearing is the mirror-image count on the downside.
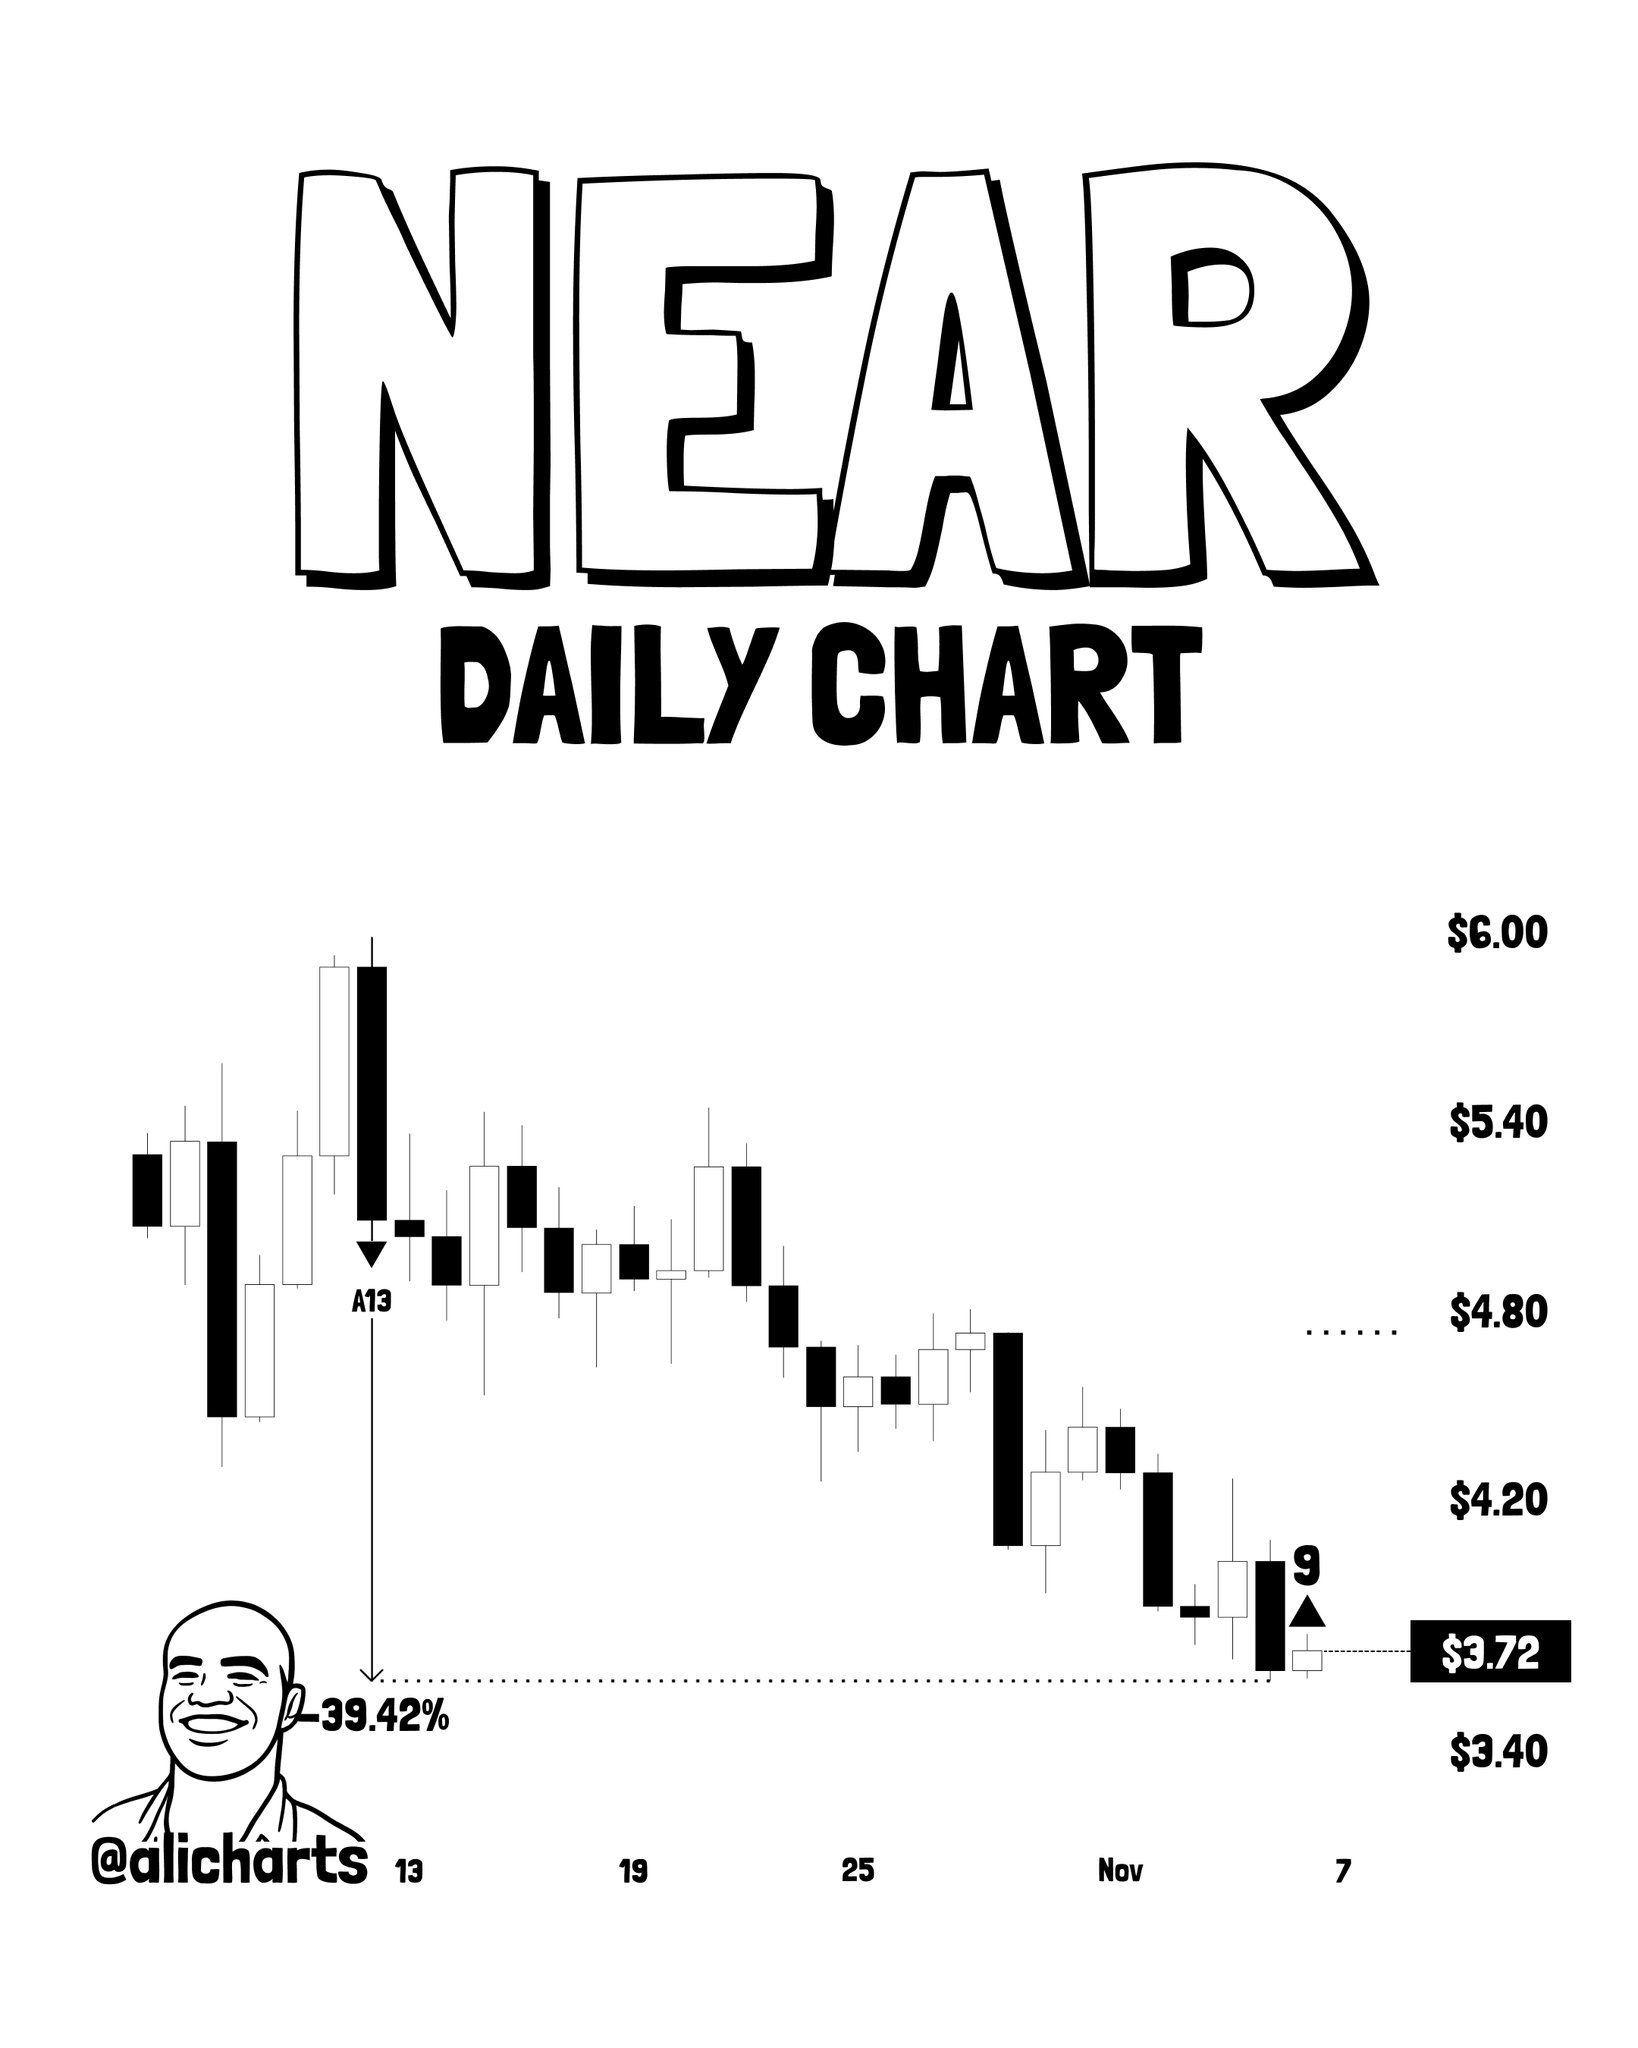
On the daily chart, the “9” count has completed with a small triangle (▲) printed beneath the most recent candles, with price sitting at the $3.72 horizontal dotted reference line — the level that marks the floor of the entire October–November decline. The chart labels visible across the decline: $6.00, $5.40, $4.80, $4.20, $3.72, $3.40 — a cascade of approximately $0.60 steps marking the structured nature of the selloff. The pattern status at time of writing is PATTERN STILL FORMING: the buy signal has printed, but no confirmed upside breakout above resistance is yet visible on the daily timeframe.
The Prior Signal — What It Said and What Followed
To assess the current signal, context from the prior count is essential. On October 12, the TD Sequential registered a Sequential Aggressive 13 — an extended exhaustion count that flags trend termination after a prolonged momentum run. NEAR was trading near $6.00 at that point. The 39.42% decline to $3.63 followed directly. That signal was not a coincidence — it was a measured count reaching its terminal state at the peak of a momentum move. The analyst’s credibility on this asset stems from that prior call. The current “9” count is a standard exhaustion signal, one step below the Aggressive 13 in intensity, but applied at what appears to be the structural low of the same correction the prior signal warned of.
NEAR had seen a dramatic run earlier in the cycle. Those interested in the protocol-level catalysts that drove the asset higher can review the full breakdown of the four catalysts behind NEAR’s 30-day 120% rally. The technical context also includes a key structural development: NEAR clearing four-year resistance and holding the backtest on the monthly chart — a level that now represents the broader structural framework within which this daily signal is occurring.
Targets — $4.30 and $4.80
The analyst identifies two levels for a potential rebound from the current buy signal. The first target is $4.30 — a recovery of approximately 16% from current price. The second level is the setup resistance trendline near $4.80, which represents the descending trendline that capped every rally attempt during the October–November correction. At $4.80, the asset would have recovered roughly 29.7% from the $3.70 print — returning to the zone where the decline began accelerating in late October.
These are rebound targets within the existing downtrend structure, not breakout targets. The $4.80 trendline resistance is the level that would need to be cleared with a sustained close above it to transition from “rebound” to “trend reversal” territory. At time of writing, that outcome has not occurred and no chart confirmation of such a breakout exists.
On-Chain Fundamentals — NEAR’s Protocol State
DeFiLlama data shows NEAR’s ecosystem TVL at $177.14 million, with 24-hour DEX volume of $140.18 million and seven-day DEX volume of $972.61 million — indicating that trading activity on-chain remains substantial even as price has corrected. Seven-day fees total $1.62 million. The 24-hour revenue figure is negligible at $0.0K, which reflects NEAR’s fee-distribution structure rather than zero protocol activity. For context on institutional participation, the Bitwise NEAR ETF launched on NYSE Arca earlier this year with $35.5 million in day-one inflows — a structural demand channel that did not exist in prior cycles.
The macro backdrop adds a layer of caution: Nonfarm Payrolls data dropped on November 6 — the same day this signal printed — with CPI due November 10 and PPI on November 13. Risk assets, including NEAR, remain sensitive to macro data in this environment. The broader market context the analyst referenced — “while the broader market remains under pressure” — aligns with this macro calendar. Any sustained rebound from the TD Sequential buy signal will need to contend with the macro data flow over the next two weeks.
What the Signal Says — and What It Doesn’t
The TD Sequential “9” buy signal confirms one thing with precision: downside momentum has reached a mathematically exhausted state after nine consecutive lower closes. It does not confirm that the bottom is in. It does not project magnitude of any rebound. It does not eliminate the possibility that price consolidates at current levels before the next directional move. The prior Sequential Aggressive 13 sell signal was followed immediately by a clean directional move — but that was a stronger, extended count. The current “9” is the standard version, which carries a lower historical completion rate than the Aggressive 13. One reply to the original post noted that the $4.30 first target depends on whether this count produces a flip — or a repeat of the prior exhaustion without a sustained recovery. That is the honest framing.
What to watch for continuation: a daily close above $4.30 would validate the rebound thesis and open the path toward the $4.80 trendline. What to watch for invalidation: a daily close materially below $3.63 — the prior low cited in the analyst’s research — would indicate the exhaustion count failed and the downtrend is extending.
The TD Sequential has a documented two-for-two track record on this specific NEAR move: the Aggressive 13 sell at $6.00 caught the top; the “9” buy at $3.72 is now flagging the potential bottom. Whether that becomes three-for-three will be answered at $4.30 and $4.80 in sessions ahead.
Frequently Asked Questions
What is the TD Sequential ‘9’ buy signal and why does it matter for NEAR?
What price levels must NEAR reclaim to confirm the rebound?
What would invalidate the TD Sequential buy signal on NEAR?
How does NEAR’s on-chain activity look during this price correction?
Source: Ali Charts · Published by CoinsProbe Markets Desk
The opinions and market insights shared on CoinsProbe represent the views of individual authors based on prevailing market conditions at the time of publication. Cryptocurrency investments carry significant risk and volatility. Readers are encouraged to conduct their own research and seek professional financial advice before making investment decisions. CoinsProbe and its contributors do not accept responsibility for financial losses or decisions made based on published content.
CoinsProbe may publish sponsored articles, affiliate links, or promotional collaborations. All sponsored material is clearly labeled to maintain transparency with our audience. Our editorial decisions remain fully independent, and advertising partnerships do not influence reviews, rankings, or published opinions.
Since 2023, CoinsProbe has delivered reliable insights on cryptocurrency, blockchain, and digital assets. Our content is created by experienced researchers and analysts who follow strict editorial standards focused on accuracy, transparency, and credibility. Every article is carefully reviewed and verified using trusted sources and current market data. We provide unbiased analysis and timely updates covering everything from emerging crypto projects to major industry developments.