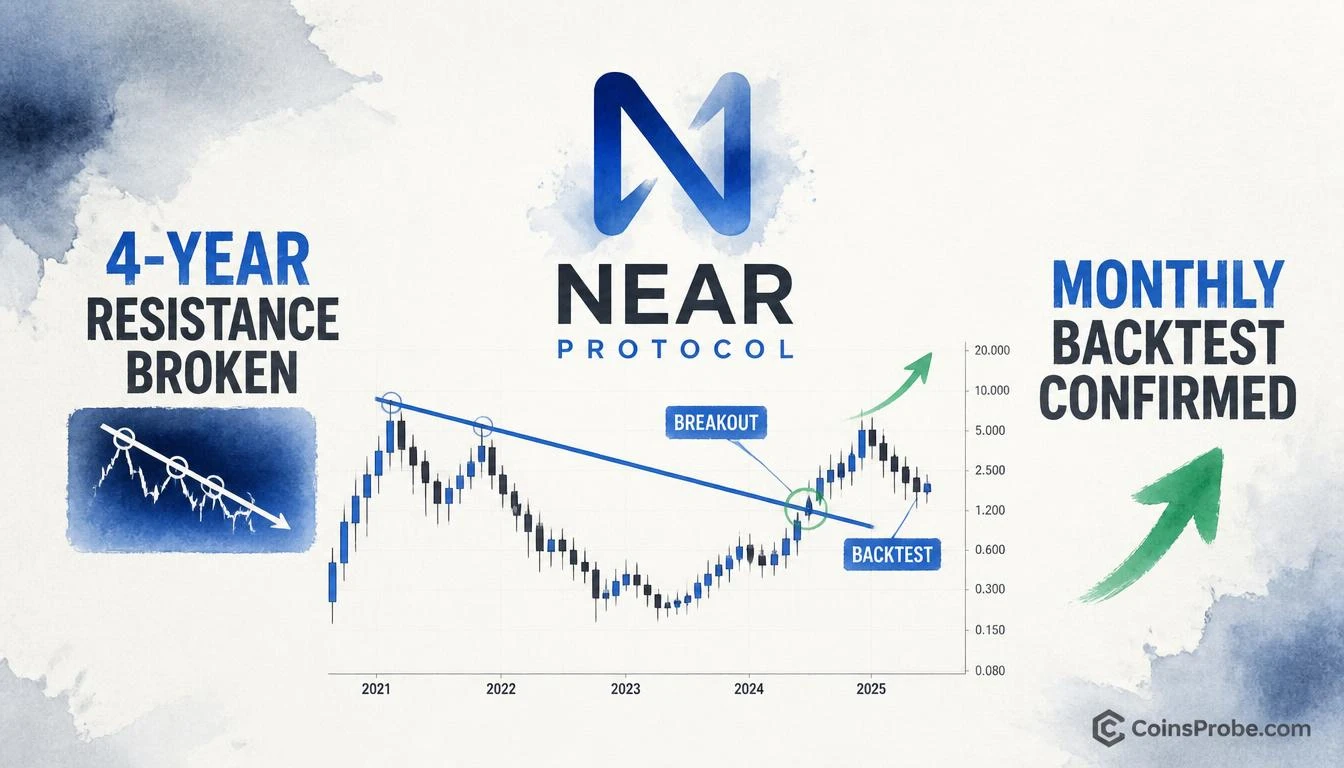
- NEAR breaks a 4-year descending resistance on the monthly chart and backtests it — confirmed breakout structure per @CryptoBullet1
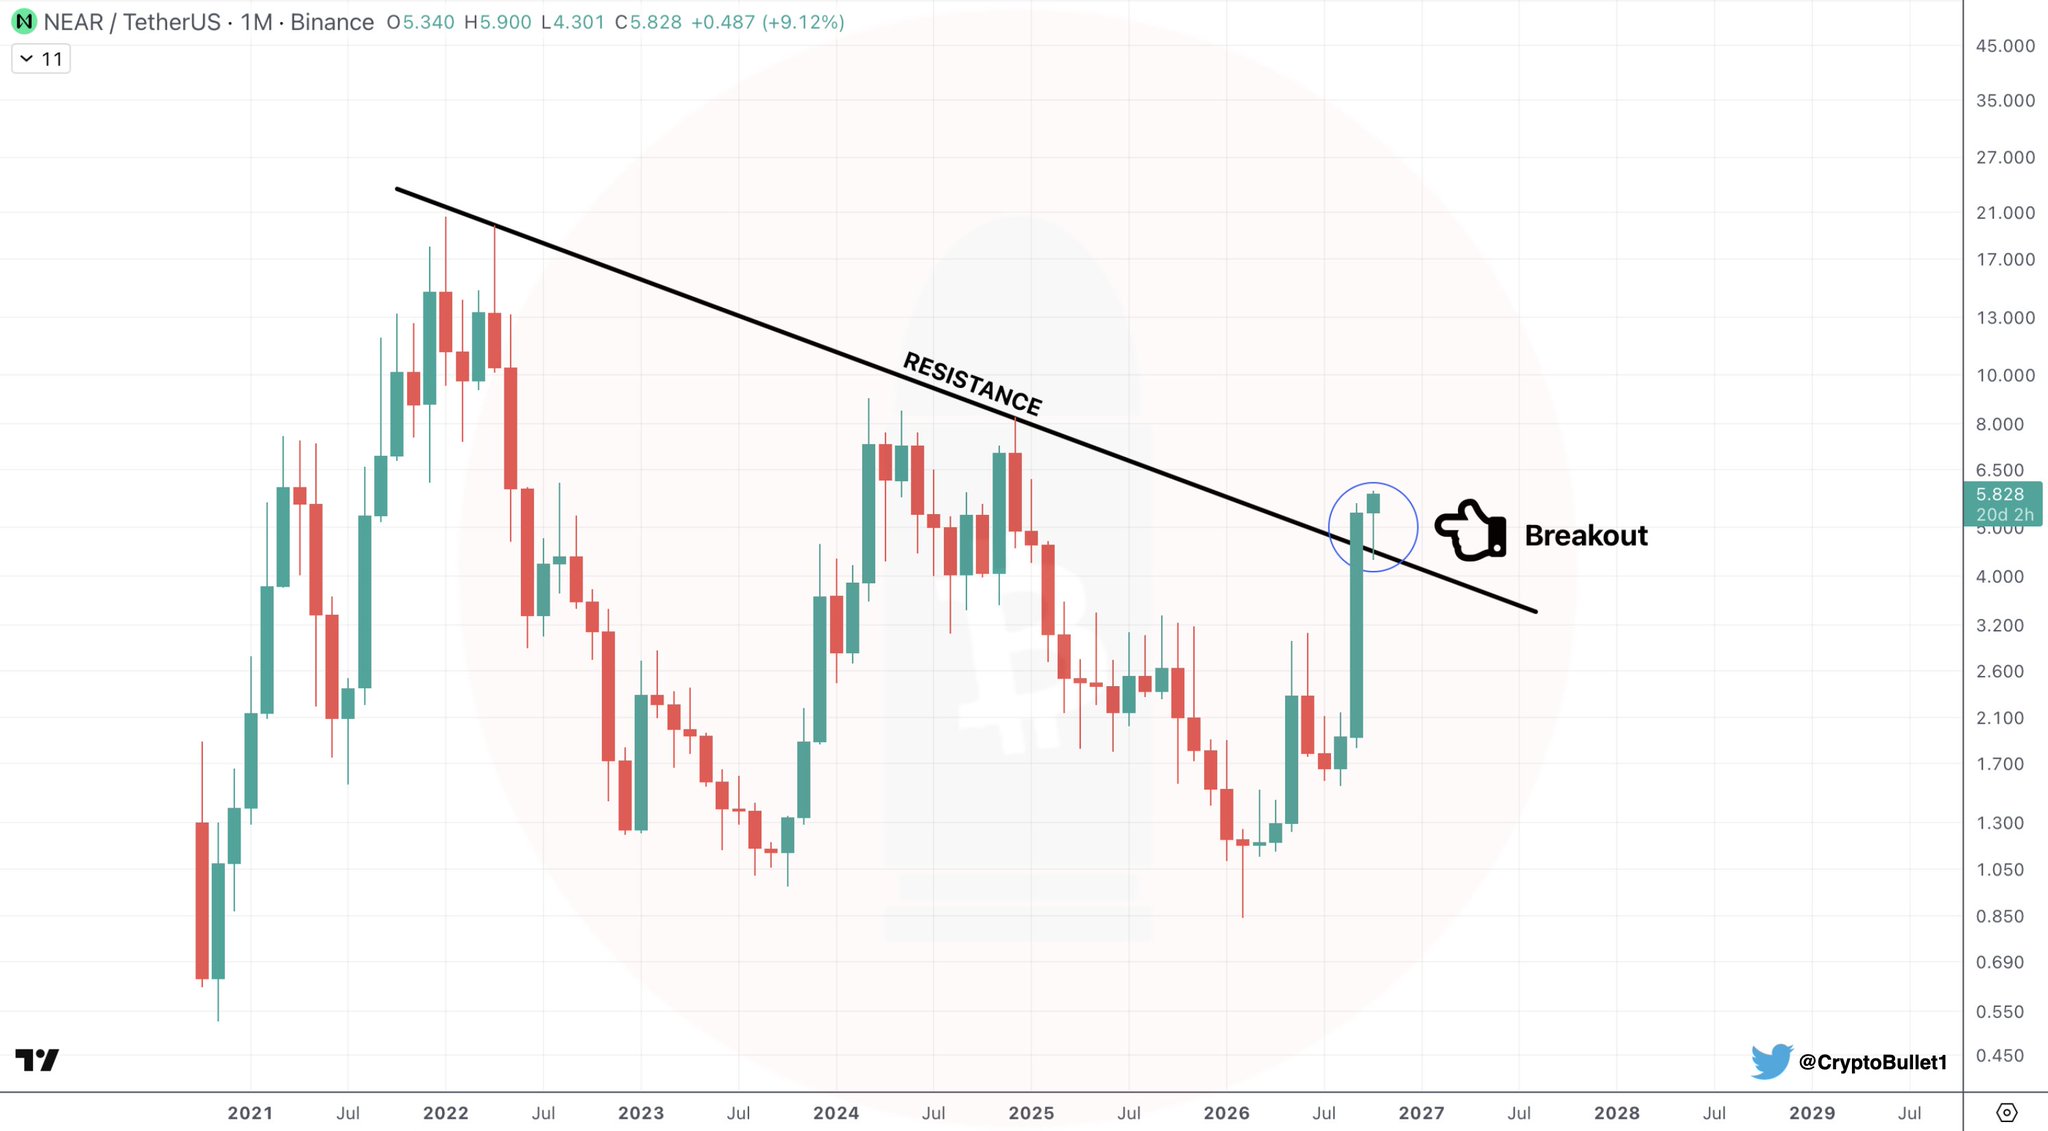
- Monthly candle shows O: $5.340, H: $5.900, current: $5.828 (+9.12%) with 20 days remaining on the candle
- CryptoBullet flags potential ZEC-style parabolic run — no numeric target stated, qualitative comparison only
- Invalidation: a monthly close back below the broken resistance line would convert the breakout into a fakeout
NEAR Protocol has done something on its monthly chart that has not happened in four years: it broke above a multi-year descending resistance line and then successfully backtested that same level, confirming the breakout rather than reversing it. The monthly candle structure, now visible on Binance’s NEAR/USDT pair, is one of the cleanest macro breakout signals the asset has printed since its 2021 peak.
Crypto analyst CryptoBullet (@CryptoBullet1) flagged the setup on October 11, 2026, writing: “$NEAR looks so bullish on the monthly. Broke the 4-Year Resistance line and backtested it. I wouldn’t be surprised if $NEAR goes on a $ZEC style run.”
The Signal — A 4-Year Descending Resistance, Broken and Confirmed
The monthly NEAR/USDT chart on Binance shows a descending resistance trendline connecting a series of lower highs spanning approximately four years — from the 2021 bull market peak through multiple failed recovery attempts. That line acted as a ceiling on every meaningful rally attempt. The most recent monthly candle pierced above it. The subsequent candle then pulled back to retest the broken resistance line from above, closing above it — the textbook structure of a confirmed breakout with backtest.
This matters for one specific reason: a breakout without backtest is speculative. A breakout followed by a successful backtest — where former resistance holds as new support — is confirmation. The market tested the sellers at that line, found none strong enough to push price back below it, and closed above. On a monthly timeframe, each candle represents 30 days of market consensus. This is not a noise signal.
The chart shows the current monthly candle opened at $5.340, hit a high of $5.900, and at the time of the chart annotation was trading at $5.828, up +9.12% on the month with 20 days and 2 hours remaining on the candle. The Y-axis of the chart extends to levels of $8.000, $10.000, $13.000, $17.000, $21.000, and beyond — context for how much open air sits above current price once a multi-year resistance is genuinely cleared.
The ZEC Comparison — What CryptoBullet Is Actually Referencing
CryptoBullet’s reference to a “ZEC-style run” is not a throwaway comment. Zcash (ZEC) is a precedent the analyst is citing for the type of move that can follow when a long-suppressed asset with a recognizable monetary narrative finally clears its structural resistance on high timeframes — a compressed, often parabolic reacceleration that catches most participants underweight. The comparison is qualitative, not a specific price target: CryptoBullet does not name a NEAR price level in his post, and no numeric target should be assigned to this signal beyond what the analyst stated.
What the comparison implies structurally is that the suppression period itself — four years of lower highs creating that resistance line — functions like a coiled spring. The longer the compression, the more significant the energy release when the line breaks with monthly-close confirmation.
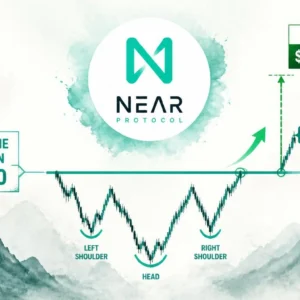
NEAR has had multiple macro pattern setups flagged across this cycle. Earlier analysis noted a macro double bottom formation with analyst targets at $8, $20, and a new all-time high, and separately an inverse head and shoulders below $3 with a 2027 breakout targeted. Each of those setups pointed to the same eventual direction. The 4-year resistance breakout, if sustained into monthly close, would be the highest-timeframe confirmation of that structural thesis yet.
What the Monthly Backtest Means — And What It Doesn’t
The breakout-and-backtest structure is among the most reliable confirmation patterns in technical analysis precisely because it requires two separate market decisions: the initial break (buyers overwhelm sellers at resistance) and the backtest (sellers attempt to reclaim the line and fail). Both have now occurred on NEAR’s monthly chart.
What this signal confirms: The 4-year descending resistance has transitioned from ceiling to floor on the monthly timeframe. The sellers who defended that line for four years were absorbed during the breakout candle.
What this signal does not confirm: A specific price target, a timeline for any subsequent move, or immunity from a deeper retest. Monthly candles have 20+ days remaining at the time of this writing — the close has not been printed. CryptoBullet’s note includes no numeric upside target, and none should be implied from the ZEC analogy alone.
The signal to watch: whether NEAR sustains a monthly close above the broken resistance line. A close below it would invalidate the breakout structure and require reassessment. NEAR’s prior macro setups — including the TD Sequential and inverse H&S pattern flagged earlier — had similarly clean invalidation logic at their key structural levels.
Bullish Scenario
NEAR sustains its monthly close above the broken 4-year resistance line. Former resistance becomes support, eliminating the structural ceiling that capped every recovery rally since 2021. This opens the chart to the levels visible on the Y-axis: $8.000, $10.000, $13.000, and beyond — with no structural resistance overhead on the monthly timeframe until those zones are reached.
Bearish Scenario
The monthly candle closes back below the broken resistance line before the month ends. This would convert the breakout into a fakeout — a false break above resistance that resolves lower. Buyers who positioned on the breakout signal would face a failed setup, and the 4-year resistance would resume its role as ceiling. The backtest that appeared to confirm the break would instead be revealed as the rejection.
NEAR Protocol has cleared the most significant structural ceiling on its monthly chart in four years. The breakout of a multi-year descending resistance line is confirmed at the pattern level — the subsequent candle retested the line from above and held. CryptoBullet’s signal is directional and specific: the setup is bullish on the monthly, and the ZEC comparison frames the potential character of the move, not its magnitude. The one number that matters now is the monthly closing price. If NEAR prints a monthly close above that broken resistance, the four-year ceiling becomes the floor. That close — not the intraday price — is what traders are watching.
Frequently Asked Questions
What does a breakout and backtest on the monthly chart mean for NEAR?
What is the ZEC-style run that CryptoBullet referenced for NEAR?
What would invalidate NEAR’s monthly breakout signal?
Has NEAR shown similar macro bullish patterns before this breakout?
Source: Cryptobullet1 · Published by CoinsProbe Markets Desk
The opinions and market insights shared on CoinsProbe represent the views of individual authors based on prevailing market conditions at the time of publication. Cryptocurrency investments carry significant risk and volatility. Readers are encouraged to conduct their own research and seek professional financial advice before making investment decisions. CoinsProbe and its contributors do not accept responsibility for financial losses or decisions made based on published content.
CoinsProbe may publish sponsored articles, affiliate links, or promotional collaborations. All sponsored material is clearly labeled to maintain transparency with our audience. Our editorial decisions remain fully independent, and advertising partnerships do not influence reviews, rankings, or published opinions.
Since 2023, CoinsProbe has delivered reliable insights on cryptocurrency, blockchain, and digital assets. Our content is created by experienced researchers and analysts who follow strict editorial standards focused on accuracy, transparency, and credibility. Every article is carefully reviewed and verified using trusted sources and current market data. We provide unbiased analysis and timely updates covering everything from emerging crypto projects to major industry developments.