
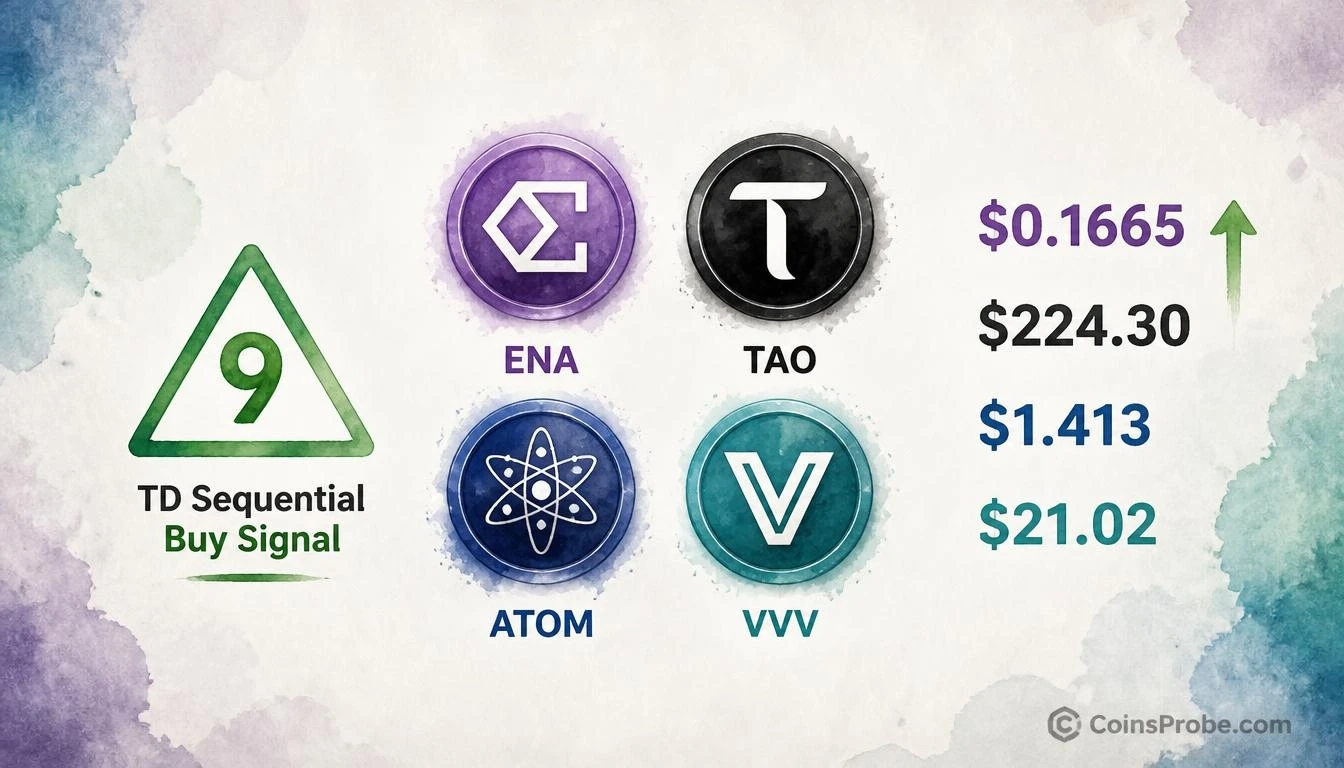

- ENA prints TD Sequential '9' buy signal at $0.1665 — prior October 20 signal produced +22.17% rally toward $0.20
- TAO, ATOM, and VVV simultaneously flash daily '9' buy signals after declines of 33.8%, 30.26%, and 35.8% respectively
- VVV invalidation level explicitly stated at $19 — analyst's condition for the signal to remain active
Four mid-cap altcoins have simultaneously printed TD Sequential “9” buy signals on their daily charts — a pattern that, the last time it appeared on Ethena, preceded a 22% rally within days. The assets in question: Ethena (ENA), Bittensor (TAO), Cosmos (ATOM), and Venice Token (VVV). Each has absorbed a drawdown ranging from 30% to 36% over recent weeks, and each is now sitting at or near a lower support reference line with a fresh exhaustion signal printed.
An analyst, posting as part of a six-part thread, identifies all four assets as carrying active TD Sequential buy signals on the daily timeframe. The analyst’s exact words on Ethena: “The TD Sequential has flashed a buy signal on the daily chart. The last time it did so, on October 20, $ENA went on to rally 22%. That makes this new signal worth paying attention to.” The same logic is applied to TAO, ATOM, and VVV — each with its own prior signal track record and a stated rebound level to watch.
What the TD Sequential Actually Measures
Before citing any reading, the mechanics matter. The TD Sequential counts nine consecutive daily closes lower than the close four bars prior — identifying momentum exhaustion, not a price floor. A “9” buy signal does not mean the low is locked in. It means selling pressure has persisted long enough, in a mathematically consistent pattern, that exhaustion becomes statistically probable. The signal is non-directional in the sense that it cannot guarantee a reversal — but it has a documented track record of identifying turning points when price is simultaneously at a structural support zone. All four assets below are at exactly that combination: a “9” print sitting on a lower reference level.
Signal 1 — Ethena (ENA): The Precedent Is 22% in October
ENA’s daily chart shows the TD Sequential printing a “9” buy signal on the current candle, with price at $0.1665 — sitting at the lower boundary of a rectangular consolidation zone identified on the chart. A dotted horizontal reference line extends across the chart at the mid-range of that box. Price is currently below that line, meaning no breakout has occurred. The pattern is still forming.
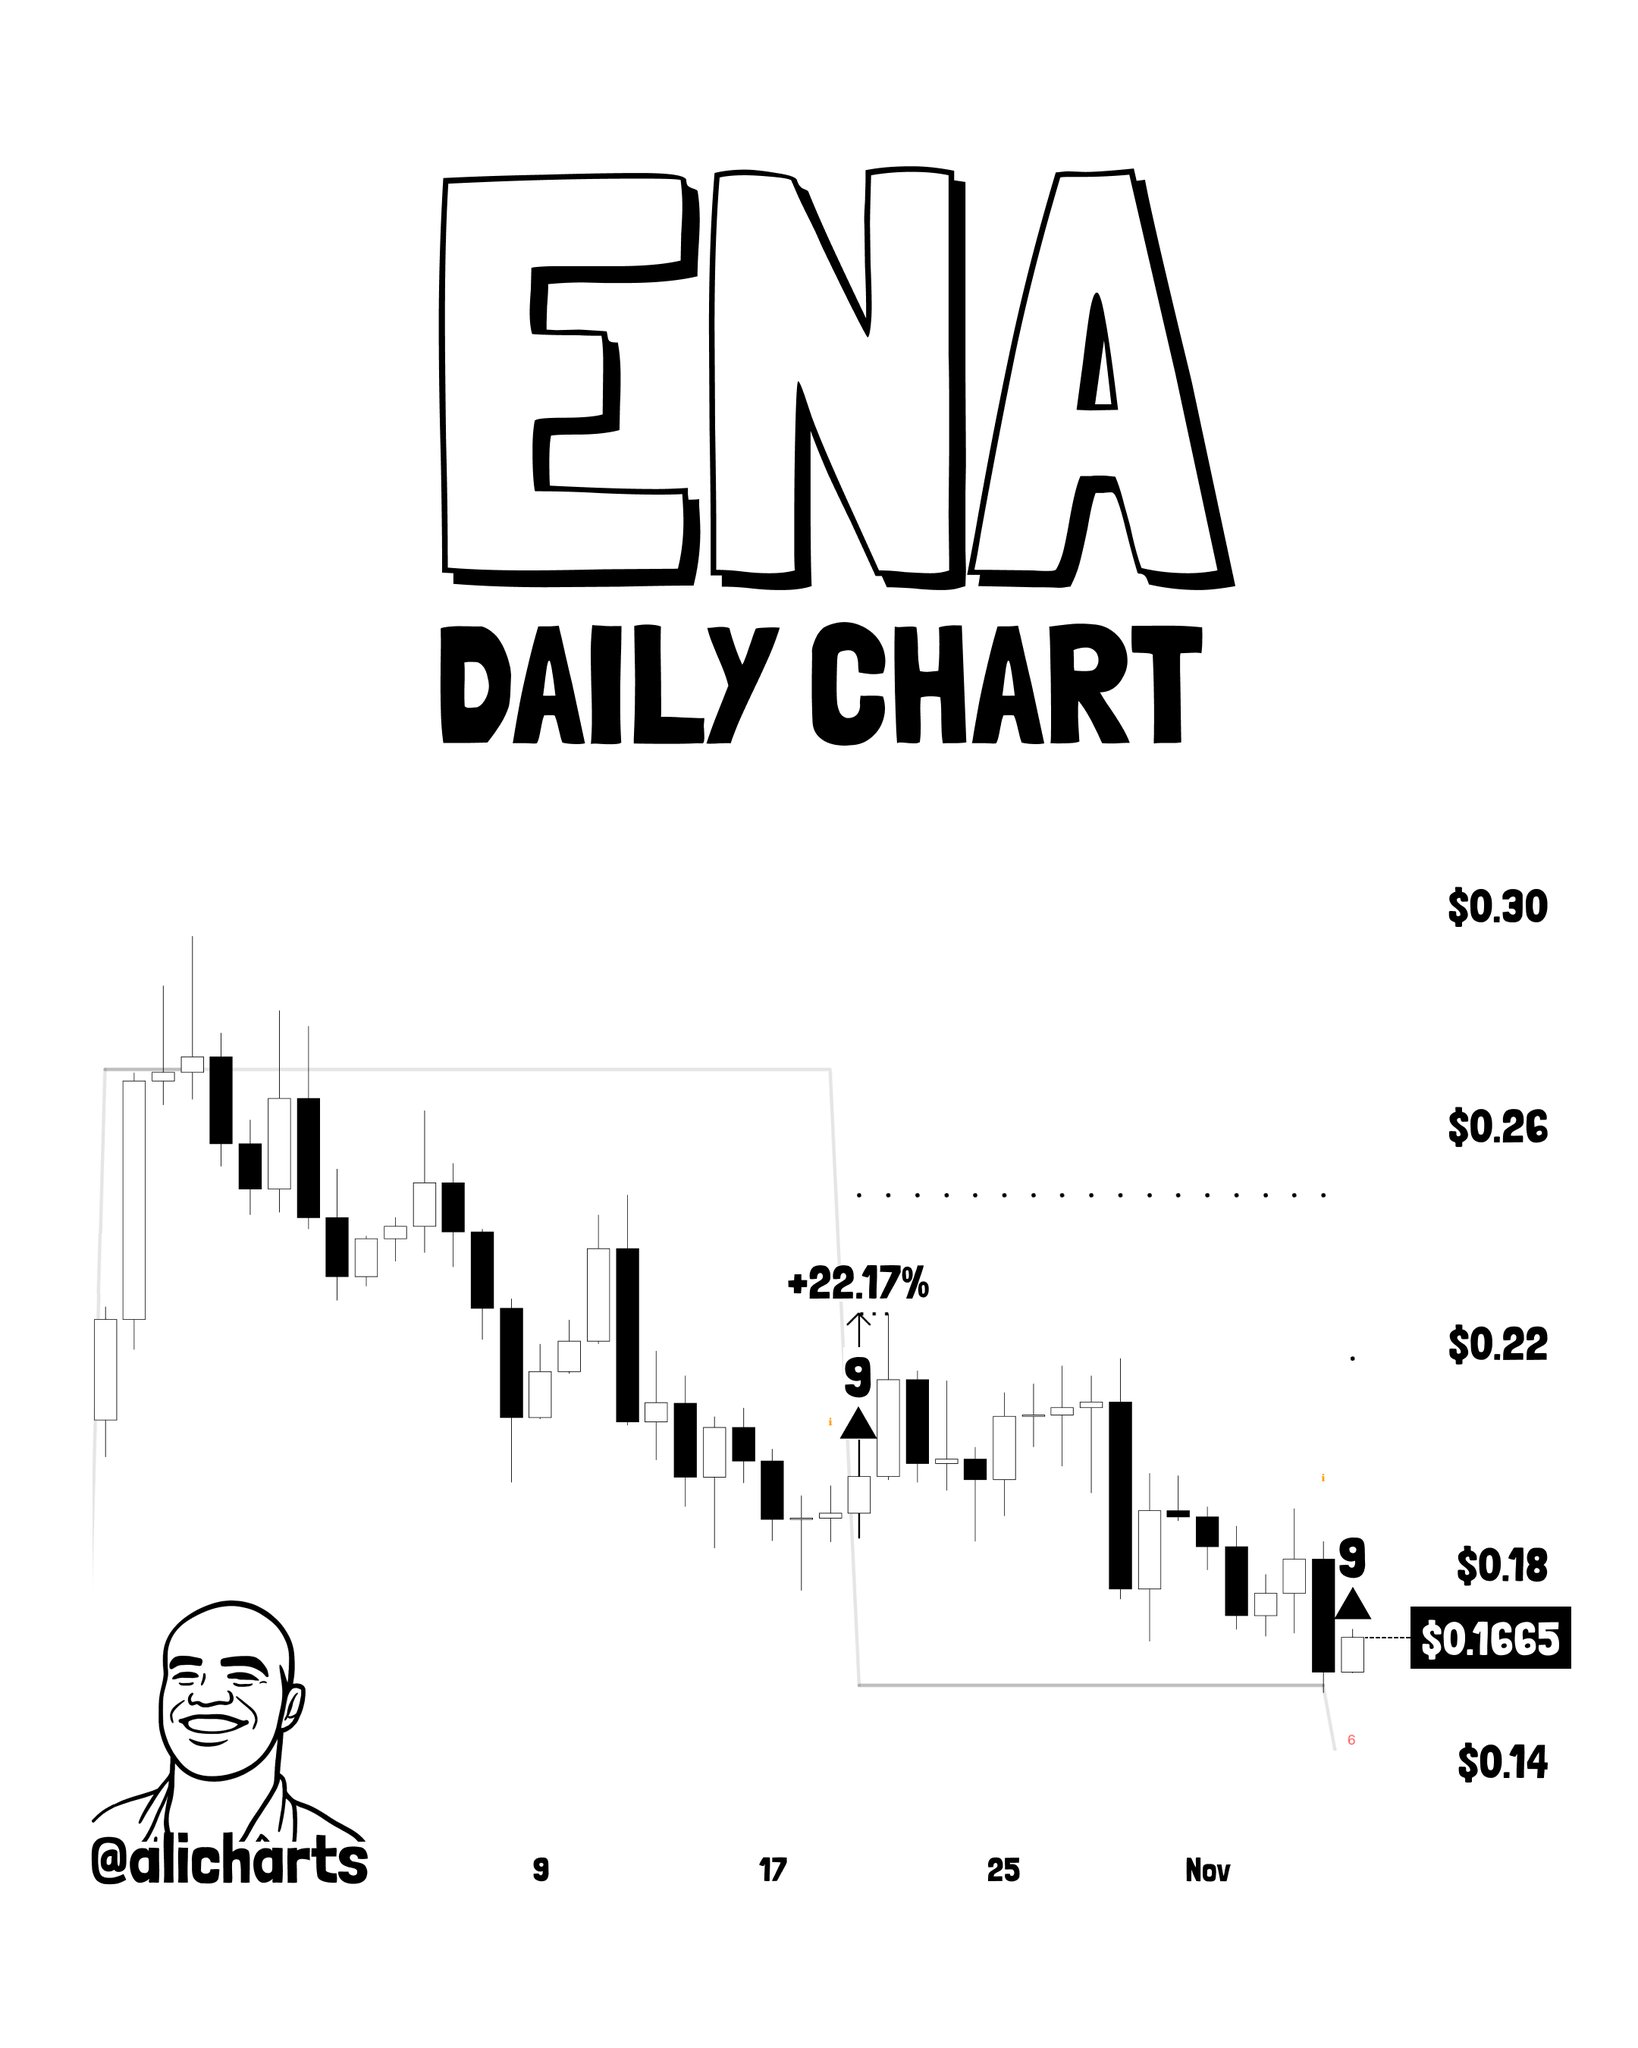
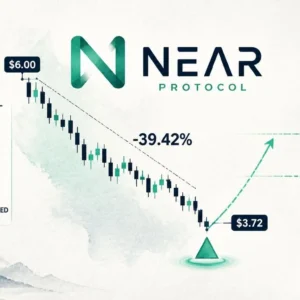
The precedent is documented and exact. On October 20, ENA printed an identical “9” buy signal. The subsequent rally measured +22.17% — that figure is printed directly on the chart as a completed historical move. The analyst’s stated rebound target for the current signal is $0.20, conditional on buyers stepping in. At $0.1665, that target represents approximately 20% upside from the current print — consistent with the prior instance’s magnitude. The key condition: buyers must step in at the current zone. Without that, the signal is noted but not activated. For context on how similar exhaustion signals have played out across other altcoins, see NEAR Prints TD Sequential ‘9’ Buy Signal After a 39% Drop.
Signal 2 — Bittensor (TAO): Sell Signal Preceded 33.8% Drop, Buy Signal Now Active
TAO’s chart presents the clearest two-sided track record of the four. A TD Sequential sell “9” appeared at the recent peak, followed by a sustained decline of 33.8% — that percentage is printed on the chart as a completed historical measurement. A buy “9” has now printed at the recent low, with price at $224.30, sitting at the dotted support reference line visible at the chart’s lower boundary.
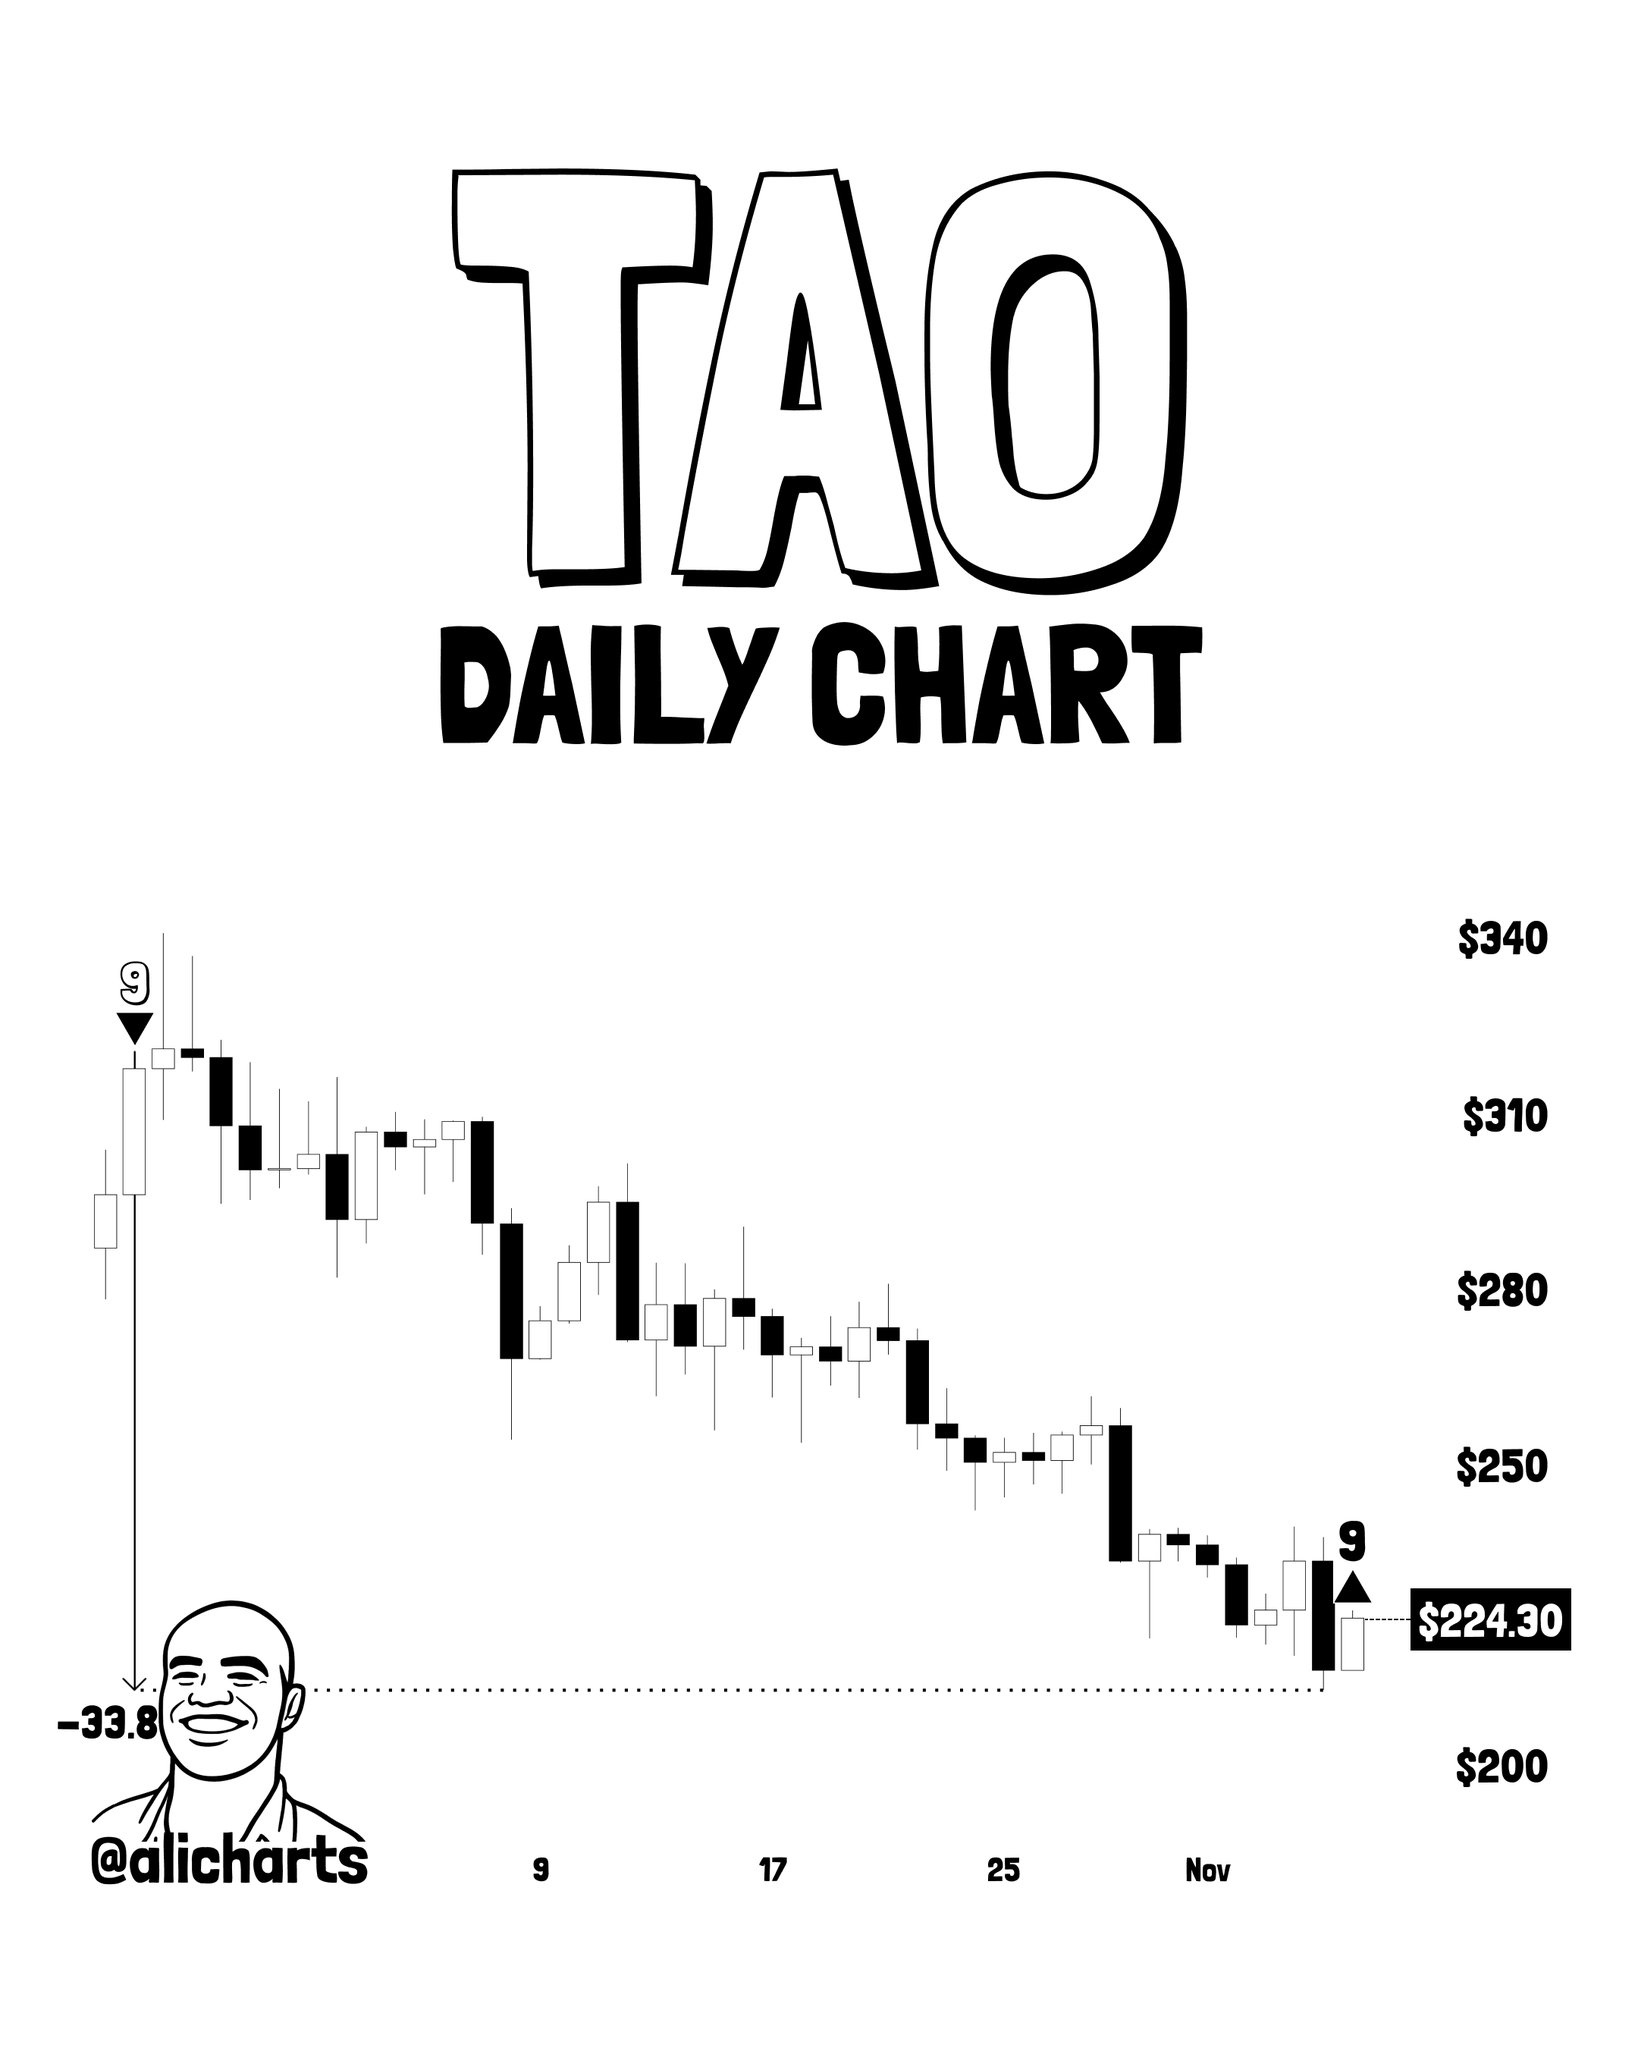
The same indicator that correctly identified the local top via a sell signal is now flagging exhaustion to the downside. The analyst notes this symmetry explicitly — the TD Sequential “anticipated $TAO’s recent local top” before the nearly 34% decline, and is now pointing to a potential reversal. Pattern status remains forming: price is at the support line but has not yet shown confirmed upside follow-through above any resistance level on the chart. The sell signal’s track record gives the buy signal additional credibility, but confirmation requires price to hold at $224.30 and begin recovering.
Signal 3 — Cosmos (ATOM): Post-30% Decline Buy Signal at Lower Reference
ATOM’s daily chart mirrors the TAO structure. A TD Sequential sell “9” appeared near the October 12 peak, followed by a bearish sequence that produced a 30.26% decline — printed on the chart as a completed drawdown. An additional A13 signal appeared mid-decline. The buy “9” has now printed at the recent low, with price at $1.413.
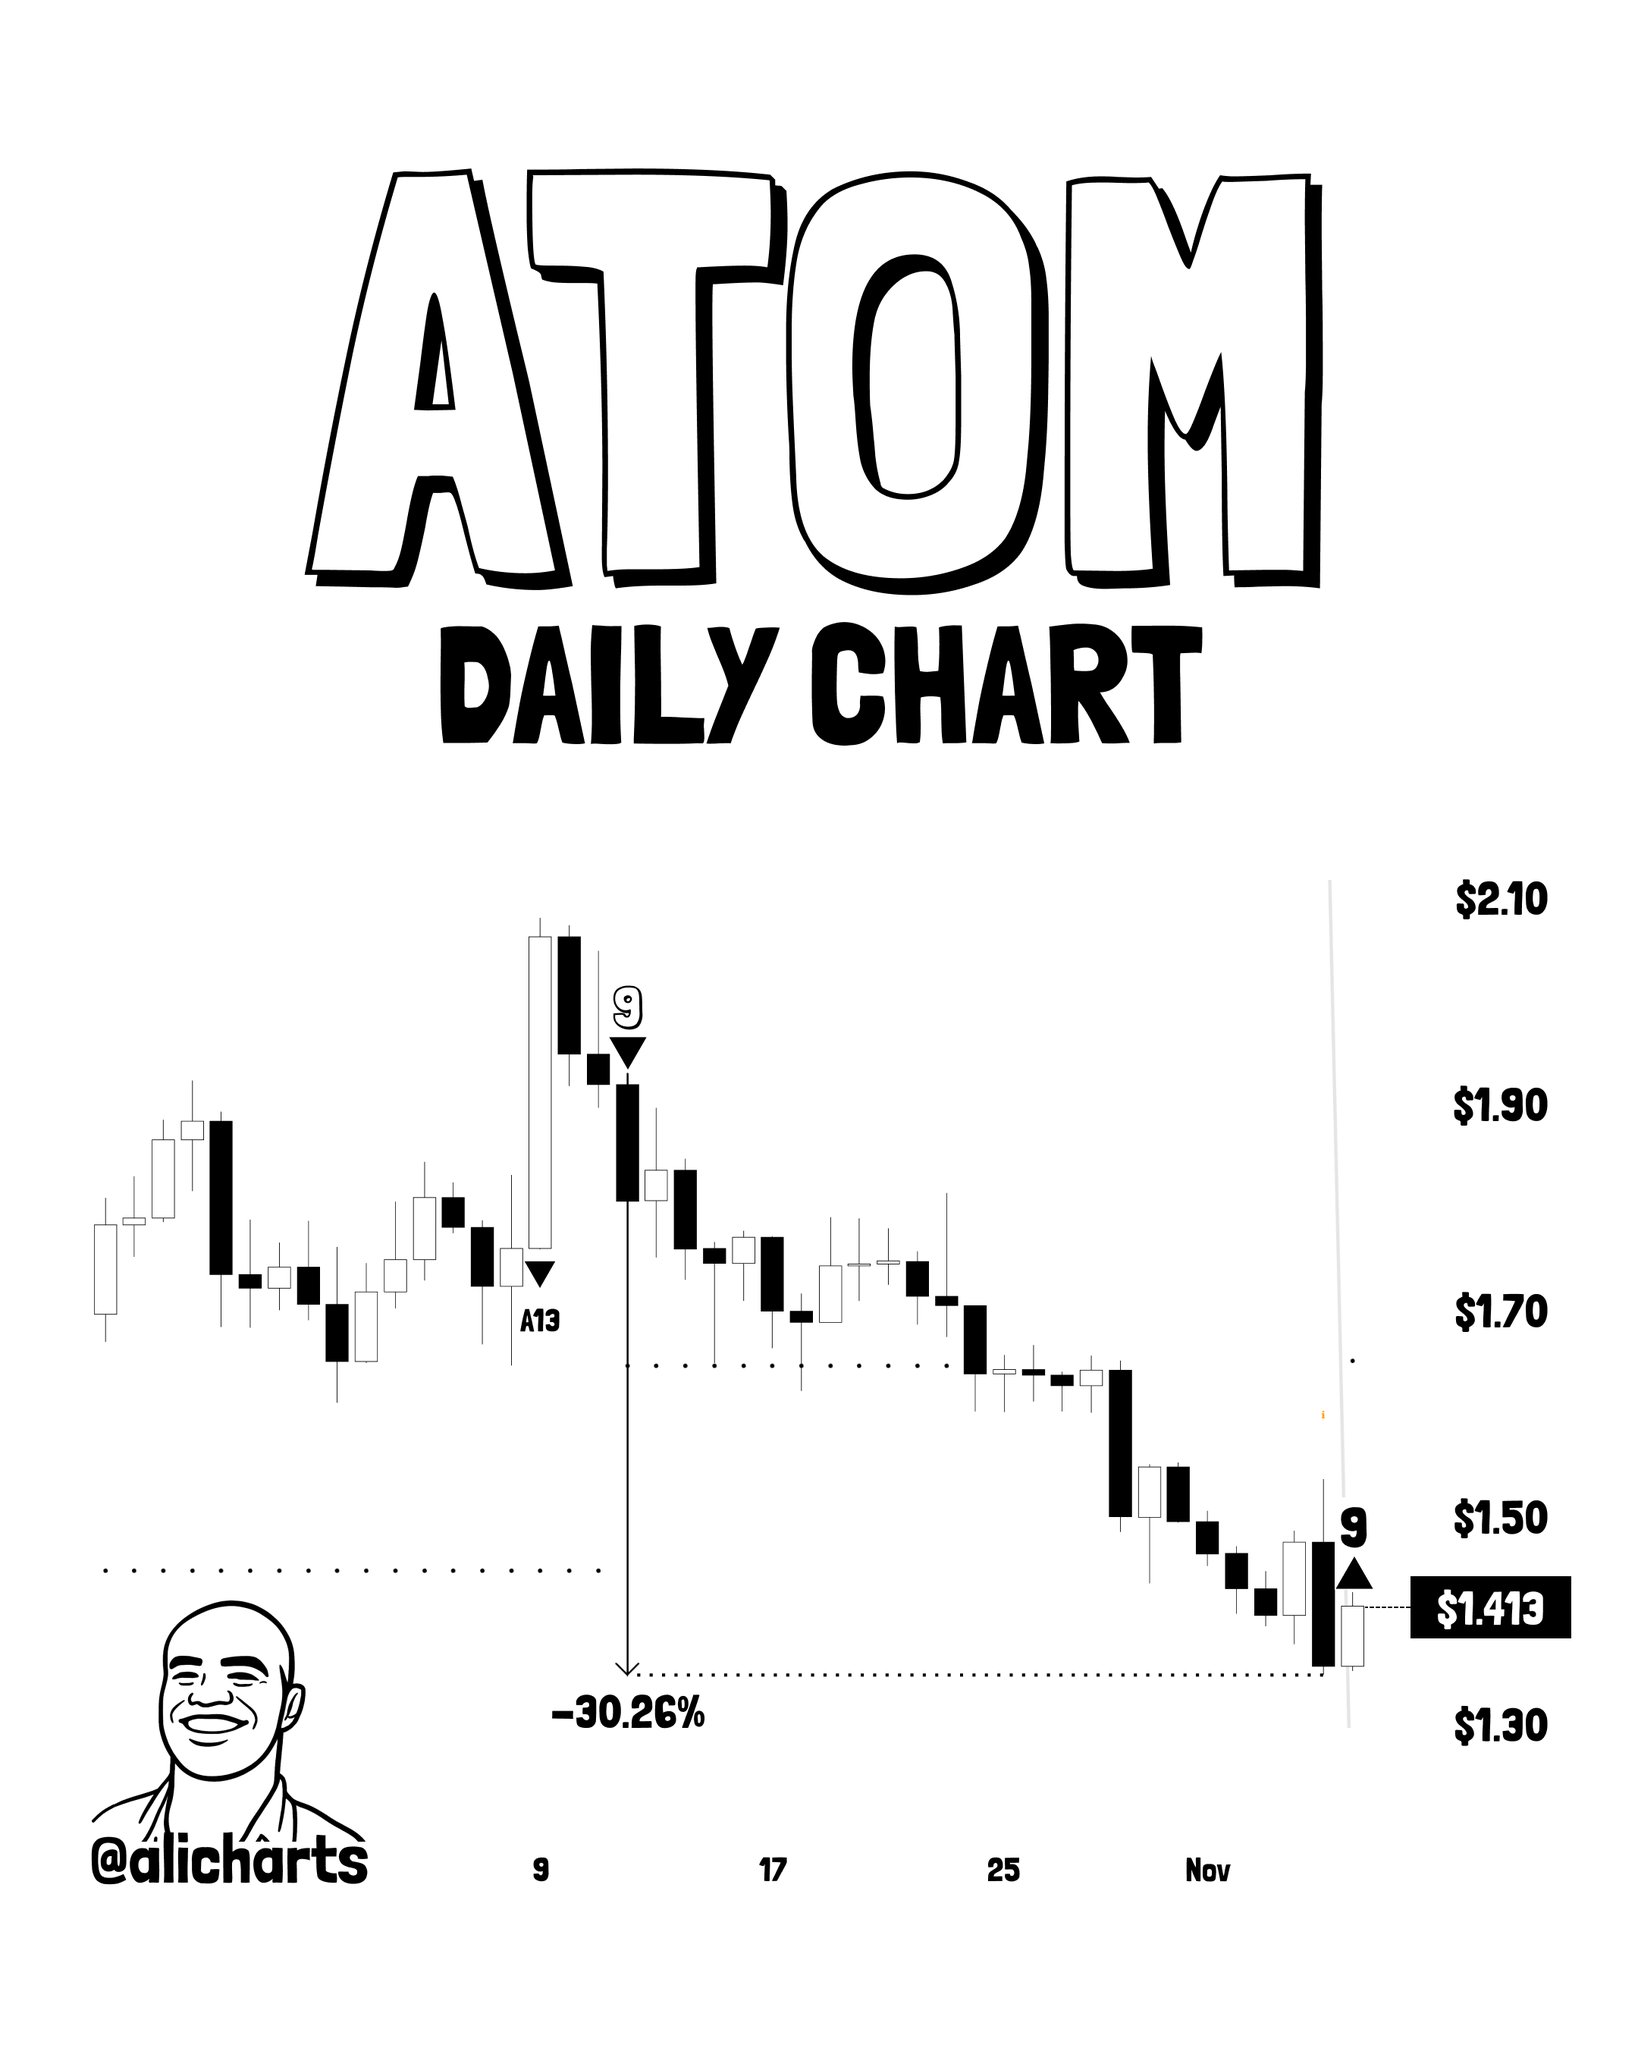
The chart shows two dotted horizontal reference lines. Price is currently below the upper line (approximately the $1.65 zone) and sitting at the lower dotted trendline — the bottom reference level. The same two-sided signal pattern as TAO: a sell signal that correctly preceded a 30%+ drawdown is now being followed by a buy signal at the structural low. The pattern is still forming. No confirmed reversal breakout has occurred. The upper dotted line near $1.65 represents the first structural area to reclaim for a signal continuation read.
Signal 4 — Venice Token (VVV): Multiple Countdown Signals, Buy at $21 Support
VVV presents the most complex signal sequence of the four. The daily chart shows a bearish “9” sell signal near the chart’s start, followed by A13 and S13 sell countdown completions mid-chart — a full bearish countdown sequence. The cumulative decline from peak to trough is marked at 35.8% on the chart. A fresh bullish “9” buy signal has now appeared on the most recent daily candle, with price at $21.02, sitting at a dotted horizontal support reference line.
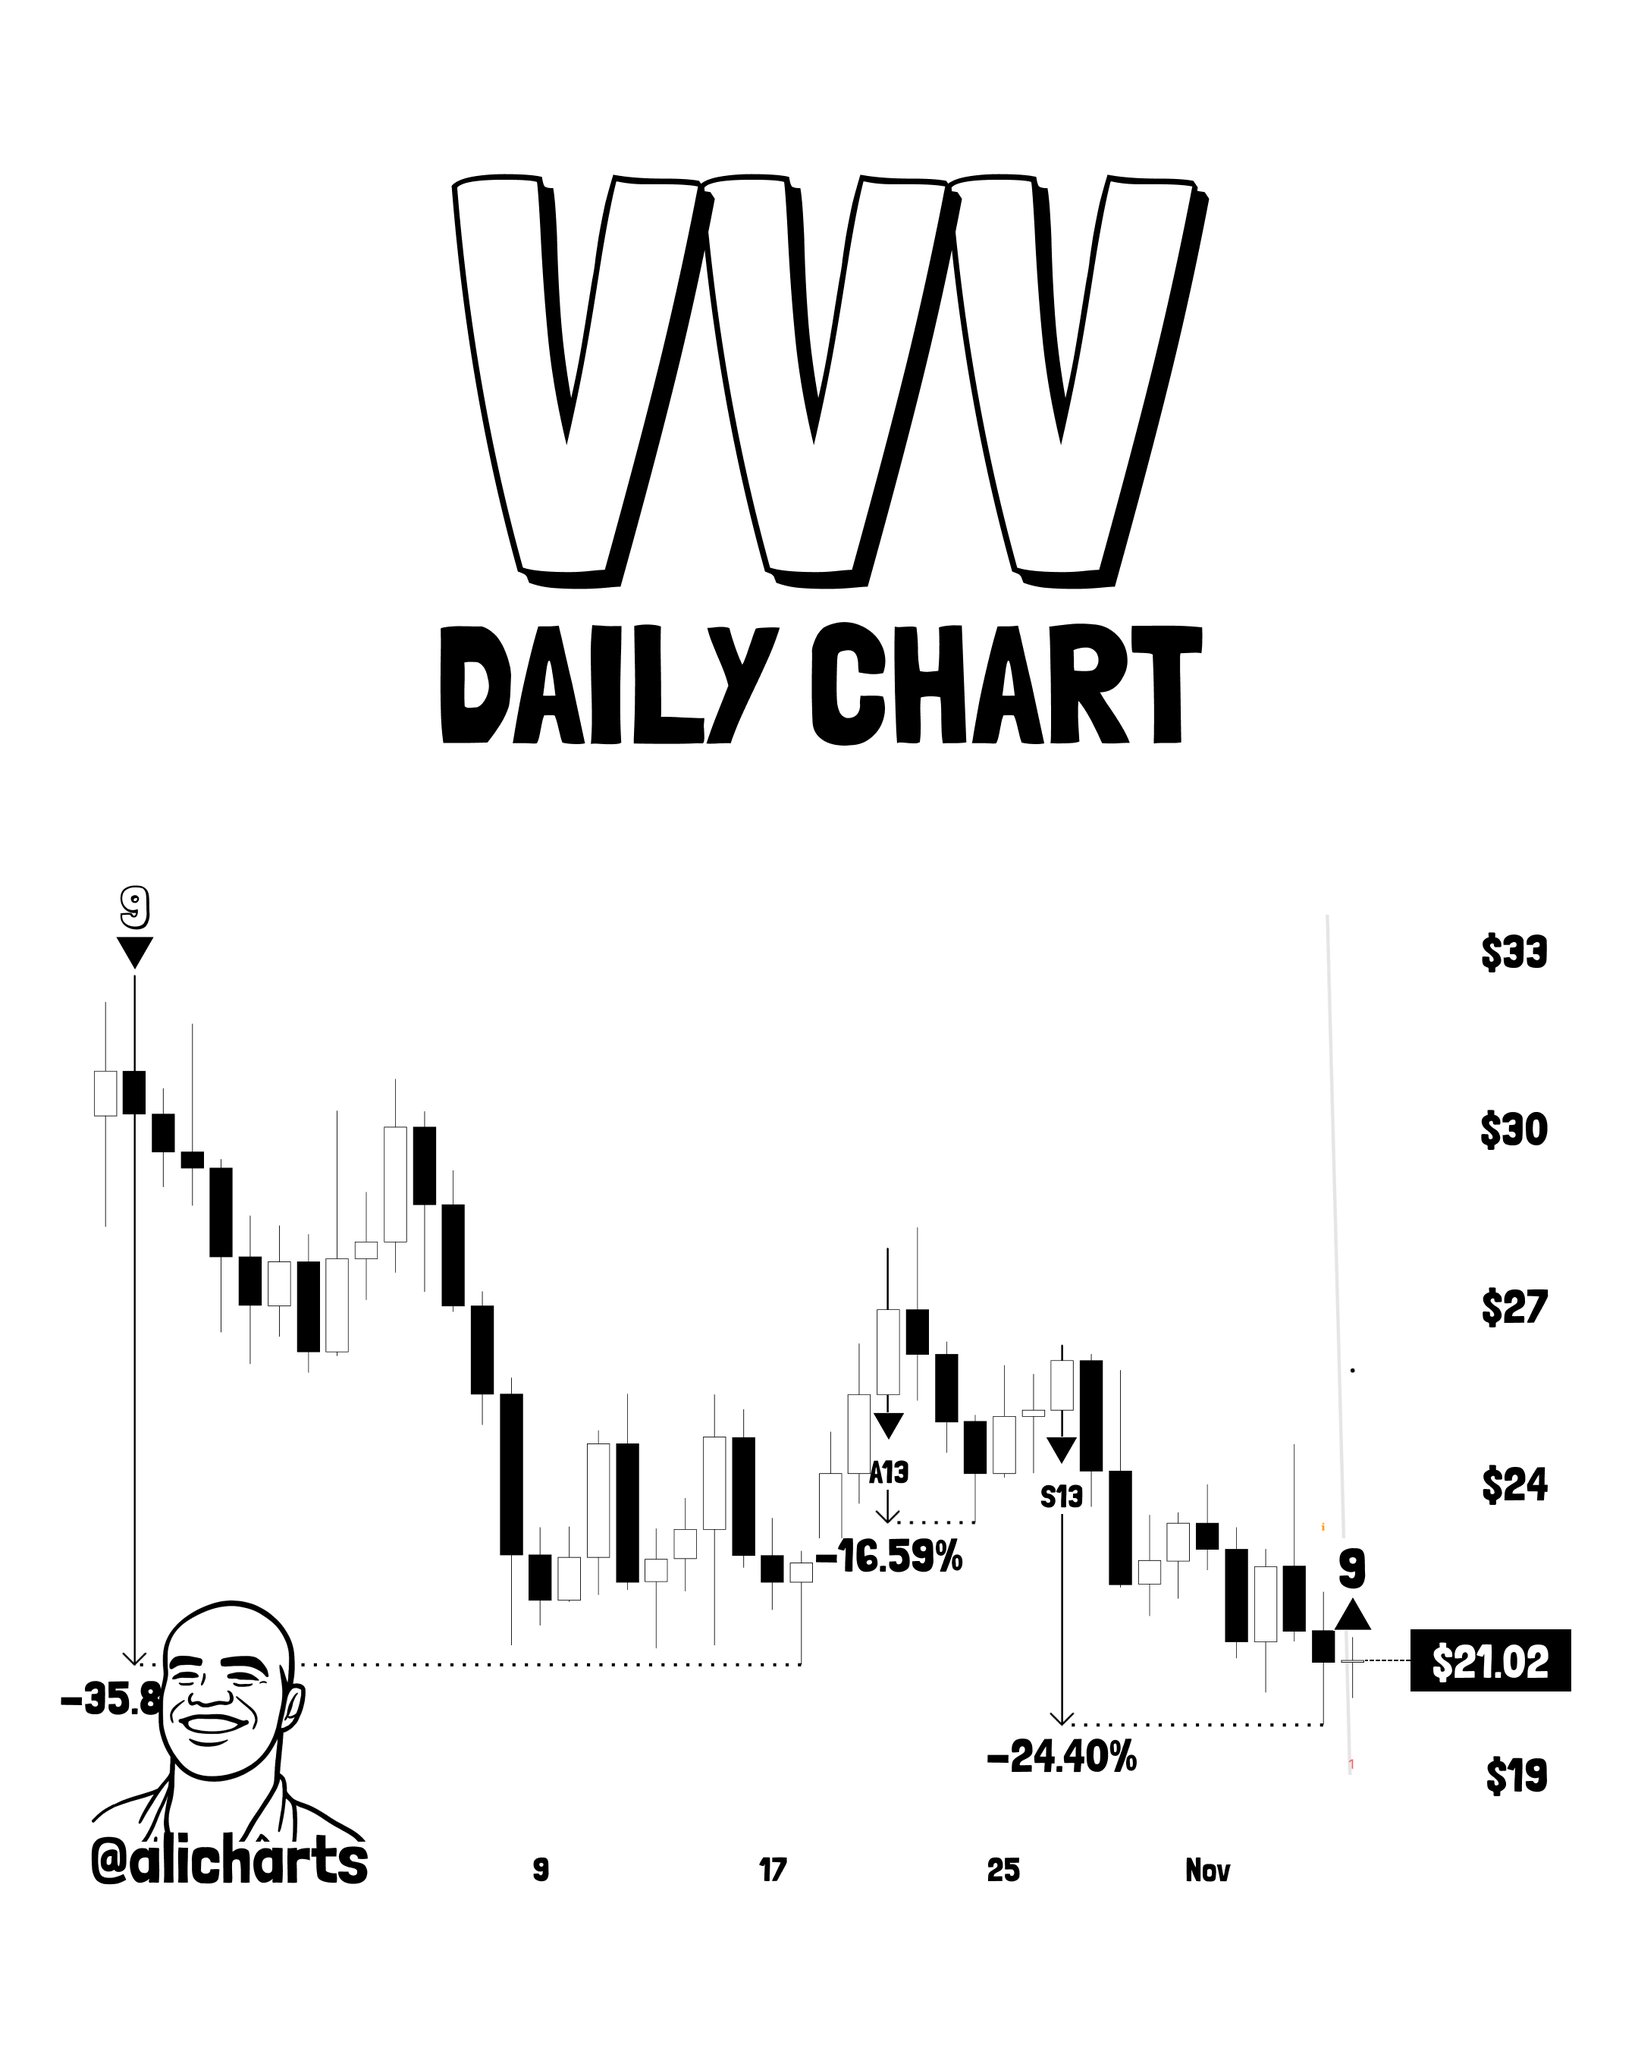
The analyst’s stated condition for VVV is explicit: the signal is contingent on the $19 level holding as support. Two prior decline measurements are printed on the chart — 16.59% and 24.40% — marking intermediate drawdown phases within the broader 35.8% decline. The $19 level represents the stated invalidation threshold. If price breaks below $19, the buy signal framework fails. If $19 holds, the buy signal remains active with a potential bounce setup. Pattern status: forming, support test ongoing.
Four Signals, One Theme — What They Share
All four assets share three structural conditions simultaneously: a TD Sequential “9” buy signal printed on the daily chart, price sitting at or near a lower reference support line, and a prior completed decline of 30%–36% that exhausted the bearish momentum. That combination — exhaustion signal plus structural support confluence — is what makes the analyst flag all four in a single thread rather than treating them as isolated setups.
| Asset | Current Price | Decline Before Signal | Prior Signal Result | Rebound Watch Level |
|---|---|---|---|---|
| ENA | $0.1665 | Sustained downtrend | +22.17% (Oct 20) | $0.20 |
| TAO | $224.30 | -33.8% | Sell “9” preceded drop | Recovery above $224 |
| ATOM | $1.413 | -30.26% | Sell “9” preceded drop | Reclaim $1.65 zone |
| VVV | $21.02 | -35.8% | Full bearish countdown | $19 must hold |
TD Sequential buy signals across four altcoins | Source: @alicharts (X)
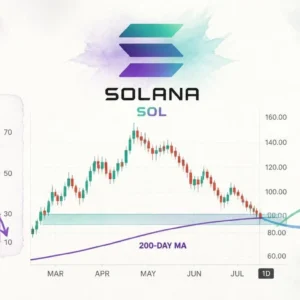
None of the four patterns have confirmed a reversal. All are still forming. The TD Sequential identifies exhaustion — the market decides what comes next. For a comparable setup where two classic dip signals aligned simultaneously, see SOL Hits 200-Day MA as RSI Enters Oversold — Two Classic Dip Signals Align.
Bullish Scenario
ENA holds the lower consolidation zone and reclaims $0.20, consistent with the October 20 precedent of +22.17%. TAO holds $224.30 and shows upside follow-through above chart resistance. ATOM holds the lower dotted reference line and reclaims the $1.65 zone. VVV holds $19 and bounces from $21.02 — all four confirming the TD Sequential buy signal pattern.
Bearish Scenario
VVV loses $19, invalidating the analyst’s stated condition. ENA fails to attract buyers at $0.1665 and breaks the lower consolidation boundary. TAO and ATOM lose their respective support reference lines without upside follow-through — all four signals fail to activate, and the downtrends extend.
The TD Sequential has a documented two-sided track record on this specific cluster: sell signals at TAO’s peak preceded a 33.8% drop, sell signals at ATOM’s October 12 peak preceded a 30.26% drop, and ENA’s October 20 buy signal produced a 22.17% rally. Whether the current buy signals across all four extend that track record will be answered at $0.1665 for ENA, $224.30 for TAO, $1.413 for ATOM, and — most critically — $19 for VVV. Watch $19 on VVV as the analyst’s explicit stated invalidation level for the entire setup.
Source: x.comFrequently Asked Questions
What is a TD Sequential ‘9’ buy signal and why does it matter for ENA?
What is the invalidation level for the Venice Token (VVV) buy signal?
Did the TD Sequential correctly predict Bittensor’s (TAO) 33.8% decline?
Are any of these four buy signals confirmed reversals?
Source: Ali Charts · Published by CoinsProbe Markets Desk
The opinions and market insights shared on CoinsProbe represent the views of individual authors based on prevailing market conditions at the time of publication. Cryptocurrency investments carry significant risk and volatility. Readers are encouraged to conduct their own research and seek professional financial advice before making investment decisions. CoinsProbe and its contributors do not accept responsibility for financial losses or decisions made based on published content.
CoinsProbe may publish sponsored articles, affiliate links, or promotional collaborations. All sponsored material is clearly labeled to maintain transparency with our audience. Our editorial decisions remain fully independent, and advertising partnerships do not influence reviews, rankings, or published opinions.
Since 2023, CoinsProbe has delivered reliable insights on cryptocurrency, blockchain, and digital assets. Our content is created by experienced researchers and analysts who follow strict editorial standards focused on accuracy, transparency, and credibility. Every article is carefully reviewed and verified using trusted sources and current market data. We provide unbiased analysis and timely updates covering everything from emerging crypto projects to major industry developments.