
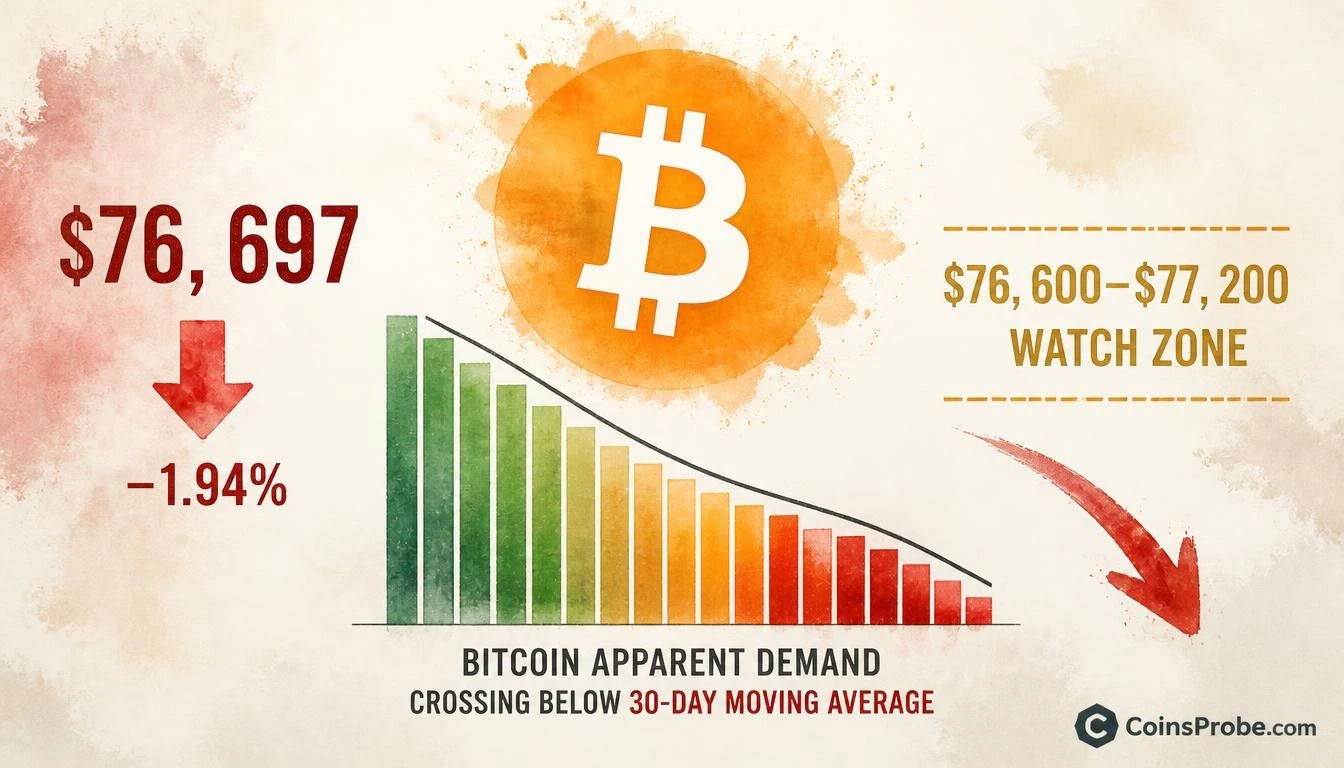
- BTC trades at $76,697 — down 1.94% in 24 hours — as rebound from $78,700 collapses under liquidation pressure
- 70% of ~$100M in 24-hour BTC liquidations were long positions across 13 exchanges, per CryptoQuant analyst XWIN Japan
- Bitcoin Apparent Demand crossed below its 30-day average — confirmed breakdown per CryptoQuant chart
- Spot BTC ETFs saw $398.6M net outflow on Nov 2, led by IBIT's $405.3M single-day outflow per SoSoValue
Bitcoin’s attempted recovery is over — at least for now. Trading at approximately $76,697 at time of writing, down 1.94% over the past 24 hours and carrying a market cap of roughly $1.54 trillion, BTC has failed to sustain any meaningful bounce after its recent pullback. The mechanics behind that failure are documented in precise detail by CryptoQuant analyst XWIN Japan, whose published quicktake makes one thing explicit: this is not a demand-driven dip that buyers are absorbing. It is a liquidation-driven decline that spot buying has been too thin to halt.
“Some spot buying persists, but it has not absorbed futures selling and liquidations,” writes XWIN Japan in CryptoQuant’s published note, dated November 2, 2026. That single sentence is the entire thesis — and the on-chain and futures data behind it is extensive.
The Timeline: How the Rebound Broke Down
According to CryptoQuant’s published analysis, BTC’s failure played out in four distinct phases across a 24-hour window. On the morning of November 2, BTC recovered toward $78,700, supported by Binance’s withdrawal restart easing liquidity fears, alongside optimism around U.S.–Iran diplomatic talks, declining oil prices, and firmer equity futures. The context appeared constructive. Then the structure cracked.
By afternoon, the rally stalled below $79,000 and BTC slipped to the $77,600–$77,800 range. Critically, the selling began before U.S. equity markets opened — pointing to internal crypto weakness, not external equity contagion. Overnight, a secondary recovery attempt toward $78,000 failed as the Nasdaq Composite closed down 1.1%, with U.S. technology stocks reversing lower and amplifying BTC’s decline through futures selling and forced long closures. By early morning JST on November 3, BTC had broken below $77,000 and tested the mid-$76,600s.
The cost basis of 1–3 month holders — reported at $77,140 as of November 1 — is now above the current price. That crossover matters: it raises the probability of distribution on any rebounds, as short-term holders sitting at a loss tend to sell into relief rallies rather than hold through them.
The Liquidations — Scale and Composition
The futures component of this decline is not speculative — it is measured. According to CryptoQuant’s note, approximately $100 million in BTC liquidations occurred in the 24 hours ending at 6:16 a.m. JST on November 3, tracked across 13 exchanges. Of those, roughly 70% were long liquidations. That breakdown — 70/30 long-to-short — confirms the directional nature of the flush. This was not a balanced deleveraging event. It was long positions being forcibly closed as price moved against them, accelerating the decline and depressing any recovery attempts.
Spot buying was present but insufficient. Oil prices fell. Treasury yields declined. Both of those would ordinarily be read as supportive macro conditions for risk assets. BTC could not sustain its rebound even under those circumstances — a telling sign about the source of the selling pressure.
Apparent Demand — The On-Chain Warning
The chart shared by CryptoQuant’s account on X carries an on-chain signal that provides the broader context for this price action: Bitcoin’s Apparent Demand has crossed below its 30-day average and is now in negative territory.
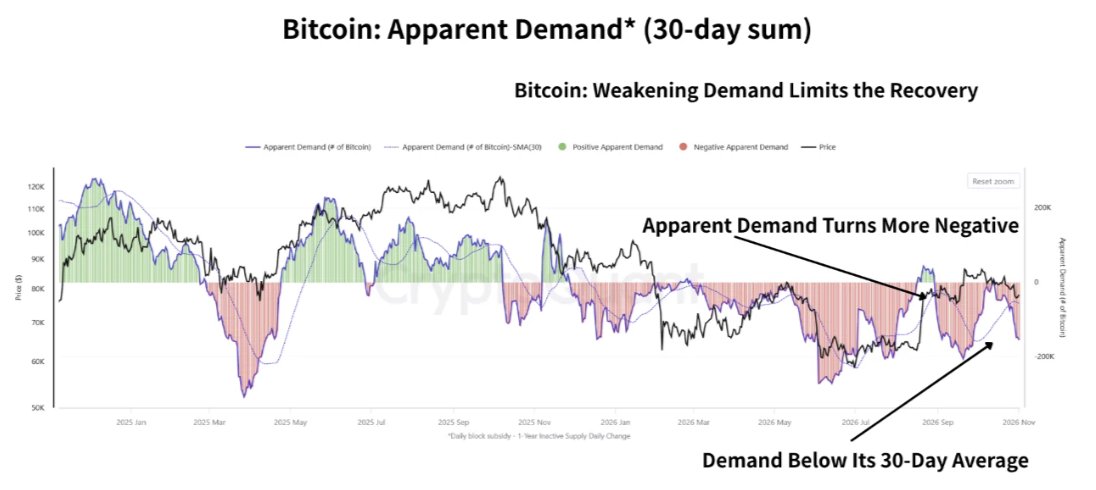
The chart covers approximately January 2025 through November 2026 and plots 30-day rolling apparent demand alongside BTC price. The visual pattern is unambiguous: demand bars that were predominantly positive through early 2025 have shifted to increasingly negative readings through mid-to-late 2026. The demand line now sits below its 30-day moving average — exactly the configuration CryptoQuant annotates with two explicit labels: “Apparent Demand Turns More Negative” and “Demand Below Its 30-Day Average.”
CryptoQuant defines apparent demand as an on-chain proxy for underlying buying pressure — not a direct measure of cash outflows, but a structural indicator of whether demand is expanding or contracting relative to recent norms. A reading below the 30-day average signals that buying activity is not keeping pace with what it has averaged over the preceding month. Combined with the current price sitting at the lower boundary of its recent consolidation range in the $80,000–$85,000 zone visible on the chart, the pattern status is a confirmed breakdown — price has not recovered above recent highs, and the demand structure that would support such a recovery is absent.
This is the on-chain context that makes the short-term liquidation data more significant. The liquidations are not happening into a demand vacuum temporarily — they are happening into a structurally weak demand environment where the underlying bid has been deteriorating on a rolling 30-day basis.
ETF Flows Confirm the Institutional Bid Is Pulling Back
Spot Bitcoin ETF data via SoSoValue adds another layer to the demand picture. On November 2, net outflows across spot BTC ETFs reached $398.6M for the day. IBIT alone saw $405.3M in outflows, partially offset by $6.7M in inflows to FBTC. GBTC recorded zero net flow. Total ETF net assets now stand at $98.12 billion, with cumulative net inflows since launch at $56.58 billion. The current streak is two consecutive outflow days, with the past five trading days producing a net $711.6M in outflows across three inflow and two outflow sessions. Institutional demand through the ETF channel is not reinforcing the spot bid — it is reducing it.
Strategy (formerly MicroStrategy) continues accumulating, having added 811 BTC for $65.5 million in its latest reported purchase, bringing total holdings to 849,327 BTC as of November 2. That corporate treasury demand remains a structural long-term bid. But it is not a short-term price catalyst when ETF outflows of this magnitude are running simultaneously.
The Macro Backdrop — Rate Risk Compounds the Picture
The macro environment adds a layer of forward-looking pressure. Markets are currently pricing a 75.2% probability of a rate hike at the December 9, 2026 FOMC meeting, pushing the federal funds rate from 3.75%–4.00% to 4.00%–4.25%, according to SoSoValue data. That is not a neutral backdrop for risk assets. A rate hike probability above 75% suggests the market is pricing tighter financial conditions ahead — historically unfavorable for BTC, particularly when on-chain demand is already contracting.
Key macro data releases due in the coming weeks — Nonfarm Payrolls on November 6, CPI on November 10, and PPI on November 13 — will either reinforce or complicate that rate trajectory. A hotter-than-expected CPI or payrolls print would strengthen the case for December tightening. BTC has rarely performed well heading into rate hikes when demand metrics are simultaneously deteriorating. Readers tracking prior analyses of Bitcoin’s structural positioning can reference the Bitcoin Power Law Oscillator at 34.5 for the longer-term valuation context, and Bitcoin Whale Sell-Off at $87K for the prior whale-level analysis that preceded this current range.
The Levels That Matter Now
CryptoQuant’s published note is explicit about the recovery conditions. According to XWIN Japan, watch $76,600–$76,700 as the immediate support zone. A sustained recovery requires reclaiming $77,100–$77,200 first, then $77,400–$77,600 — and that reclaim must be accompanied by two simultaneous conditions: easing liquidations and sustained spot buying. One without the other will not be sufficient. The 1–3 month holder cost basis at $77,140 makes that $77,100–$77,200 zone doubly significant — it is both a technical reclaim level and a cost-basis crossover threshold.
The current price of $76,697 sits at the edge of that $76,600–$76,700 support. A loss of that zone with no improvement in spot buying would remove the last near-term floor the analyst identifies. Conversely, a move back above $77,200 alongside measurable easing in liquidation pressure would be the first signal that the rebound has structural support rather than just technical relief.
The on-chain regime is clear. Apparent demand is negative and below its 30-day average. Long liquidations account for 70% of $100 million in 24-hour BTC liquidations. ETF outflows hit $398.6M in a single session. And BTC has failed every recovery attempt above $79,000 this cycle. The question is not whether spot buying exists — the note confirms it does. The question is whether it can scale fast enough to absorb the structural selling. At $76,697, it has not yet answered that. Watch $76,600 as the line that separates a hold from an accelerated breakdown, and $77,200 as the minimum reclaim needed to shift the short-term bias.
Source: x.comFrequently Asked Questions
What is Bitcoin’s Apparent Demand indicator and why does it matter now?
Why did Bitcoin fail to hold its rebound above $78,700 on November 2?
What levels does CryptoQuant say BTC must reclaim for a real recovery?
How significant are the Bitcoin ETF outflows alongside this on-chain weakness?
Source: CryptoQuant · Published by CoinsProbe Markets Desk
The opinions and market insights shared on CoinsProbe represent the views of individual authors based on prevailing market conditions at the time of publication. Cryptocurrency investments carry significant risk and volatility. Readers are encouraged to conduct their own research and seek professional financial advice before making investment decisions. CoinsProbe and its contributors do not accept responsibility for financial losses or decisions made based on published content.
CoinsProbe may publish sponsored articles, affiliate links, or promotional collaborations. All sponsored material is clearly labeled to maintain transparency with our audience. Our editorial decisions remain fully independent, and advertising partnerships do not influence reviews, rankings, or published opinions.
Since 2023, CoinsProbe has delivered reliable insights on cryptocurrency, blockchain, and digital assets. Our content is created by experienced researchers and analysts who follow strict editorial standards focused on accuracy, transparency, and credibility. Every article is carefully reviewed and verified using trusted sources and current market data. We provide unbiased analysis and timely updates covering everything from emerging crypto projects to major industry developments.