- Bitcoin trades at $65,224 — down 4.81% in 24 hours and 46% below its October 2025 all-time high above $126,000
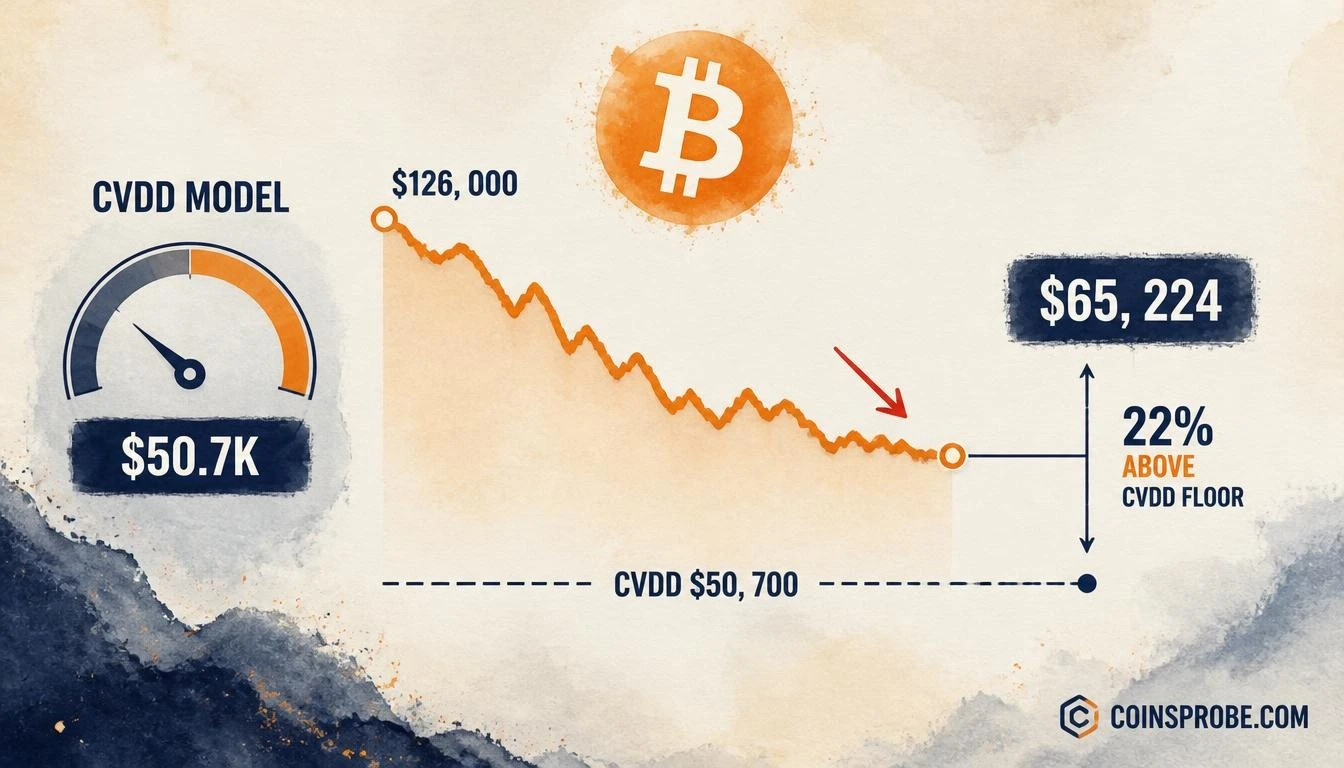
- Bitcoin's CVDD on-chain valuation model currently reads $50,700 — placing current price 22% above this long-term reference level
- U.S. spot Bitcoin ETFs recorded 5 consecutive outflow days totaling $1.07B, with IBIT alone shedding $143.5M on November 13
- Core PCE and GDP data due November 24 are the nearest macro catalysts that could shift rate expectations and risk appetite
Bitcoin is trading at $65,224 — down 4.81% in the past 24 hours and roughly 46% below its October 2025 record above $126,000 — as a confluence of institutional outflows, leveraged liquidations, and tightening macro conditions compresses price toward territory not seen since August. Market cap stands at approximately $1.31 trillion. Against this backdrop, one specific on-chain valuation model is drawing attention: Bitcoin’s CVDD is currently registering $50,700.
An on-chain analyst flagged the reading with deliberate brevity: “$BTC CVDD is currently at $50.7k — Just so you know.” The absence of a price target or directional call is intentional. CVDD is not a buy signal. It is a long-term valuation reference — one that has historically corresponded with generational accumulation zones, not imminent price floors. At $65,224, Bitcoin sits $14,524 above that level, or approximately 22% higher.
What CVDD Actually Measures
The Cumulative Value-Days Destroyed (CVDD) is a long-term on-chain pricing model that estimates Bitcoin’s “fair value” based on the aggregate economic weight of coins moving on-chain. Specifically, it tracks the cumulative sum of coin age destroyed — expressed in dollar terms — divided by the total supply. When a Bitcoin that has been dormant for years finally moves, it destroys a large quantity of coin-days. CVDD accumulates those destruction events over time, normalizing the metric into a single price level that reflects the weighted historical cost basis of all on-chain economic activity.
The critical point: CVDD moves continuously with on-chain activity. It is not a fixed level. The $50,700 reading cited by the analyst represents the current model output — but that figure will migrate upward over time as new coin-day destruction events are recorded. It is a dynamic floor estimate, not a static support zone. Some data aggregators have reported the same metric at a slightly different reading of approximately $52,700, reflecting the sensitivity of the model to different chain-state snapshots. Both figures point to the same structural range.
The Selloff Behind the Signal
The CVDD reading arrives during one of the sharper correction phases of this cycle. Bitcoin’s descent from above $126,000 to current levels has been accompanied by a measurable deterioration in institutional demand signals. Data via SoSoValue shows U.S. spot Bitcoin ETFs have recorded 5 consecutive outflow days, with a combined net outflow of $1.07 billion over that stretch. On the most recent trading session logged (November 13), the daily net outflow reached $185.5 million — with IBIT alone accounting for $143.5 million of that figure and FBTC contributing an additional $41.9 million.
Total ETF net assets now stand at $86.20 billion, down from cycle highs, while cumulative net inflows since launch remain positive at $54.63 billion — indicating the institutional base has not structurally exited, but near-term appetite has cooled. Broader derivatives markets have been equally unforgiving: approximately $1.6 billion in crypto liquidations — predominantly leveraged long positions — contributed to the velocity of the decline. For context on how the 200-day SMA has historically functioned as a technical anchor during similar compression phases, see Bitcoin Holds the 200-Day SMA — Is the Dip-Buying Window Closing?
CVDD as a Cycle Context Tool — Not a Price Trigger
Historically, CVDD has tracked closely with Bitcoin’s major bear market lows. During the 2018–2019 cycle bottom, CVDD provided a credible lower bound estimate. During the 2022 cycle bottom near $15,500, CVDD was significantly below the actual price bottom, illustrating that price does not need to reach CVDD to form a cyclical low — the model represents an extreme valuation compression scenario, not a guaranteed test zone.
What the current $50,700 reading communicates is structural: even after a 46% drawdown from all-time highs, Bitcoin remains 22% above the level at which the on-chain model would characterize price as historically undervalued relative to the cumulative economic activity of the network. That gap is not a floor — it is a reference. If ETF flows, stablecoin liquidity, and derivatives positioning stabilize at current levels, price may well consolidate without approaching CVDD. If risk-off conditions deepen, the model provides context for where long-term on-chain valuation becomes historically extreme. For a comparison of how similar drawdown phases resolved in prior cycles, see Bitcoin 2023 vs 2026 — Is the 200-Day SMA Hold the Dip-Buy Signal?
Macro Backdrop — FOMC and Upcoming Data
The macro context is not straightforwardly bearish. Markets are currently pricing an 88.5% probability of a Federal Reserve hold at the December 9 FOMC meeting, maintaining the funds rate at 4.00%–4.25%, according to SoSoValue data. The January 27, 2027 meeting presents a more complex picture: a 68.1% probability of a hike to 4.25%–4.50% is currently priced, with only a 23.5% probability of a continued hold. That forward pricing — the expectation of further tightening in early 2027 — is part of what is suppressing risk appetite now. Bitget CEO Gracy Chen has noted that extreme fear conditions may be approaching stabilization and that any December rate cut or dovish pivot could support crypto liquidity in the near term.
Near-term macro catalysts remain active: Retail Sales (MoM) is due November 16, Initial Jobless Claims on November 18, and Core PCE alongside GDP (QoQ) on November 24. Any material surprise in Core PCE — the Fed’s preferred inflation gauge — will directly influence rate expectations and therefore risk asset positioning heading into December.
Strategy (MicroStrategy) has continued accumulating through the drawdown. Per SoSoValue data, the firm now holds 850,364 BTC as of November 9, 2026, with its most recent disclosed purchase of 1,036 BTC for $81.9 million and 2,114 BTC acquired over the past three weeks for $169.5 million total. That sustained corporate demand provides a structural demand signal even as ETF flows turn negative.
What the CVDD Reading Says — and What It Doesn’t
What it says: At $50,700, CVDD identifies the level at which Bitcoin’s on-chain economic weight, aggregated across all coin-day destruction events in the asset’s history, implies historically deep undervaluation. Bitcoin is currently trading 22% above that reference.
What it doesn’t say: CVDD does not predict that Bitcoin will reach $50,700. It does not function as a support level, a buy trigger, or a price target. It is a dynamic model output that shifts with on-chain activity. The metric cannot determine when — or whether — price will test this zone.
What to watch for stabilization: A reversal in the 5-day ETF outflow streak, stablecoin liquidity expansion on major chains, and a reduction in leveraged long exposure via derivatives positioning. All three would need to inflect before the technical and on-chain picture shifts from compression to accumulation. For prior analysis of how Bitcoin has behaved at key moving averages during comparable periods, see Bitcoin Hits the EMA200 — Analyst’s Predicted Target Reached at $77,676.
The CVDD at $50,700 is not a forecast. It is a coordinate — one that tells long-term participants exactly how far Bitcoin would need to fall before on-chain valuation reaches historically extreme compression. At $65,224, that remains a significant distance away. Watch the ETF flow reversal and Core PCE on November 24 as the two most immediate macro-level reads on whether the current risk-off phase is approaching exhaustion.
Source: x.comFrequently Asked Questions
What is Bitcoin’s CVDD and why does the $50,700 reading matter?
Does Bitcoin reaching its CVDD level mean a bear market bottom is confirmed?
How much have Bitcoin ETFs seen in outflows during the current selloff?
What macro events could shift Bitcoin’s trajectory in the near term?
Source: Cryptobullet1 · Published by CoinsProbe Markets Desk
The opinions and market insights shared on CoinsProbe represent the views of individual authors based on prevailing market conditions at the time of publication. Cryptocurrency investments carry significant risk and volatility. Readers are encouraged to conduct their own research and seek professional financial advice before making investment decisions. CoinsProbe and its contributors do not accept responsibility for financial losses or decisions made based on published content.
CoinsProbe may publish sponsored articles, affiliate links, or promotional collaborations. All sponsored material is clearly labeled to maintain transparency with our audience. Our editorial decisions remain fully independent, and advertising partnerships do not influence reviews, rankings, or published opinions.
Since 2023, CoinsProbe has delivered reliable insights on cryptocurrency, blockchain, and digital assets. Our content is created by experienced researchers and analysts who follow strict editorial standards focused on accuracy, transparency, and credibility. Every article is carefully reviewed and verified using trusted sources and current market data. We provide unbiased analysis and timely updates covering everything from emerging crypto projects to major industry developments.