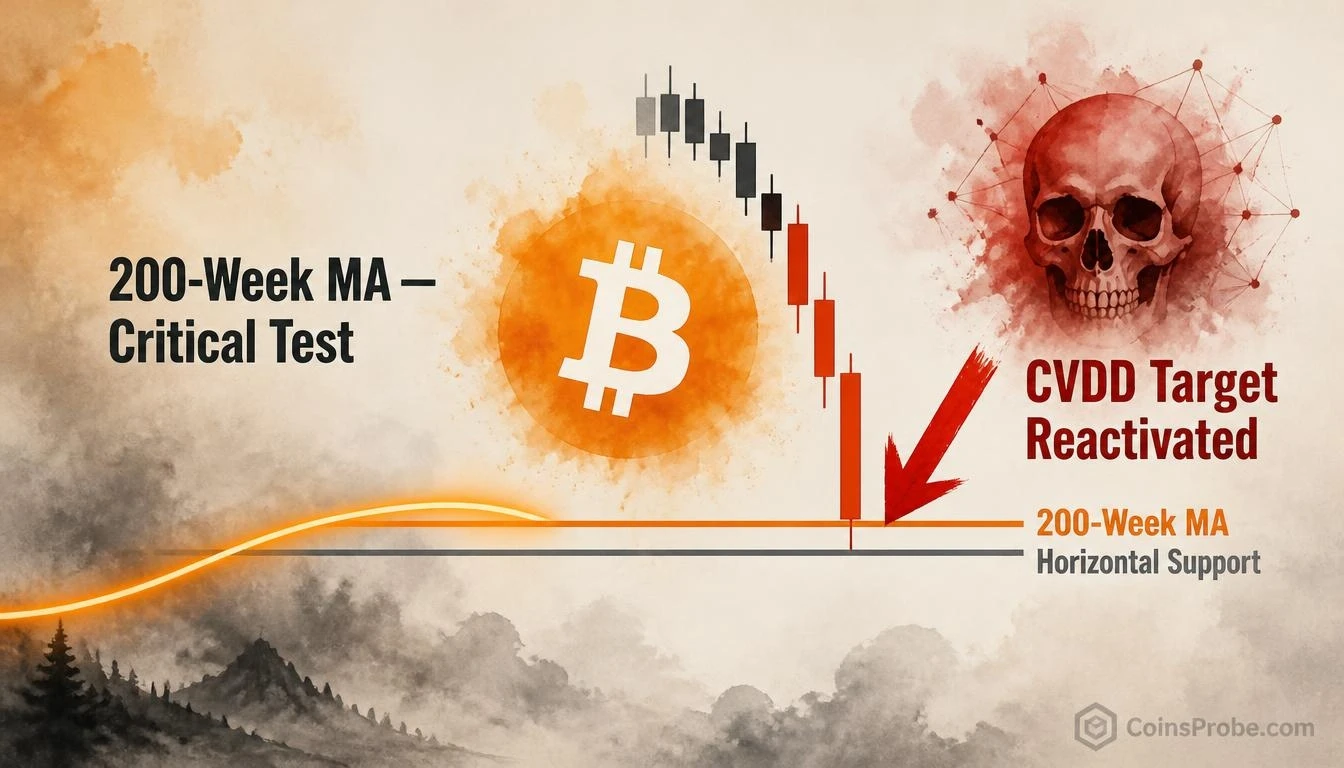
- BTC is trading at $65,869 — down 4.37% in 24 hours — testing the 200-Week MA and horizontal support simultaneously
- An analyst warns: a weekly close below the 200-Week MA reactivates the CVDD (Cumulative Value Days Destroyed) downside target
- Spot Bitcoin ETFs logged 5 consecutive outflow days totaling $1.07B, with IBIT alone shedding $143.5M on Nov 13 per SoSoValue
- FOMC pricing shows 68.1% probability of a rate hike at the Jan 27 meeting — tightening risk re-entering the picture
Bitcoin is testing the most closely watched long-term moving average in its history — and it is doing so from the wrong side. At the time of writing, BTC is trading at approximately $65,869, down 4.37% in the past 24 hours, with a market cap of $1.32 trillion. The 200-Week Moving Average, the line that has historically separated bull markets from structural bear markets, is now under direct assault — and the weekly candle has not yet closed.
An analyst flagged the situation with unusual directness: Bitcoin is losing the 200-Week MA, and the horizontal support that has converged with it may not hold. The condition is explicit — if the weekly candle closes below the 200-Week MA, the CVDD (Cumulative Value Days Destroyed) downside target returns to the table.
The 200-Week MA — What It Is and Why This Test Is Different
The 200-Week Moving Average is a simple average of Bitcoin’s closing price across the prior 200 weekly candles — roughly four years of price history compressed into a single line. It moves slowly, almost glacially, which is precisely what makes it meaningful. It filters out noise. Every bear market cycle in Bitcoin’s history has found buyers at or above this level. It has never been decisively broken on a weekly closing basis during a cycle that subsequently recovered without first producing an extreme low.
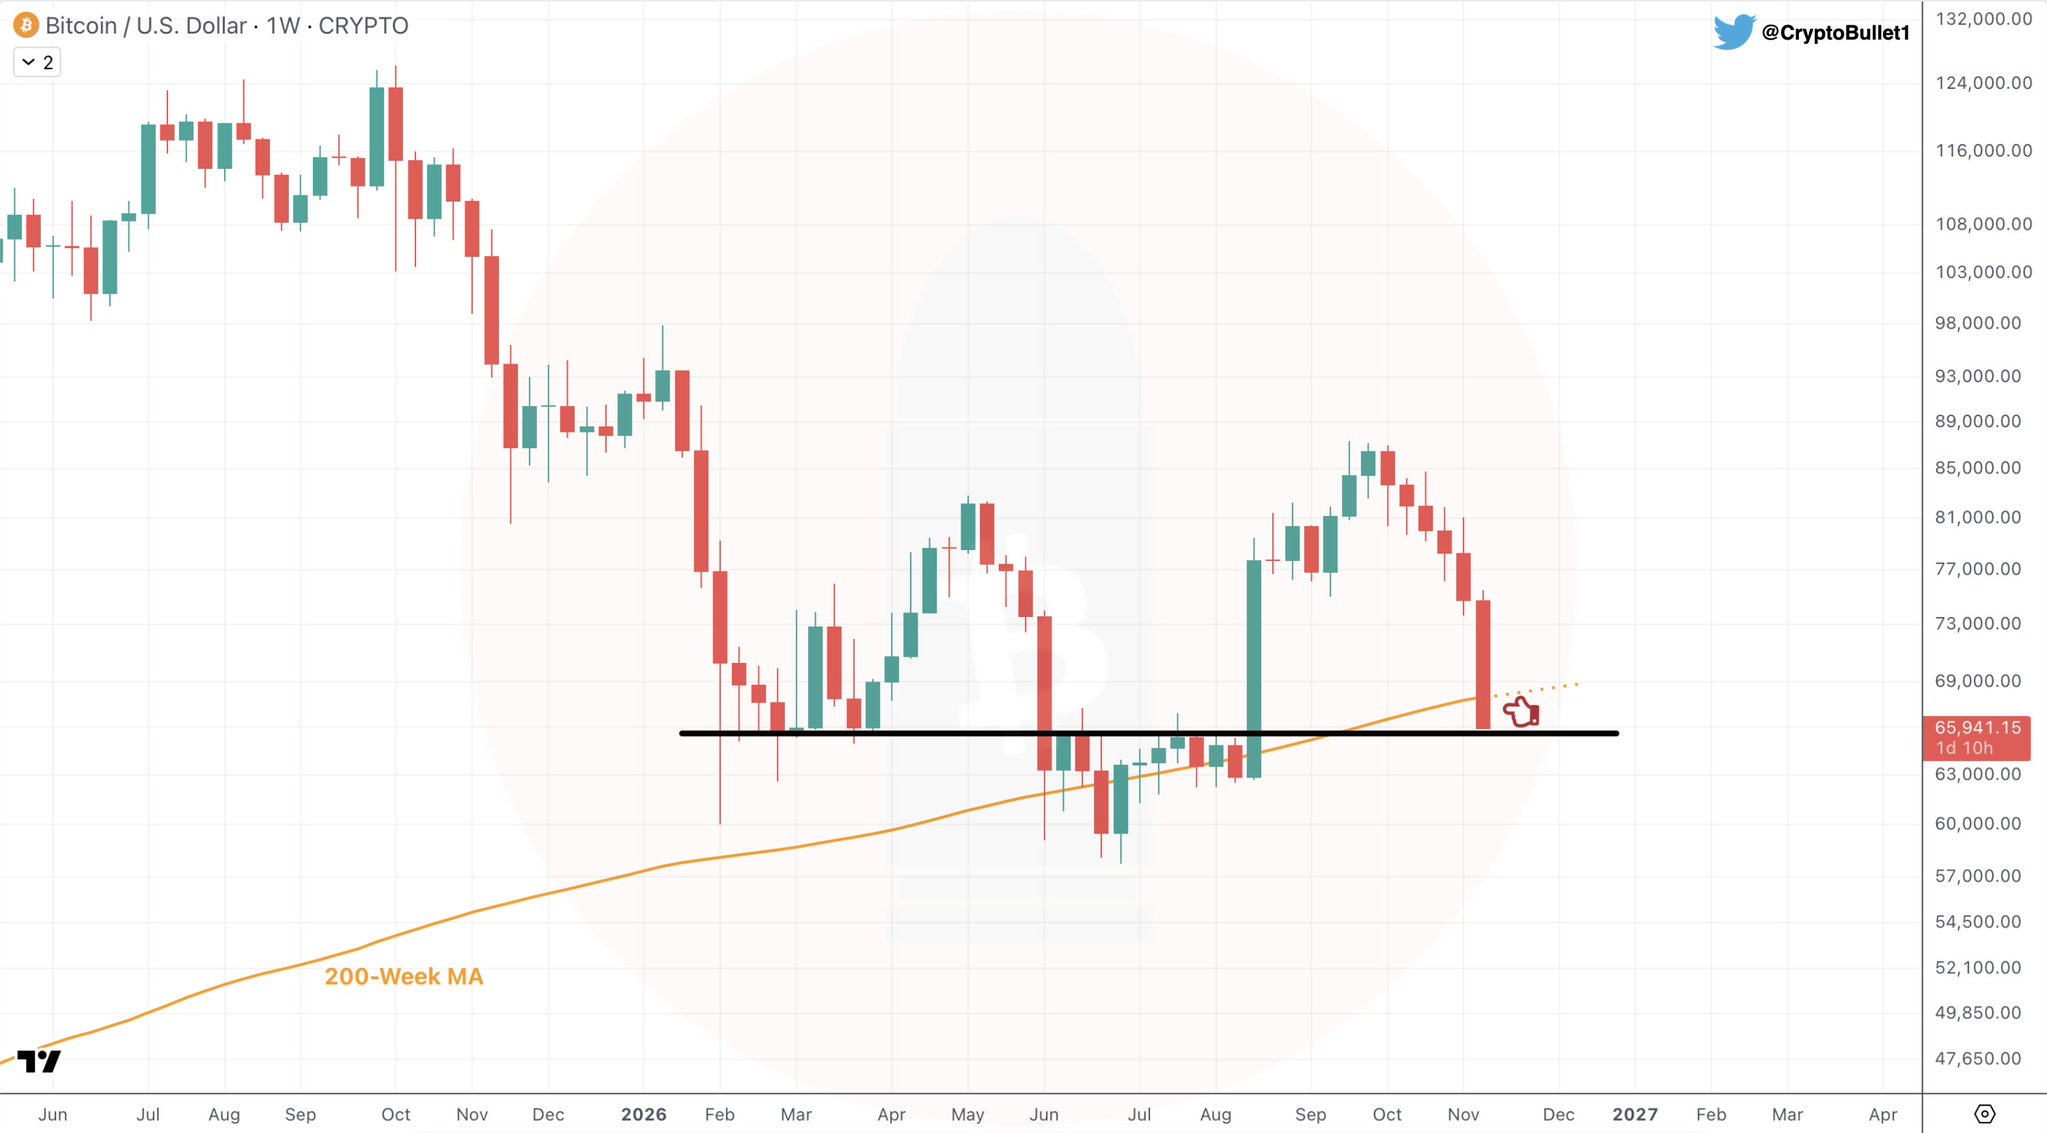
What the chart shared by the analyst reveals is a double convergence: price is simultaneously testing the 200-Week MA and a horizontal support level that has held across multiple prior retests. The chart shows a rounded distribution top followed by a sharp declining weekly candle now pressing directly into this confluence zone. The price label on the chart reads 65,941.15, with 1 day and 10 hours remaining in the current weekly candle — meaning the close that determines the signal has not yet printed.
The pattern status on the chart is unambiguous: breakdown confirmed. Price is at the 200-Week MA and at the horizontal support simultaneously. The question the analyst is asking is not whether the test is happening — it is whether the weekly close will confirm a structural break.
The CVDD — What Gets Activated if the Weekly Close Fails
CVDD, or Cumulative Value Days Destroyed, is an on-chain valuation model that estimates the minimum fair value of Bitcoin by tracking the cumulative destruction of coin-days. When a Bitcoin that has not moved for a long time finally moves, it destroys coin-days proportional to its age and size. The CVDD aggregates this destruction over time and translates it into a price floor estimate — a level below which selling pressure historically exhausts itself because the most patient, longest-held coins have already been redistributed.
Historically, the CVDD has marked generational lows. It has been reached only at cycle bottoms — including the 2018–2019 bottom and the 2022 capitulation low. The analyst has referenced a CVDD target in prior analysis, which implies that if the 200-Week MA fails as support on a weekly close, the next meaningful on-chain anchor is not a moving average or a chart level — it is a model-derived floor that sits materially lower than the current price. No specific CVDD price level was stated in the analyst’s post; it is a prior-identified target being reactivated, not a new one being introduced.
This matters for context. The 200-Week MA is not just a technical level — it is the boundary between a regime where long-term holders are still in profit on average and one where they are not. A confirmed weekly close below it would represent a structural condition, not merely a dip, and would justify referencing an on-chain model that prices in maximum fear. For further context on how Bitcoin’s longer-cycle patterns have historically behaved at this stage, see Bitcoin Midterm Cycle Pattern Repeats — 2014, 2018, 2022, and Now 2026.
ETF Flows Confirm Institutional Retreat
The technical pressure is not happening in isolation. Spot Bitcoin ETF data via SoSoValue shows five consecutive days of net outflows totaling $1.07 billion, with zero inflow days over that stretch. On the most recent trading day (November 13), net outflows reached $185.5M — led by IBIT at $143.5M and FBTC at $41.9M. Total ETF net assets now stand at $86.20B against a cumulative net inflow since launch of $54.63B, meaning the drawdown is compressing the cushion that institutional flows had built over the past year.
GBTC recorded zero flow on that day — neither inflow nor outflow — which is a neutral reading but notable in the context of broad institutional disengagement. The 24-hour trading volume across all spot ETFs was $2.59B, suggesting liquidity remains present even as the directional flow is negative. Strategy (MSTR) continues to accumulate — adding 1,036 BTC for $81.9M in its most recent purchase and 2,114 BTC over the past three weeks — but corporate treasury buying has historically been insufficient to arrest broad market drawdowns when ETF flow turns structurally negative.
Macro Backdrop — Rate Hike Risk Returns
The macro context adds further weight. FOMC rate probability data via SoSoValue shows the December 9 meeting is priced at 88.5% hold and 11.5% hike — relatively contained. But the January 27, 2027 meeting is a different picture: 68.1% probability of a hike to 4.25%–4.50%, with only 23.5% probability of a hold. That is a significant shift in expectations and represents a tightening bias returning to the foreground at the precise moment Bitcoin is testing its most critical long-term support.
Upcoming data releases through November 24 — including Retail Sales (Nov 16), Initial Jobless Claims (Nov 18), Services and Manufacturing PMI (Nov 22), and Core PCE alongside GDP (Nov 24) — could either amplify or dampen that rate hike expectation. A hot Core PCE print would increase hike probability further and remove one of the tailwinds that supported BTC’s recovery from prior lows. The relationship between global liquidity conditions and Bitcoin’s performance is documented further in Global M2 Has Stalled at $138T — What It Means for Bitcoin.
The Weekly Close Is the Only Number That Matters Right Now
The analyst’s framework is conditional, not declarative. The bearish trigger is a weekly close below the 200-Week MA — not an intraday breach, not a 24-hour candle, not a spot price touch. This precision is intentional. Weekly closes carry weight precisely because they filter out intraday manipulation and wick-based liquidity sweeps. BTC has tagged the 200-Week MA intraday during prior cycles without confirming a structural breakdown on a weekly close basis.
That said, the chart confirms the breakdown is in progress. Price is at the MA and at the horizontal support. The candle is not yet closed. If it closes here or lower, the analyst’s condition is met and the CVDD model re-enters the picture as the next meaningful reference. If a recovery materializes before the weekly close and price reclaims ground above the MA, the signal is cancelled and the horizontal support will have held its most significant test yet. The prior article tracking this exact dynamic — Bitcoin Loses 200-Day MA — The 200-Week MA Is Now the Last Line — provides the structural context for why this level carries the weight it does.
The 200-Week MA has never permanently failed in Bitcoin’s history. But the analyst’s point is that the cost of assuming it will hold again — without waiting for the weekly close to confirm — is precisely the kind of conviction that gets traders offside at structural turning points.
Watch the weekly close at the 200-Week MA. That single data point determines whether this is another successful defense of long-term support or the activation of a materially lower on-chain target.
Frequently Asked Questions
What is the 200-Week Moving Average and why does it matter for Bitcoin?
What is the CVDD target the analyst is referencing?
Why does the weekly close matter more than the current intraday price?
What do spot ETF outflows tell us about institutional sentiment right now?
Source: Cryptobullet1 · Published by CoinsProbe Markets Desk
The opinions and market insights shared on CoinsProbe represent the views of individual authors based on prevailing market conditions at the time of publication. Cryptocurrency investments carry significant risk and volatility. Readers are encouraged to conduct their own research and seek professional financial advice before making investment decisions. CoinsProbe and its contributors do not accept responsibility for financial losses or decisions made based on published content.
CoinsProbe may publish sponsored articles, affiliate links, or promotional collaborations. All sponsored material is clearly labeled to maintain transparency with our audience. Our editorial decisions remain fully independent, and advertising partnerships do not influence reviews, rankings, or published opinions.
Since 2023, CoinsProbe has delivered reliable insights on cryptocurrency, blockchain, and digital assets. Our content is created by experienced researchers and analysts who follow strict editorial standards focused on accuracy, transparency, and credibility. Every article is carefully reviewed and verified using trusted sources and current market data. We provide unbiased analysis and timely updates covering everything from emerging crypto projects to major industry developments.