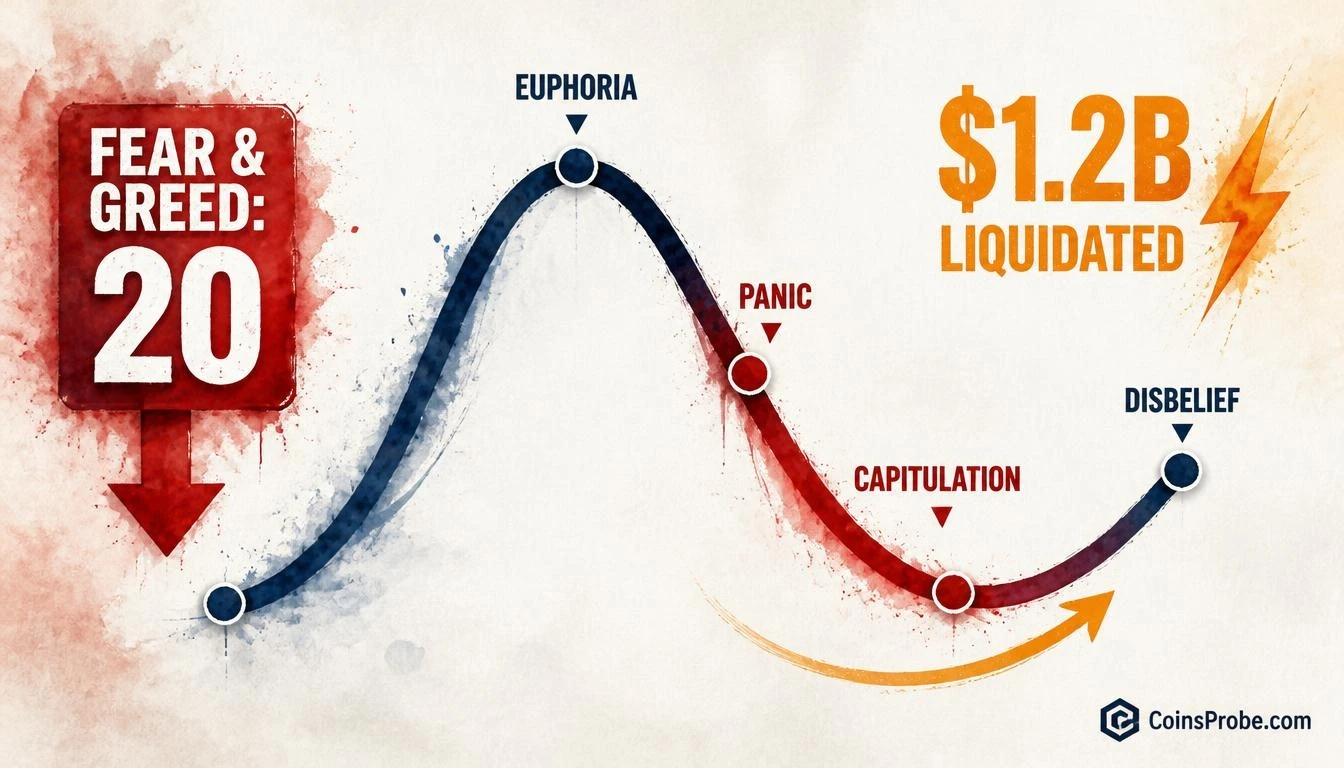

- Bitcoin briefly touched $67,568–$69,000 during the November 13–14 sell-off as Fear & Greed hit ~20
- Over $1.2 billion in derivatives liquidations occurred in 24 hours — 82.7% from long positions
- Total crypto market cap fell ~5.75% in one session driven by macro shock, not a protocol failure
- Fear & Greed Index readings at or below 20 have historically marked short-term sentiment troughs
Crypto markets are currently navigating one of their most psychologically demanding stretches of 2026. Bitcoin briefly touched the $67,568–$69,000 range during the November 13–14 sell-off, total crypto market capitalization fell roughly 5.75% in a single session, and the Fear & Greed Index collapsed to approximately 20 — Extreme Fear. In that environment, one analyst’s question cut through the noise: How are you feeling today?
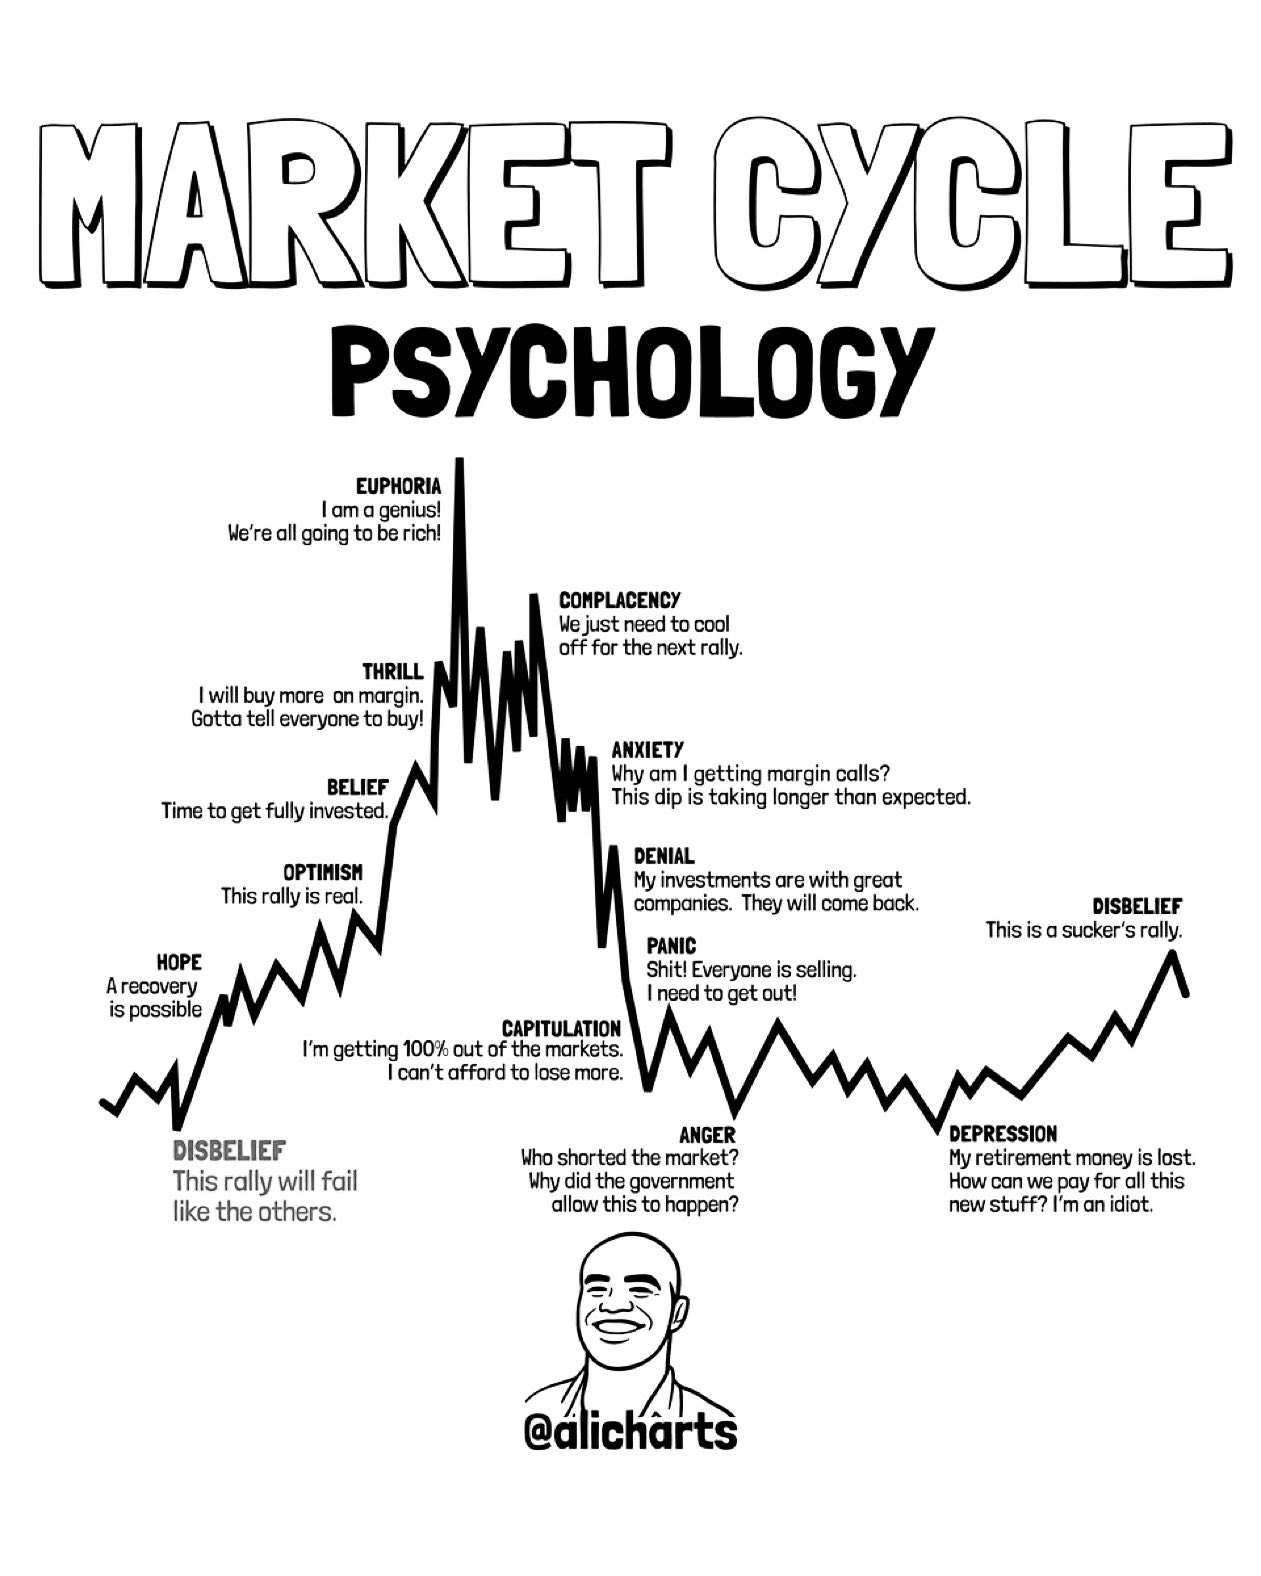
The question came attached to a classic market cycle psychology diagram — the kind that maps investor emotion from Euphoria through Panic, Capitulation, and Depression, before the long grind back through Disbelief toward the next cycle. The analyst shared it not as a trade signal, but as a mirror. The implication is direct: if you can locate yourself honestly on that curve, you gain an edge over traders who cannot.
The November Sell-Off — What Actually Happened
The mid-November drawdown was not a crypto-native event. Research points to a macro-driven liquidity shock as the primary catalyst: weak demand at a U.S. 30-year Treasury auction combined with a strengthening dollar, renewed geopolitical and trade tensions, and a sudden leadership shock at Nvidia that triggered cross-asset de-risking. These forces converged simultaneously.
The mechanism was leverage. As prices breached key Bitcoin technical levels, leveraged long positions were force-closed. Derivatives liquidations in a 24-hour window reportedly exceeded $1.2 billion, with longs accounting for 82.7% of that figure. Separate analyses put total long liquidations in the $1.3–$1.6 billion range across the broader event window. This was not a crypto-specific protocol failure — it was a forced unwind amplified by geopolitical risk and thin liquidity conditions.
Reading the Psychology Curve Against Current Sentiment
The market cycle psychology diagram identifies roughly a dozen emotional stages investors move through across a full bull-to-bear-to-bull rotation. The sequence runs: Optimism → Excitement → Thrill → Euphoria (the peak) → Complacency → Anxiety → Denial → Panic → Capitulation → Despondency → Depression → Hope → Relief → Optimism again.
With the Fear & Greed Index at 20 and Bitcoin printing a sharp intraday decline through the high-$60,000s, the current emotional zone — based on the data from the November event — sits somewhere between Anxiety and Panic. That is a critical distinction. Anxiety is the stage where participants are rattled but still holding. Panic is where forced selling accelerates regardless of fundamentals. The $1.2 billion+ in liquidations over 24 hours suggests at least a partial Panic flush occurred during the worst of the session.
Bitget CEO Gracy Chen noted publicly that a Fear & Greed reading near 20 may indicate sentiment stabilization beginning, and cited expectations of a December Federal Reserve rate cut as a potential recovery catalyst. That framing — looking for a floor near Capitulation — aligns with how the psychology diagram is typically used: not as a timing tool, but as a positioning framework. Traders who can identify Capitulation in real time are better positioned to begin scaling in rather than capitulating alongside the crowd.
Why Knowing Your Stage Matters More Than Knowing the Price
The market cycle psychology framework is non-directional by design. It does not predict where Bitcoin goes next. It does something more durable: it identifies the emotional regime the market is operating in, which determines how participants will react to the next price move.
At Anxiety, negative news produces outsized selling because confidence is fragile. At Despair or Depression, negative news barely moves the price — the sellers are already out. At Disbelief, rallies are sold aggressively because participants assume the uptrend is false. Each stage produces a different trading environment, and misreading your own emotional stage is one of the most common sources of timing error in markets.
This connects directly to the broader market cycle analysis covered in Gold at the Anger Stage — Is the Market Cycle Bottom Already Forming?, which examines how traditional assets are navigating their own psychological reset at the same time crypto is under pressure. The simultaneous stress across asset classes in mid-November — Treasuries, equities, crypto — is itself a signal: multi-asset fear of this magnitude tends to cluster near capitulation events, not mid-cycle corrections.
What the Data Says About Capitulation vs. Continuation
Three data points from the November 13–14 event are worth anchoring:
- $1.2–$1.6 billion in derivatives liquidations, 82.7% from longs — a forced flush, not a voluntary exit
- Fear & Greed Index: ~20 — a reading consistent with prior macro-driven fear troughs
- ~5.75% total crypto market cap decline in a single session — sharp but not unprecedented in macro shock scenarios
Historically, Fear & Greed readings at or below 20 have marked short-to-medium term sentiment troughs rather than the beginning of extended downtrends. That does not make them precise entry signals — the index can remain in extreme fear for weeks during prolonged macro uncertainty. But it does change the probability distribution of outcomes. The question is whether the macro headwinds — dollar strength, Treasury auction weakness, geopolitical risk — have fully repriced or are still unwinding.
The Practical Application
The psychology diagram works best as a self-audit tool, not a market timer. The practical question it forces is: Am I making decisions based on price action and fundamentals, or based on how I feel? During Panic and Capitulation phases, the answer for most participants is the latter — which is why those phases produce the largest forced dislocations from intrinsic value.
For the current environment, the honest answer for many retail participants is likely somewhere between Anxiety and Panic. The $1.2 billion liquidation event confirmed that levered participants were already past Anxiety — they were forced out. The question now is whether spot holders, who have more discretion, will follow or hold.
The Fear & Greed Index at 20 and the sharp macro-driven selloff suggest the market is in the later stages of a fear regime, not the early stages. That is not a buy signal — it is a framework observation. What would shift the read: a sustained recovery in the index above 40, stabilization in dollar/Treasury dynamics, and a confirmed Federal Reserve rate path providing macro clarity.
Watch the Fear & Greed Index’s recovery pace above 25 as the first indicator that the Panic stage has passed and Capitulation-to-Disbelief rotation has begun.
Frequently Asked Questions
What does a Fear & Greed Index reading of 20 historically mean for Bitcoin prices?
What caused the November 2026 crypto sell-off that prompted the psychology chart to circulate?
How do traders use the market cycle psychology diagram as a practical tool?
What metric would signal the Panic stage is ending and sentiment is recovering?
Source: Ali Charts · Published by CoinsProbe Markets Desk
The opinions and market insights shared on CoinsProbe represent the views of individual authors based on prevailing market conditions at the time of publication. Cryptocurrency investments carry significant risk and volatility. Readers are encouraged to conduct their own research and seek professional financial advice before making investment decisions. CoinsProbe and its contributors do not accept responsibility for financial losses or decisions made based on published content.
CoinsProbe may publish sponsored articles, affiliate links, or promotional collaborations. All sponsored material is clearly labeled to maintain transparency with our audience. Our editorial decisions remain fully independent, and advertising partnerships do not influence reviews, rankings, or published opinions.
Since 2023, CoinsProbe has delivered reliable insights on cryptocurrency, blockchain, and digital assets. Our content is created by experienced researchers and analysts who follow strict editorial standards focused on accuracy, transparency, and credibility. Every article is carefully reviewed and verified using trusted sources and current market data. We provide unbiased analysis and timely updates covering everything from emerging crypto projects to major industry developments.