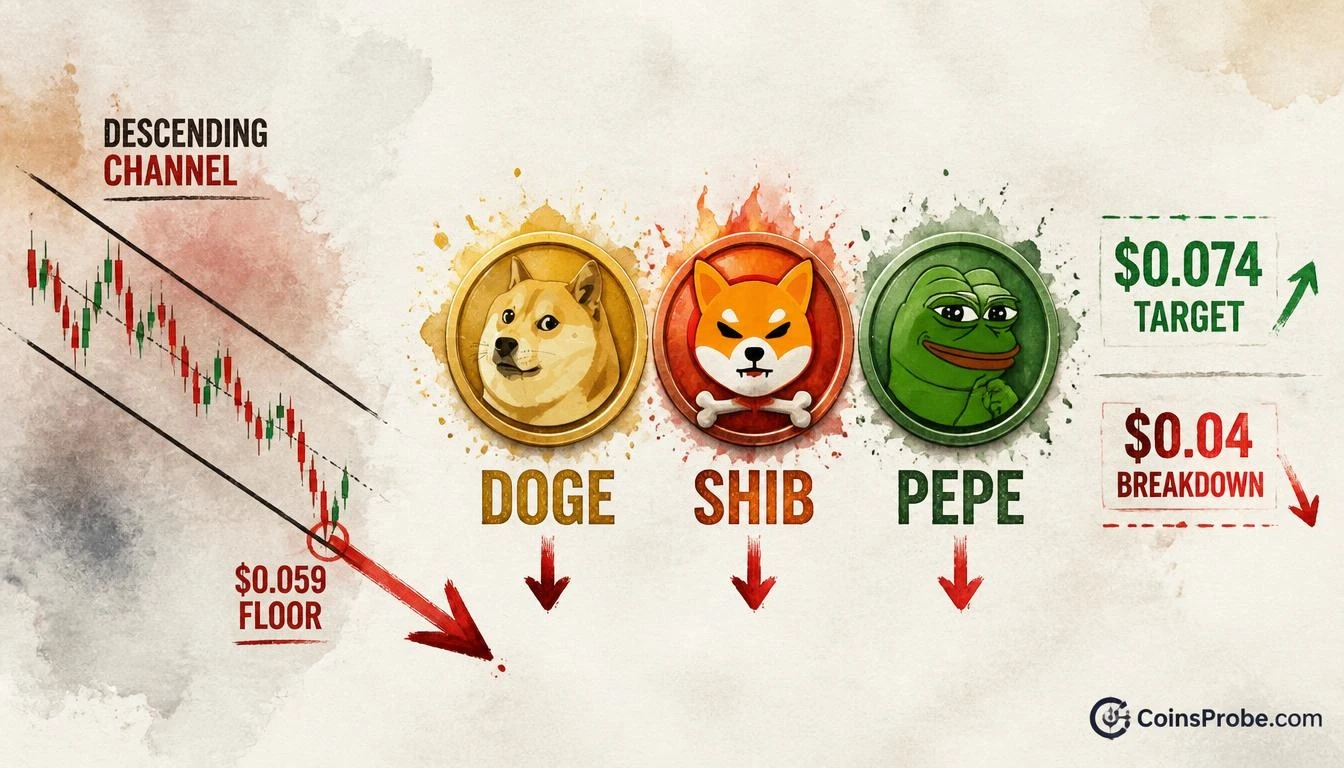

- DOGE down 40% since Sep 22 — from $0.10 to ~$0.06 — now pressing descending channel floor at $0.059
- SHIB off 34%, testing $0.0000042 horizontal support; PEPE at $0.0000044 symmetrical triangle trendline
- DOGE breakdown below $0.059 opens analyst's stated target of $0.04; hold targets $0.074 mid-channel
Dogecoin is trading at approximately $0.0000295 — down 24% in the past 24 hours, 6.9% over the past seven days, and 32.5% over the past 30 days. The memecoin sector is in a synchronized breakdown, and one analyst has mapped the exact structural levels where the sell-off either pauses or accelerates.
An analyst at @alicharts published a five-part thread on November 13, 2026, documenting the technical damage across DOGE, SHIB, and PEPE. The analysis identifies descending channel floors and triangle supports that now serve as the last structural defense before the next leg lower. The findings are chart-driven and level-specific — not sentiment commentary.
Signal 1 — DOGE: 40% Drop Since September 22, Now at $0.059 Channel Floor
Dogecoin has fallen roughly 40% since September 22, dropping from $0.10 to approximately $0.06. On the 3-day chart, price is pressing against the lower boundary of a descending channel — a structure defined by lower highs and lower lows with two parallel declining trendlines. The channel bottom sits near $0.059, which is the level the analyst identifies as the immediate decision point.
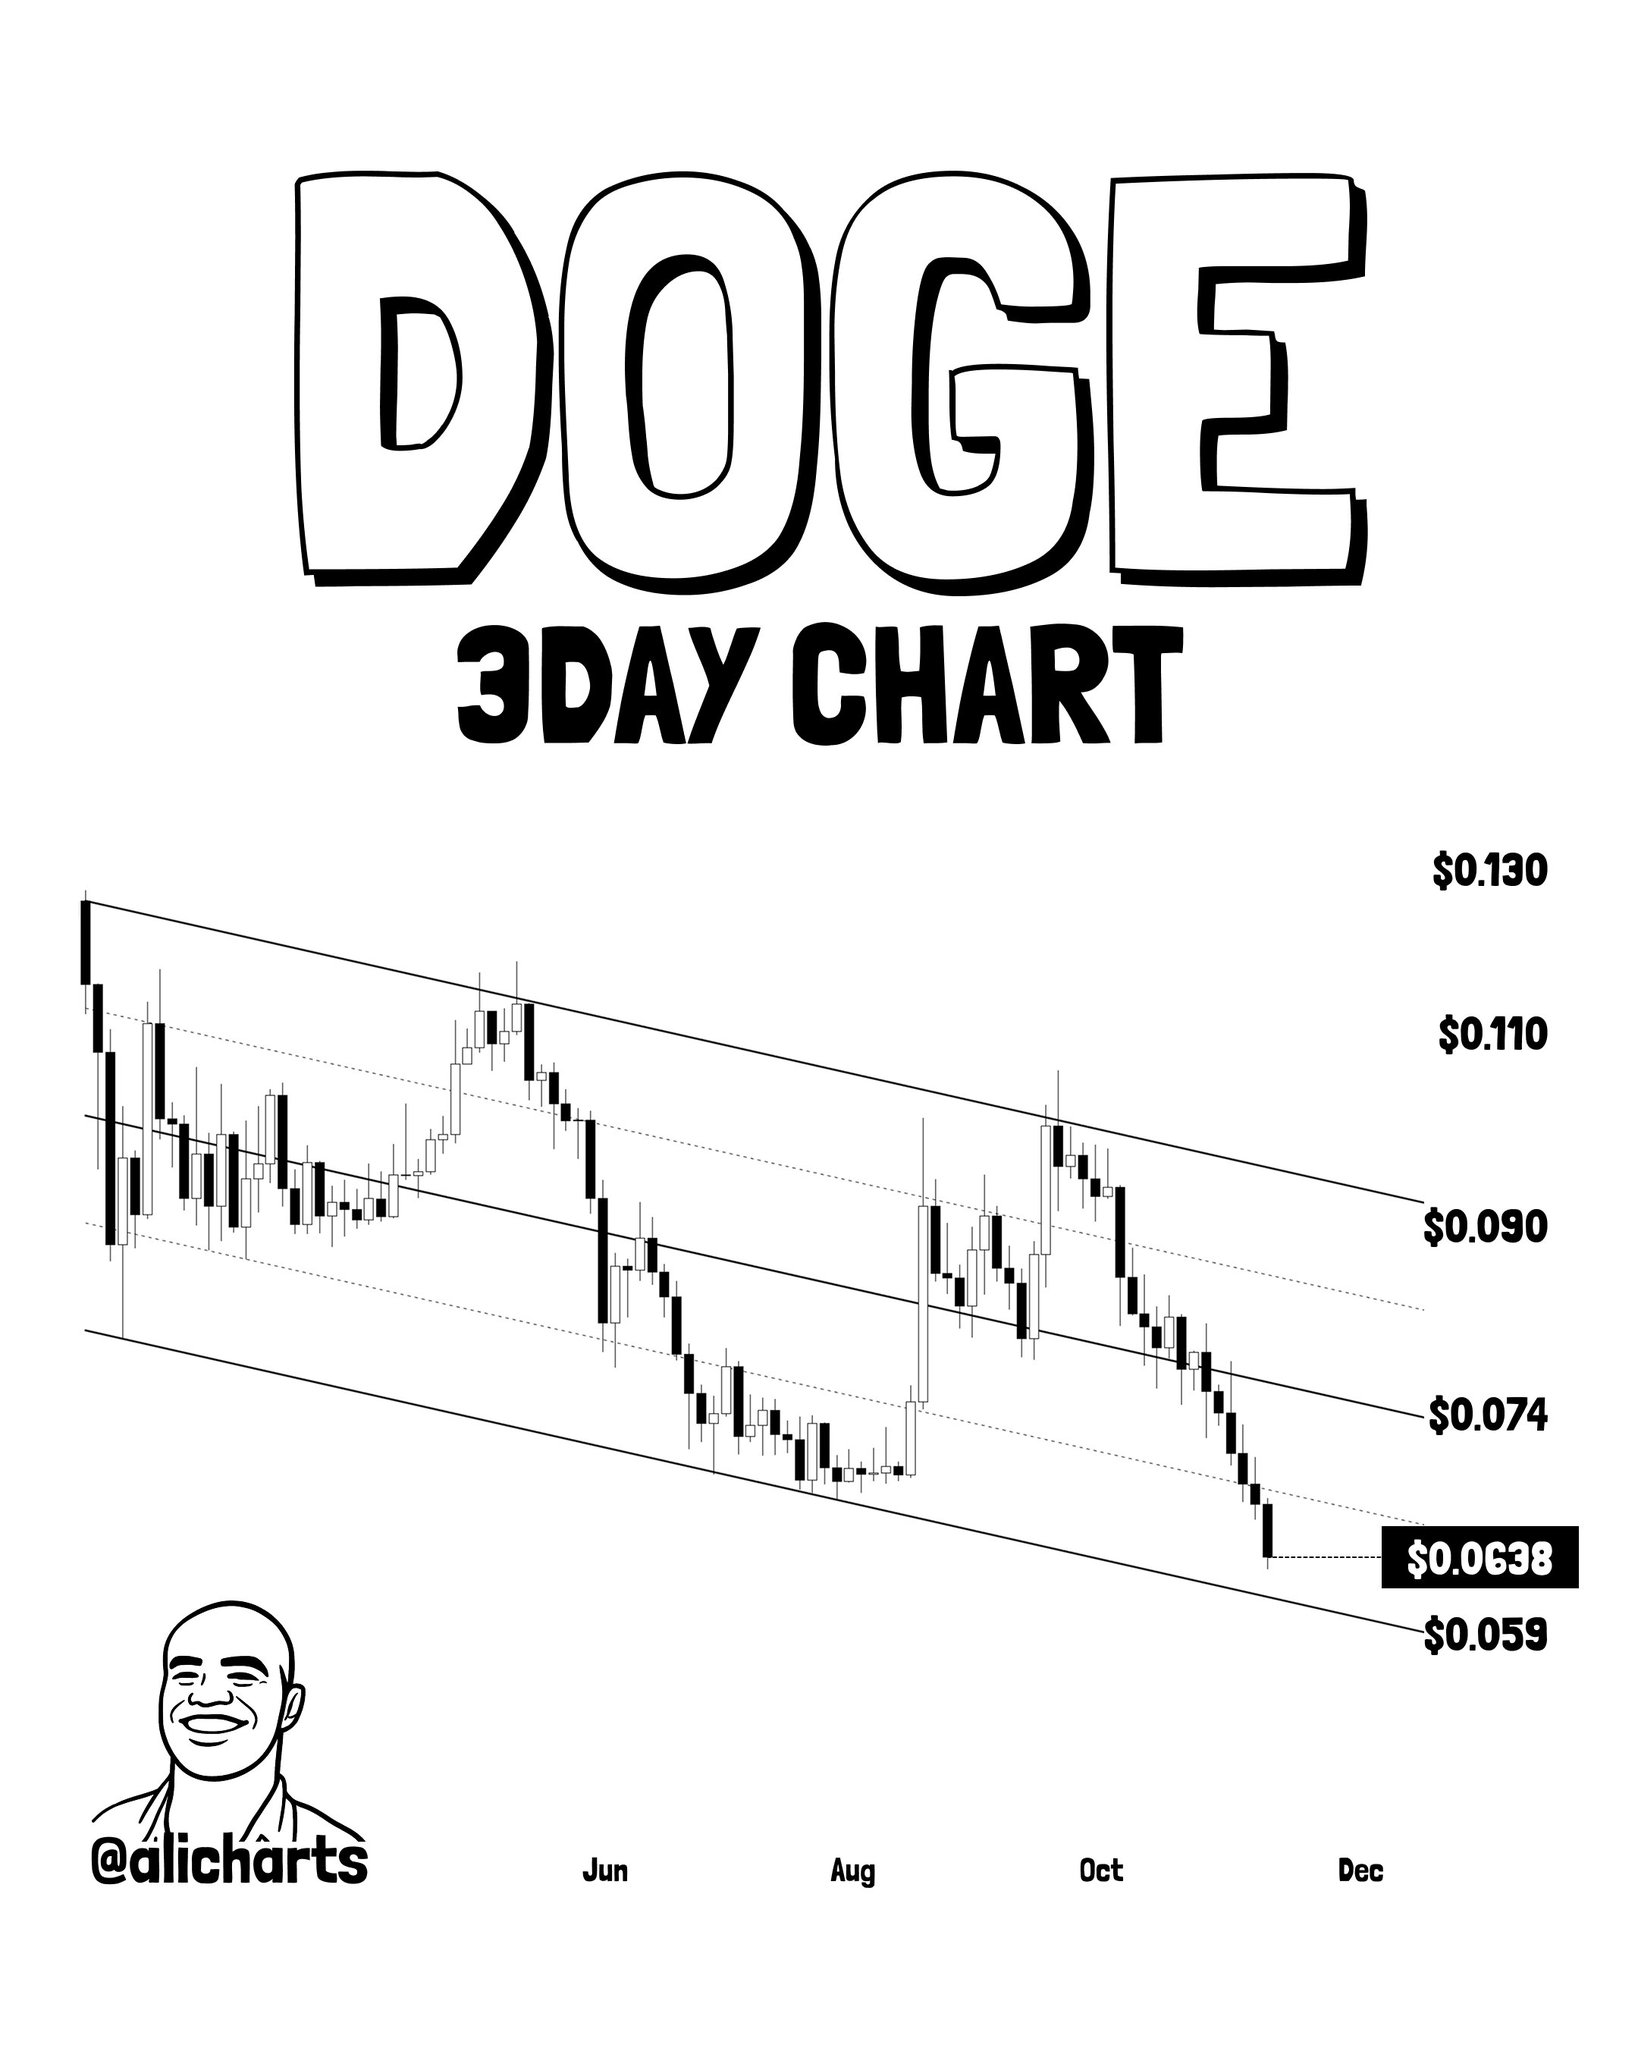
The 3-day chart shows price below $0.074, below $0.090, and currently at or just above the $0.059 channel floor. The analyst’s scenario is binary: if $0.059 holds, DOGE could rebound toward the channel’s mid-range near $0.074. If that support breaks, the next structural target is $0.04 — a further decline of roughly 32% from the channel floor. There are no printed percentage annotations on the chart itself; the 40% figure is from the analyst’s thread text.
The broader macro backdrop matters here. Global M2 has stalled at $138T, removing one of the liquidity tailwinds that speculative assets like memecoins depend on most. When risk appetite compresses at the macro level, low-utility tokens with no fee revenue or protocol fundamentals are typically the first to reprice.
Signal 2 — SHIB: 34% Correction, Testing $0.0000042 Horizontal Support
Shiba Inu has corrected roughly 34% and is approaching the bottom of its own channel structure on the 3-day chart. The chart shows a sequence of lower highs from June through October, with the most recent candles pressing toward the bottom horizontal line at $0.0000042. Intermediate dotted reference levels sit at $0.0000047 and $0.0000053, with upper resistance at $0.0000064.
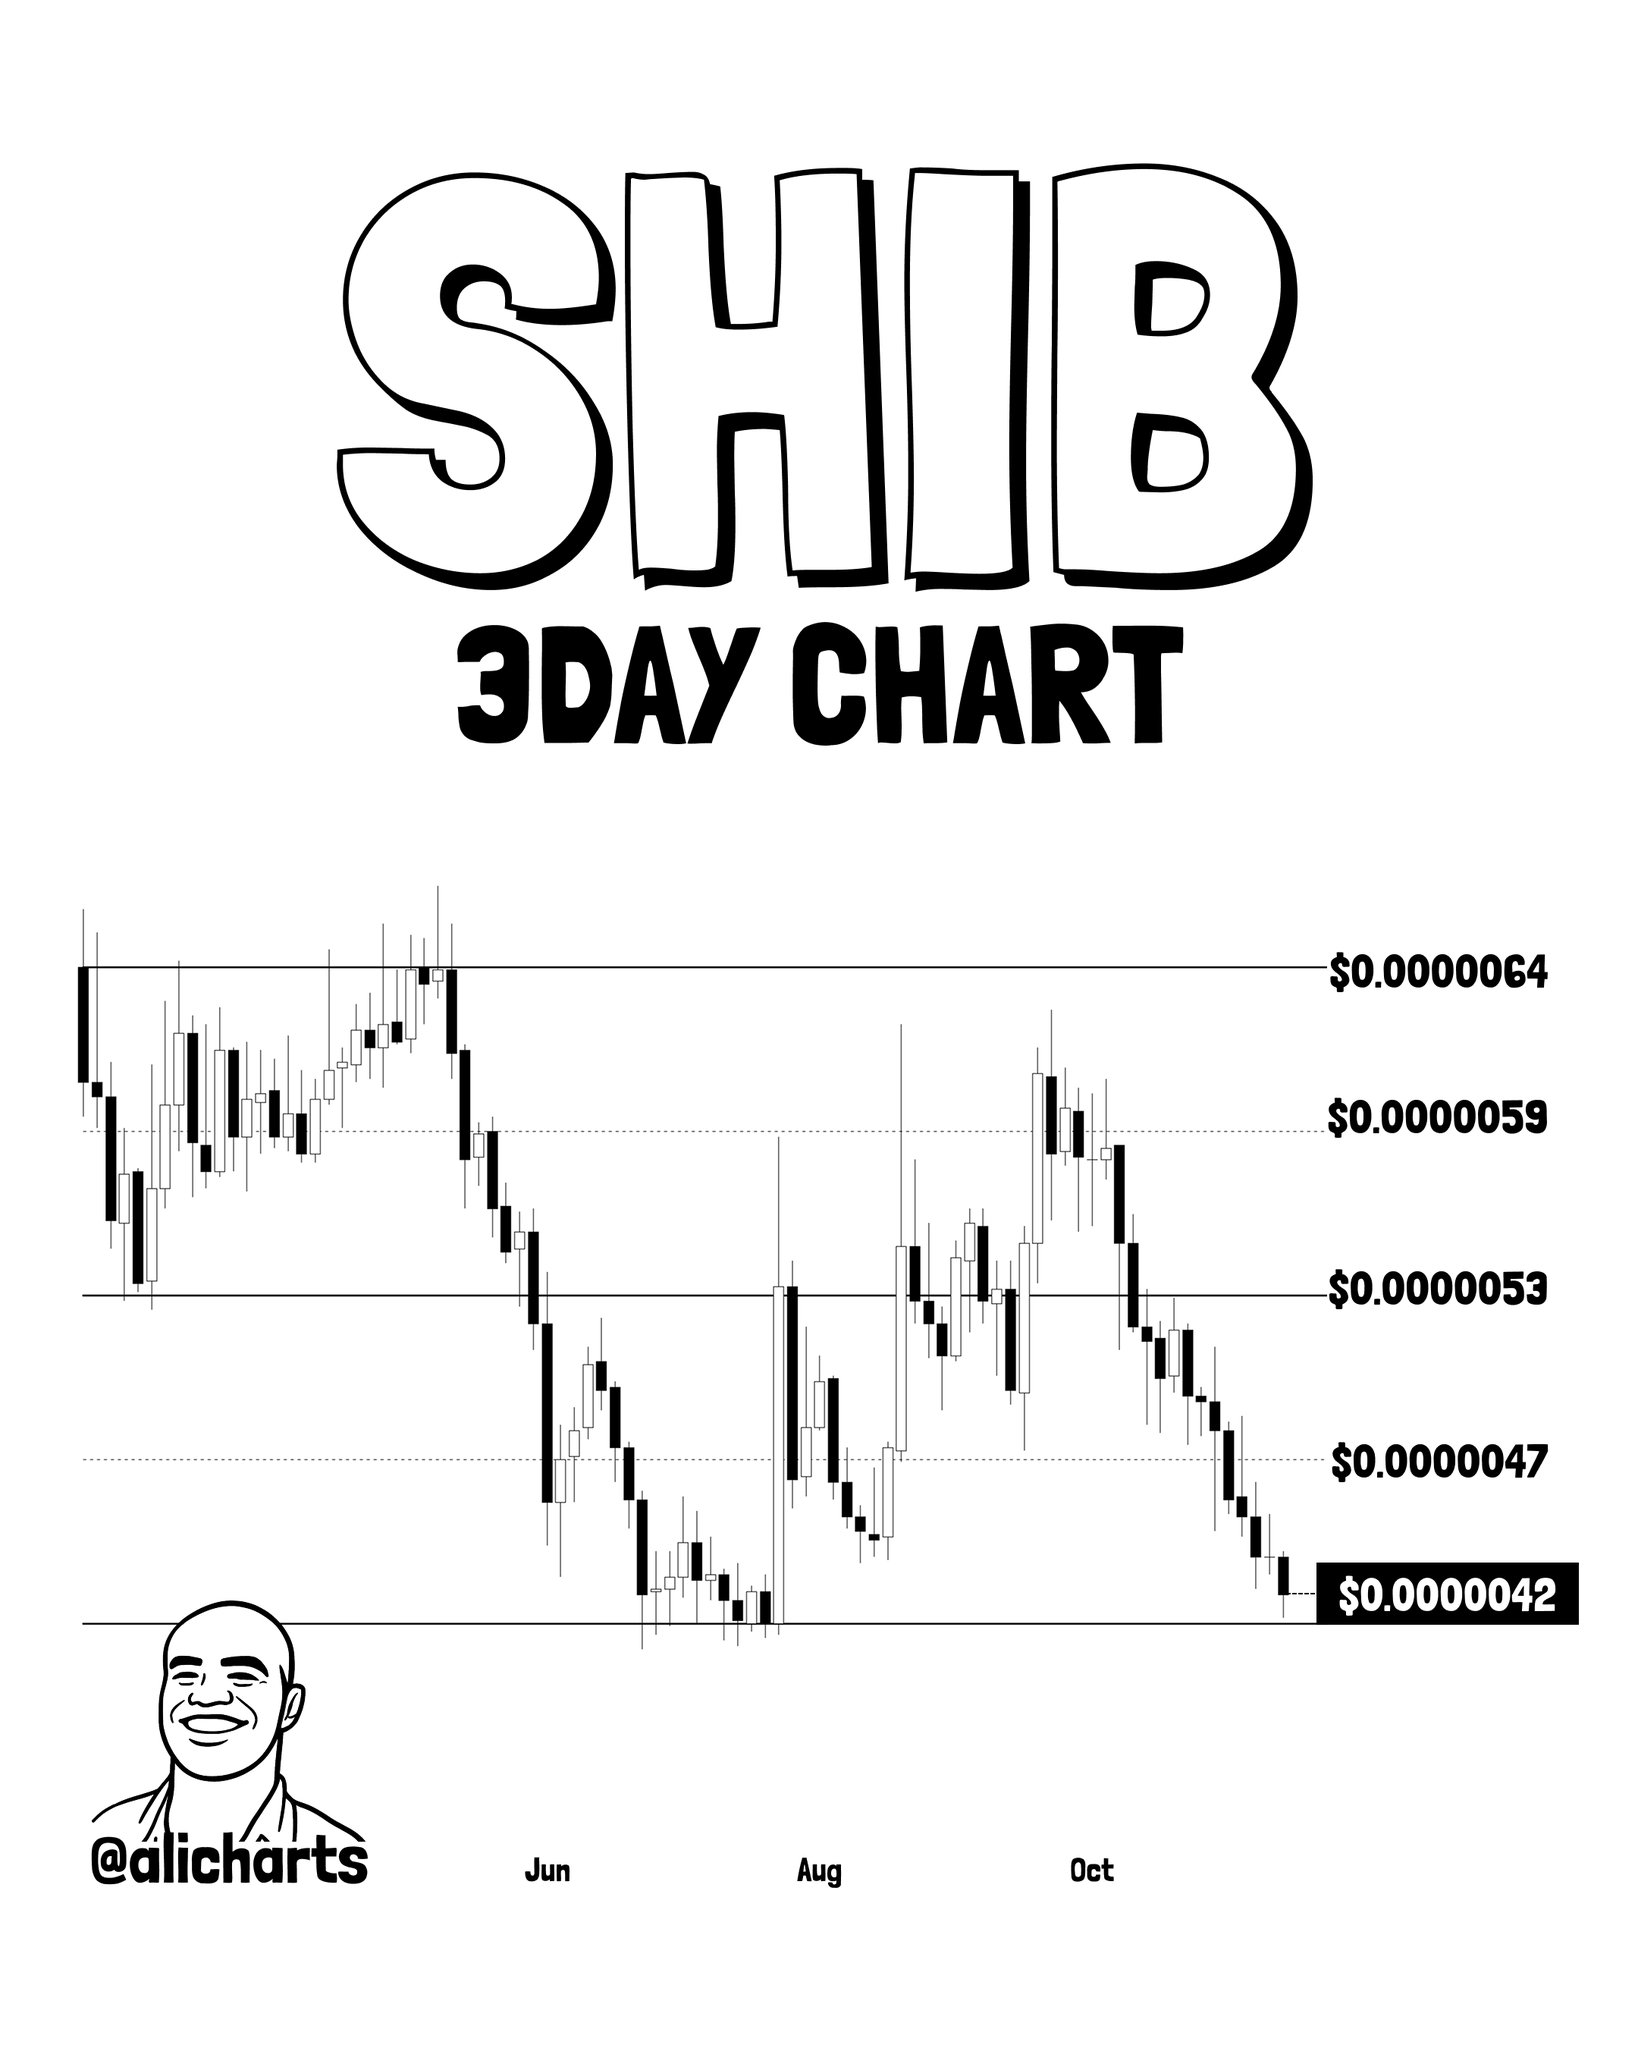
Price is currently at $0.0000042 — below every intermediate level on the chart. The pattern is still forming: no confirmed breakdown below $0.0000042 is visible in the current candle structure. The analyst is watching $0.0000042 as the critical hold level. A bounce from this zone targets the mid-range levels ($0.0000047–$0.0000053). A confirmed close below $0.0000042 would invalidate the support structure and open lower targets not labeled on the chart.
Signal 3 — PEPE: Symmetrical Triangle, $0.0000044 Is the Trendline
PEPE is testing the lower boundary of a symmetrical triangle — an ascending trendline rising from lower-left combined with a relatively flat upper resistance — on its 3-day chart. The two lines converge toward the right side of the chart, with price currently at the boxed level of $0.0000044, the precise point where the ascending trendline intersects current price action.
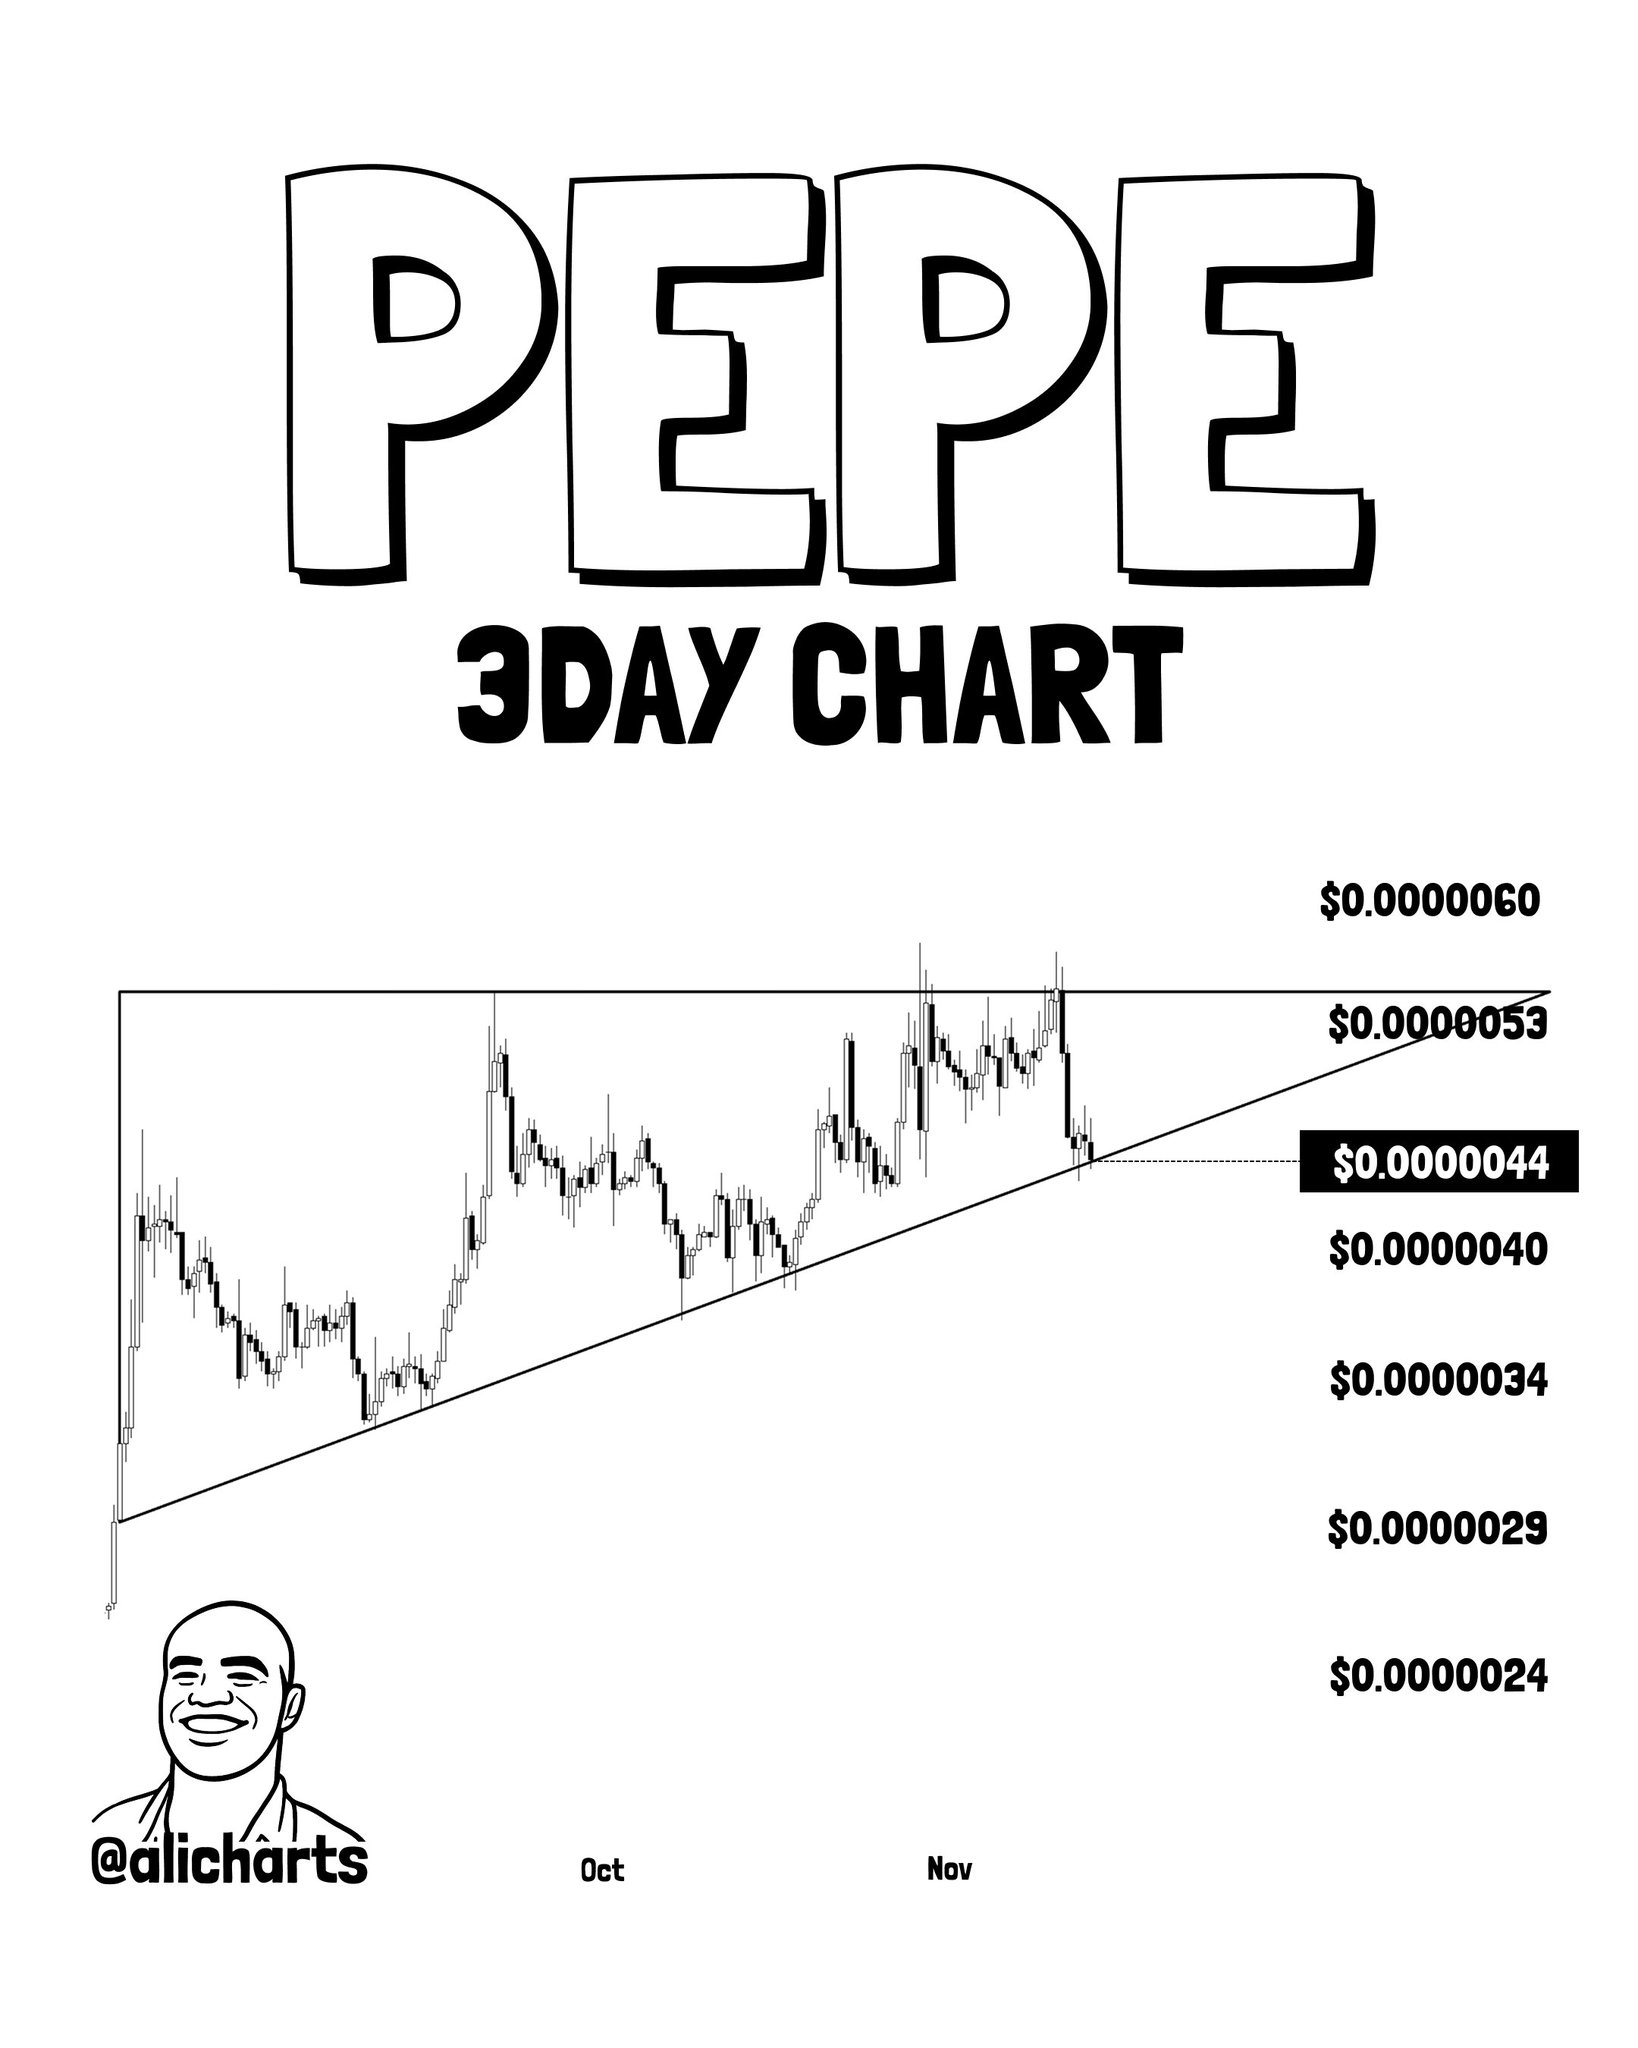
The analyst’s reading: if buyers defend this trendline, PEPE could rebound toward triangle resistance near $0.0000053. The chart prints additional lower reference levels at $0.0000040, $0.0000034, $0.0000029, and $0.0000024 — a staircase of potential support zones if the ascending trendline gives way. The pattern is still forming; no confirmed breakdown below $0.0000044 has occurred in the current candle structure.
What the Synchronized Decline Actually Means
Three memecoins hitting their channel or triangle floors simultaneously is not coincidence — it reflects a uniform repricing of speculative risk in the altcoin market. DOGE’s 40% decline, SHIB’s 34% drawdown, and PEPE’s compression to trendline support all emerged from the same September 22 selling event, suggesting a single macro or sentiment shift rather than asset-specific catalysts.
This is consistent with what has played out in prior Bitcoin midterm cycle corrections — where Bitcoin’s own structural pressure cascades most severely into zero-yield speculative assets. Memecoins have no fee revenue, no protocol utility, and no staking yield to anchor valuation floors. Their only floor is technical structure, and all three are now at exactly that structure.
It is also worth noting that Bitcoin’s own technical situation is fragile. Bitcoin has lost the 200-day moving average, placing memecoin bulls in a position where the macro backdrop offers no support — the floor must hold on its own.
Bullish Scenario — Channel Holds at $0.059 (DOGE), $0.0000042 (SHIB), $0.0000044 (PEPE)
If all three assets hold their respective lower channel or trendline boundaries, the analyst’s rebound targets are: DOGE to $0.074 (mid-channel), SHIB to $0.0000047–$0.0000053 (mid-range), and PEPE to $0.0000053 (triangle resistance). This would constitute a technical bounce within ongoing downtrends — not a trend reversal.
Bearish Scenario — Support Breaks
A confirmed 3-day close below $0.059 for DOGE opens the analyst’s stated target of $0.04 — a further 32% from the channel floor. For SHIB, a close below $0.0000042 invalidates the horizontal support with no labeled lower target from the analyst. For PEPE, a break below $0.0000044 opens the staircase of lower levels: $0.0000040, $0.0000034, $0.0000029.
The memecoin sector is at its most structurally vulnerable reading since the September 22 breakdown began. DOGE at $0.059, SHIB at $0.0000042, and PEPE at $0.0000044 are not soft support zones — they are the last drawn lines on the analyst’s charts. A simultaneous hold across all three would be the first technical argument for a sector bounce. A simultaneous break would remove any near-term floor. Watch $0.059 on DOGE — that is the most liquid and most-watched level among the three, and its outcome will likely set the tone for the other two.
Source: x.comFrequently Asked Questions
What happens to DOGE if $0.059 support breaks?
What is SHIB’s key support level right now?
What pattern is PEPE forming and what level matters most?
Why did DOGE, SHIB, and PEPE all drop at the same time?
Source: Ali Charts · Published by CoinsProbe Markets Desk
The opinions and market insights shared on CoinsProbe represent the views of individual authors based on prevailing market conditions at the time of publication. Cryptocurrency investments carry significant risk and volatility. Readers are encouraged to conduct their own research and seek professional financial advice before making investment decisions. CoinsProbe and its contributors do not accept responsibility for financial losses or decisions made based on published content.
CoinsProbe may publish sponsored articles, affiliate links, or promotional collaborations. All sponsored material is clearly labeled to maintain transparency with our audience. Our editorial decisions remain fully independent, and advertising partnerships do not influence reviews, rankings, or published opinions.
Since 2023, CoinsProbe has delivered reliable insights on cryptocurrency, blockchain, and digital assets. Our content is created by experienced researchers and analysts who follow strict editorial standards focused on accuracy, transparency, and credibility. Every article is carefully reviewed and verified using trusted sources and current market data. We provide unbiased analysis and timely updates covering everything from emerging crypto projects to major industry developments.