- Bitcoin is trading at $67,310 — down 2.24% in 24h — after losing the 200-day moving average
- An analyst who called the 2-month correction and $68K bottom now flags the 200-week MA as the last structural support
- Spot Bitcoin ETFs saw $185.5M in net outflows on Nov 13, extending a 5-day streak totaling $1.07B in redemptions
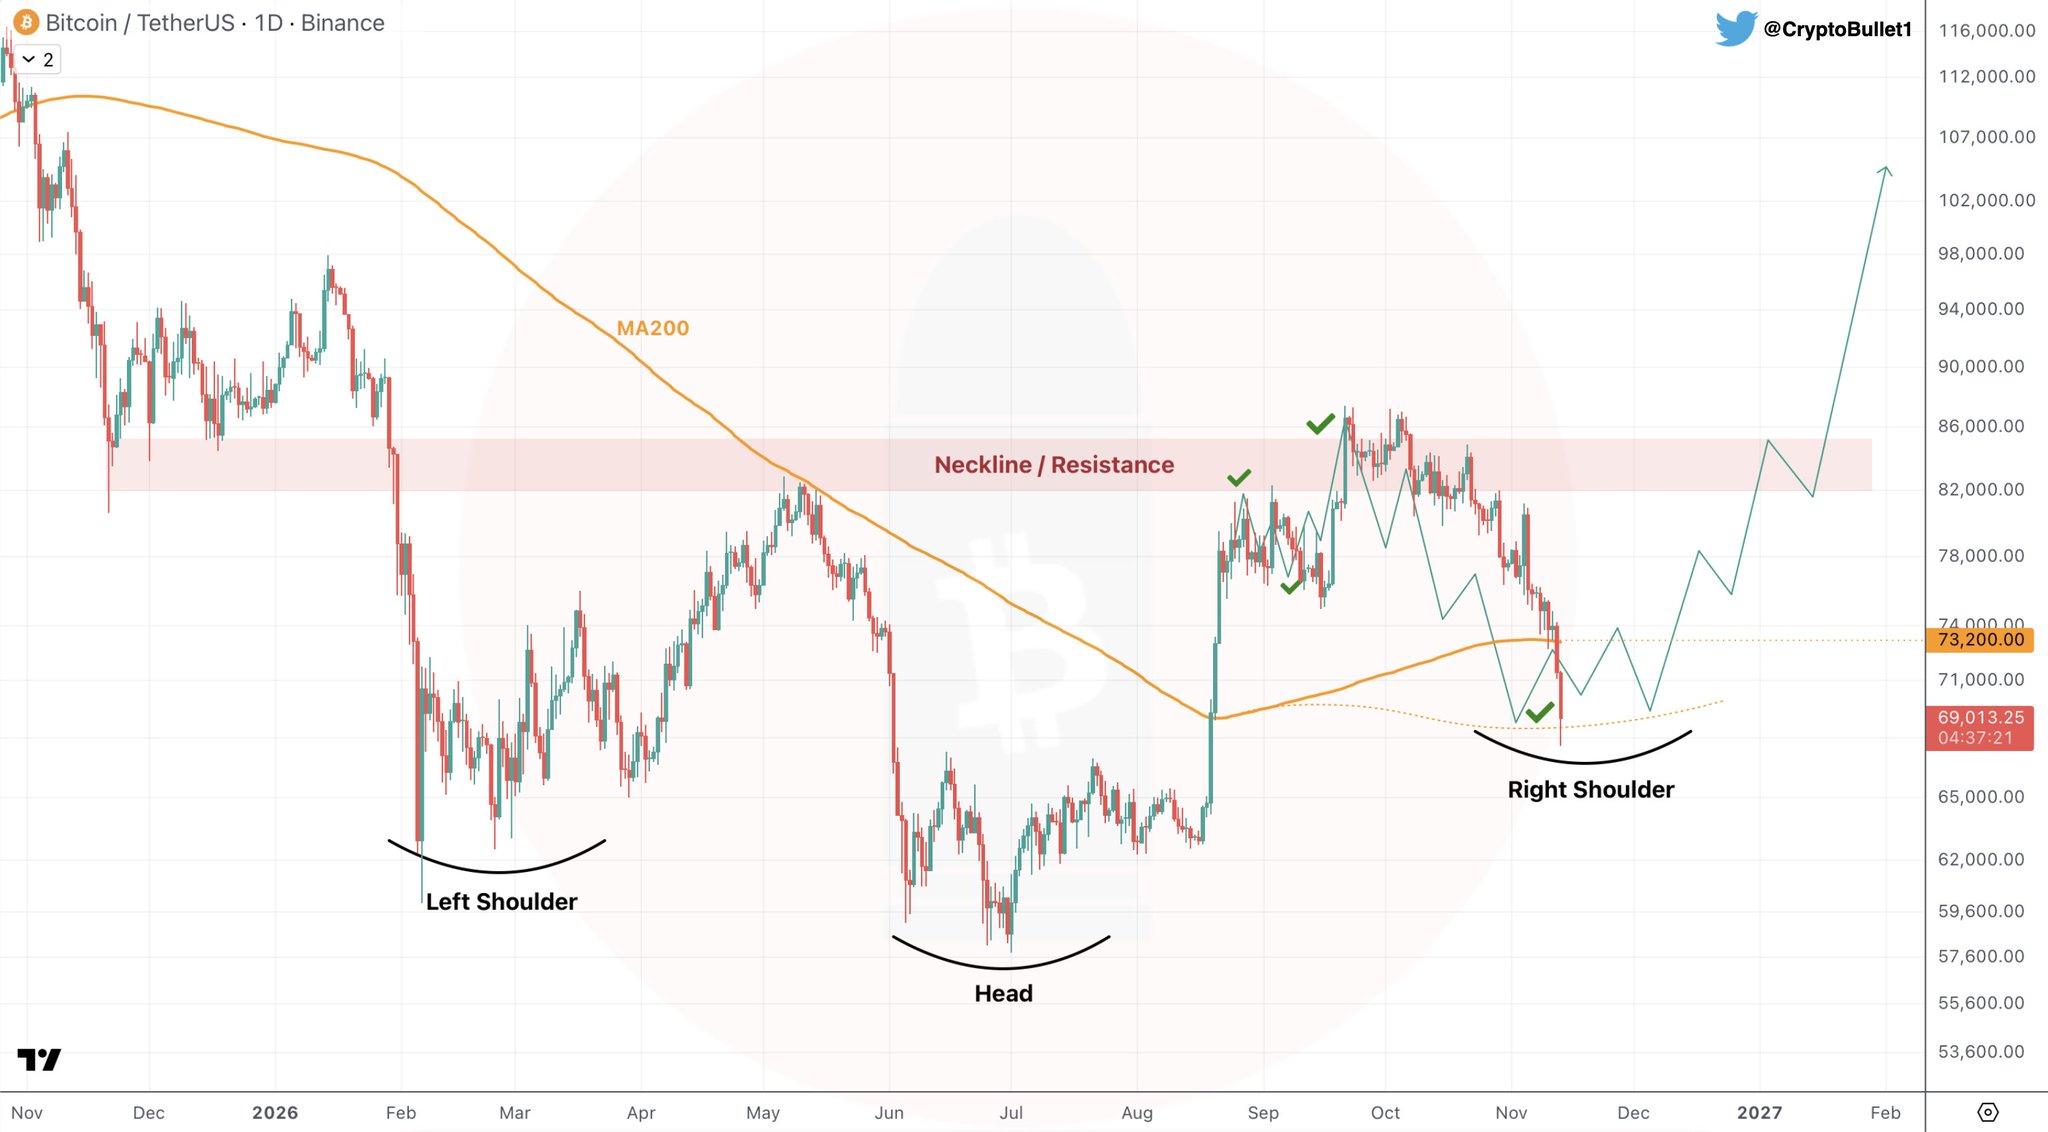
- The inverse H&S on the daily chart targets $102,000 — but price remains below the neckline; the 200-week MA must hold first
Bitcoin is trading at $67,310 — down 2.24% in the past 24 hours — after breaking below the 200-day moving average, a development that one analyst describes bluntly as a warning signal in an otherwise well-mapped correction. The asset carries a market cap of approximately $1.35 trillion, but the technical damage done by losing the 200-day MA has shifted the conversation toward a single remaining line of defense.
The analyst behind the call, writing under the handle @CryptoBullet1, had publicly identified $68,000 as the correction bottom more than a month before the two-month decline began — a call that proved precise. Now, with BTC having lost the 200-day moving average, the same analyst is flagging the 200-week moving average as “our last hope” for bulls attempting to hold the current structure intact.
The Setup: A Correction Called Before It Started
In a quoted post from September 21, 2026, the analyst noted that Bitcoin had achieved a higher high exactly as anticipated — and characterized that move as the “final pump” before a two-month correction. That warning preceded the decline by roughly one month. The $68,000 target, set in advance as the floor, held as an approximate bottom. What the analyst did not anticipate — and now explicitly flags — is that Bitcoin would subsequently lose the 200-day moving average during the recovery attempt.
The 200-day moving average is one of the most widely referenced trend indicators in both traditional finance and crypto markets. It tracks the asset’s average closing price over the prior 200 trading sessions, acting as a long-term trend divider: sustained trading above it is associated with bull market conditions, while sustained losses below it historically precede deeper corrective phases. Bitcoin’s break below this level, confirmed at the time of writing, removes a key layer of technical support that had held through much of the prior advance.
The 200-Week MA — What It Is and Why It Matters Here
The 200-week moving average operates on a fundamentally different timescale. Where the 200-day tracks roughly 10 months of daily closes, the 200-week spans nearly four years of weekly closes — encompassing full market cycles. In Bitcoin’s trading history, the 200-week MA has served as a macro floor during major bear markets. Each time BTC has approached or briefly touched this level — in 2015, 2018, and 2022 — it marked either the cycle bottom or a critical structural low from which multi-hundred-percent recoveries followed.
The analyst’s framing — “last hope” — reflects that this is not an ordinary support level. It is the deepest structural anchor in Bitcoin’s long-term chart. If BTC holds the 200-week MA, the two-month correction remains a corrective phase within a larger bull structure. If it fails, the corrective narrative shifts materially. This context is especially relevant alongside the broader demand picture — as covered previously in our analysis of Bitcoin Demand Collapses to -362,000 BTC as Miner Flows Surge 16-Fold.
The Inverse Head and Shoulders — Pattern Context
The daily chart shared by the analyst depicts an inverse head and shoulders structure — a pattern defined by three successive troughs where the middle trough (the head) is the deepest and the two flanking troughs (left and right shoulders) are shallower. A horizontal neckline sits above the pattern. As of the chart’s timestamp, price is below the neckline and below the moving average, meaning the pattern’s breakout condition has not been triggered. The bullish resolution of the pattern — a move toward the $102,000 zone — remains contingent on the right shoulder holding and a subsequent break above the neckline. That sequence has not yet occurred.
The chart’s annotated dotted horizontal line at $73,200 represents a prior reference zone, while the price box at the time of charting showed $69,013. The current live price of $67,310 sits below both — confirming that the correction has extended since the chart was produced and that the 200-week MA is now the operative level.
ETF Flows Add Institutional Context
The technical pressure is reinforced by institutional flow data. According to data via SoSoValue, spot Bitcoin ETFs recorded a net outflow of $185.5 million on November 13, 2026. The five-day streak of consecutive outflows has now totaled $1.07 billion in net redemptions, with zero inflow days across the past five sessions. IBIT led outflows at $143.5 million, followed by FBTC at $41.9 million, while GBTC recorded no net change. Total ETF net assets stand at $86.20 billion against a cumulative net inflow since launch of $54.63 billion — meaning the outflow streak, while notable, has not erased the structural inflow base.
Strategy (formerly MicroStrategy) continues to accumulate regardless: its total Bitcoin holdings stand at 850,364 BTC as of November 9, 2026, with a latest purchase of 1,036 BTC for $81.9 million. That institutional conviction has not translated into price stability, but it does establish a price-insensitive floor of demand at the corporate treasury level. The realized cap impulse turning negative — as detailed in our prior report on Crypto Market Capital Momentum Turning Negative — suggests that the broader macro capital environment remains a headwind.
Macro Backdrop: FOMC and Upcoming Data
The macro context adds further complexity. Markets currently price an 88.5% probability of a Fed hold at 4.00%–4.25% at the December 9 FOMC meeting, per SoSoValue data. However, the January 27, 2027 FOMC meeting carries a 68.1% probability of a hike to 4.25%–4.50% — a meaningful shift in rate expectations that could weigh on risk assets into year-end. Key data releases this week include Retail Sales (MoM) on November 16, Initial Jobless Claims on November 18, and Core PCE alongside GDP (QoQ) on November 24. Any upside surprises in inflation or labor data would reinforce the case for a January hike and add macro headwinds to Bitcoin’s technical precarity.
What the 200-Week MA Holds — And What Happens If It Doesn’t
The analyst’s signal narrows to a binary: either the 200-week moving average absorbs the current selling pressure and BTC stabilizes, or the final structural anchor gives way. The inverse head and shoulders pattern on the daily chart provides the bullish scenario — a right-shoulder hold followed by a neckline breakout targeting the $102,000 zone. But that path runs through the 200-week MA first.
For further context on how Bitcoin’s market structure has evolved through the current deleveraging cycle, our earlier coverage of Bitcoin’s Largest Binance Deleveraging Since 2021 outlines the structural changes underneath the price action.
The two-month correction was called precisely. The $68,000 floor was identified in advance. The loss of the 200-day MA was not in the script. What happens at the 200-week MA — the level that has marked Bitcoin’s macro lows in every prior cycle — is the question every timeframe now converges on. At $67,310, Bitcoin is approaching that test. Watch the 200-week MA as the level that determines whether this correction ends or deepens.
Source: x.comFrequently Asked Questions
What is the 200-week moving average for Bitcoin right now?
What does losing the 200-day moving average mean for Bitcoin’s trend?
What is the inverse head and shoulders pattern on Bitcoin’s chart and what does it project?
How significant are the $1.07B in Bitcoin ETF outflows over five days?
Source: Cryptobullet1 · Published by CoinsProbe Markets Desk
The opinions and market insights shared on CoinsProbe represent the views of individual authors based on prevailing market conditions at the time of publication. Cryptocurrency investments carry significant risk and volatility. Readers are encouraged to conduct their own research and seek professional financial advice before making investment decisions. CoinsProbe and its contributors do not accept responsibility for financial losses or decisions made based on published content.
CoinsProbe may publish sponsored articles, affiliate links, or promotional collaborations. All sponsored material is clearly labeled to maintain transparency with our audience. Our editorial decisions remain fully independent, and advertising partnerships do not influence reviews, rankings, or published opinions.
Since 2023, CoinsProbe has delivered reliable insights on cryptocurrency, blockchain, and digital assets. Our content is created by experienced researchers and analysts who follow strict editorial standards focused on accuracy, transparency, and credibility. Every article is carefully reviewed and verified using trusted sources and current market data. We provide unbiased analysis and timely updates covering everything from emerging crypto projects to major industry developments.