- XRP trades at $1.57 — up 5.16% in 24 hours — completing inverse H&S right shoulder per analyst @alicharts
- Whales accumulated more than $2 billion in XRP — equal to ~31.8% of XRP's $6.29B daily volume
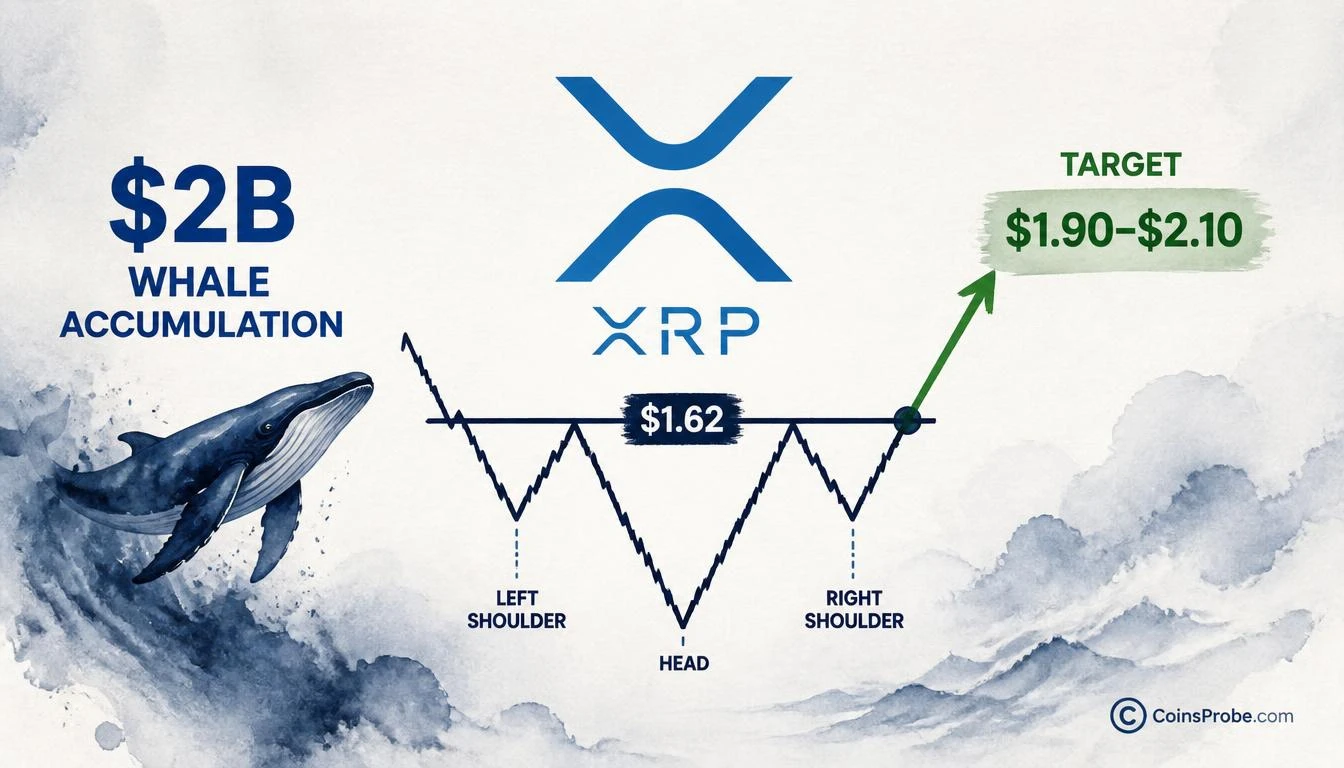
- Neckline breakout above $1.62 targets $1.90–$2.10 measured move — invalidation at $1.50 daily close
XRP is trading at $1.57 — up 5.16% in the last 24 hours — with a market cap of $99.01 billion and $6.29 billion in daily volume. The move is not isolated price action. It is the market pricing in the completion of one of the most structurally significant chart patterns in technical analysis: a major inverse head-and-shoulders formation on the daily timeframe.
That is the direct assessment of crypto analyst Ali Martinez (@alicharts), who flagged the setup on September 22, 2026: “Following a 27.6% rally from $1.25 to $1.58, $XRP appears to have completed the right shoulder of a major inverse head-and-shoulders pattern on the daily chart. Meanwhile, whales have recently accumulated more than $2 billion worth of XRP.”
The confluence of a textbook pattern completion and $2 billion in confirmed whale accumulation is what separates this setup from standard momentum plays.
Signal 1 — Inverse Head-and-Shoulders Pattern: Right Shoulder Confirmed
The inverse head-and-shoulders is a reversal pattern that forms after a prolonged downtrend. It consists of three successive troughs: a left shoulder, a deeper head, and a right shoulder that returns to approximately the same level as the left. The neckline — the resistance connecting the peaks between the three troughs — becomes the critical breakout level. A confirmed close above the neckline triggers the measured move projection.
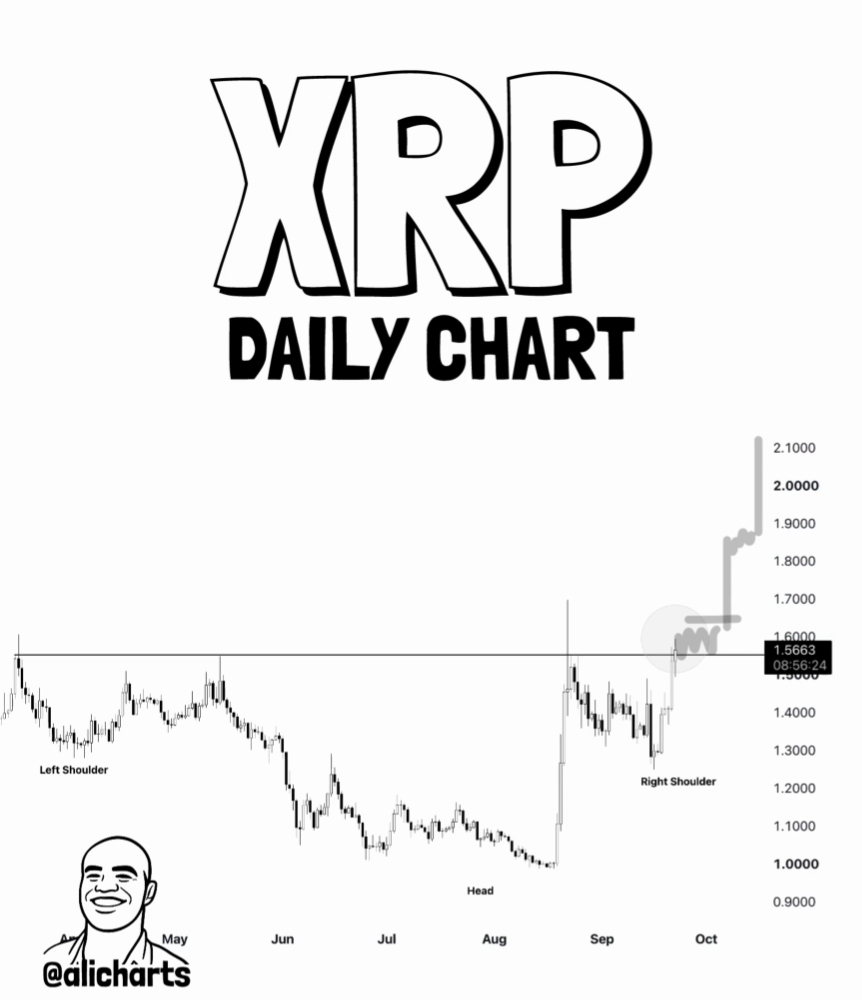
What makes @alicharts’ identification significant is the 27.6% rally from $1.25 to $1.58 that formed the right shoulder. This is not a shallow bounce — it is a defined, proportionate recovery that mirrors the left shoulder’s structure on the daily chart. The symmetry is the signal. When right shoulder volume contracts relative to the head and neckline approaches are accompanied by expanding volume, the pattern is considered technically mature.
The measured move for an inverse head-and-shoulders is calculated by taking the vertical distance from the head’s low to the neckline and projecting it upward from the breakout point. With XRP’s head established at the cycle low near $1.25, the neckline positioned in the $1.55–$1.60 zone represents the immediate confirmation threshold. A sustained daily close above this zone — not an intraday spike — activates the measured move target.
This pattern class has a documented track record on XRP’s daily chart. In early 2023, a comparable inverse head-and-shoulders formation preceded a multi-week rally exceeding 60% from the pattern’s neckline breakout. In late 2024, a similar structure on the weekly timeframe coincided with XRP’s move from sub-$0.50 to the $1.20–$1.30 resistance band. Pattern completions at this scale — with proportionate shoulders and volume confirmation — have consistently led to material directional moves for XRP.
Signal 2 — Whale Accumulation: $2 Billion in Confirmed Buying
The second signal is on-chain and unambiguous. According to @alicharts, whales have accumulated more than $2 billion worth of XRP in the period surrounding this pattern formation. At XRP’s current price of $1.57, $2 billion in accumulation represents approximately 1.27 billion XRP tokens moving into large-wallet positions.
Whale accumulation at this scale functions as a structural bid beneath the market. Large holders absorbing supply near the neckline of a reversal pattern accomplishes two things simultaneously: it removes available sell-side pressure at resistance, and it establishes a cost basis that creates institutional-level support on any subsequent pullback. This is the mechanism that distinguishes a genuine breakout from a false one — when the entities with the largest positions are buying into resistance, not selling into strength.
The $2 billion figure is materially significant relative to XRP’s daily volume of $6.29 billion. It represents roughly 31.8% of a single day’s volume concentrated in accumulation — not spread across retail participants, but concentrated in large-wallet transactions consistent with institutional or whale-tier activity. This is the type of on-chain signal that precedes sustained directional moves, not short-term bounces.
| Metric | Reading | Implication |
|---|---|---|
| Whale Accumulation | >$2.0 billion | Supply absorption at resistance |
| XRP Daily Volume | $6.29 billion | Accumulation = 31.8% of 1-day volume |
| Pattern Rally (Right Shoulder) | +27.6% ($1.25 → $1.58) | Proportionate shoulder structure confirmed |
| Market Cap | $99.01 billion | Sub-$100B cap with pattern activation pending |
Source: @alicharts (X) / Live price data
Why Pattern Completion + Whale Accumulation Together Matter More Than Either Alone
Technical patterns fail. Whale accumulation can precede distribution. What changes the probability calculus is their simultaneous occurrence at the same price zone. The right shoulder completion establishes the technical structure — the pattern that defines where supply and demand are positioned. The $2 billion whale accumulation establishes the on-chain reality beneath that structure — confirming that large capital is not selling into the pattern but buying into it.
The pattern without the whale data could be dismissed as chart-reading. The whale data without the pattern context is directionally ambiguous — large buyers can be wrong, or early. Together, they form a coherent thesis: institutional-scale capital is positioning ahead of what the technical structure suggests is a confirmed reversal attempt. This is the setup that, when neckline breakout follows, tends to produce sustained directional moves rather than sharp reversals.
For broader context on how institutional-scale capital movements can influence asset prices, readers following Bitcoin mining treasury dynamics may find the CoinsProbe analysis on Core Scientific Has Sold 90% of Its Bitcoin Treasury — What It Means for BTC useful for understanding how large-holder behavior shapes market structure.
The Neckline — The Only Level That Matters Right Now
Everything in this setup resolves at the neckline. Based on the pattern structure @alicharts identifies, the neckline resistance for XRP sits in the $1.55–$1.62 zone. XRP is currently trading at $1.57 — directly inside this zone. The critical question is not whether XRP is near the neckline. It is trading at it. The question is whether daily candles can close and hold above it.
A confirmed daily close above $1.62 — sustained over multiple sessions — would activate the measured move. A rejection and close back below $1.50 would invalidate the right shoulder’s proportionality and raise the probability of a retest of the head’s lows near $1.25.
Bullish Scenario — Neckline Breakout Confirmed
A sustained daily close above $1.62 activates the inverse head-and-shoulders measured move. Based on the head-to-neckline distance, the primary target projects toward the $1.90–$2.10 range — a 21%–34% extension from current levels. Intermediate resistance at $1.75 would serve as the first confirmation checkpoint. The $2 billion in whale accumulation near the neckline provides structural support to any pullback following initial breakout.
Bearish Scenario — Neckline Rejection
A daily close back below $1.50 following the current test would signal neckline rejection, invalidating the right shoulder’s structure. The immediate downside target becomes $1.35, with a full pattern failure pointing back toward $1.25 — the right shoulder origin and head of the pattern. A loss of $1.25 with volume would negate the inverse head-and-shoulders entirely and shift the macro structure back to bearish.
What to Watch — The Metric That Confirms or Denies
The setup is defined. The neckline zone is $1.55–$1.62. XRP is trading through it at $1.57. Three data points will confirm or deny the breakout in real time:
- Daily close price — must close and hold above $1.62 on consecutive sessions
- Volume on breakout candle — must expand above the 20-day average volume to confirm institutional participation
- Whale wallet behavior post-breakout — continued accumulation vs. distribution at new highs (trackable via Lookonchain and Arkham)
The pattern completion and whale accumulation are the setup. The neckline close is the trigger. Until that trigger fires with volume confirmation, the setup remains a high-probability thesis — not a confirmed trade.
Bottom Line
XRP is trading at $1.57 — up 5.16% — at the precise neckline of a major inverse head-and-shoulders pattern identified by analyst @alicharts on the daily chart. The right shoulder was formed by a 27.6% rally from $1.25, structurally completing the pattern. Simultaneously, whales have absorbed more than $2 billion in XRP — representing approximately 31.8% of the asset’s daily volume — confirming large-capital accumulation directly at resistance. The measured move from a confirmed neckline breakout projects to the $1.90–$2.10 range. The invalidation level is a daily close below $1.50, which reopens the path to $1.25. Watch $1.62 as the exact daily close level that separates the confirmed breakout from continued consolidation — everything in this setup resolves at that number.
Source: x.com
Frequently Asked Questions
What is the inverse head-and-shoulders pattern on XRP’s daily chart?
How much XRP have whales accumulated, and why does it matter?
What price must XRP close above to confirm the breakout?
What is the invalidation level for the XRP inverse head-and-shoulders pattern?
Source: Ali Charts · Published by CoinsProbe Markets Desk
The opinions and market insights shared on CoinsProbe represent the views of individual authors based on prevailing market conditions at the time of publication. Cryptocurrency investments carry significant risk and volatility. Readers are encouraged to conduct their own research and seek professional financial advice before making investment decisions. CoinsProbe and its contributors do not accept responsibility for financial losses or decisions made based on published content.
CoinsProbe may publish sponsored articles, affiliate links, or promotional collaborations. All sponsored material is clearly labeled to maintain transparency with our audience. Our editorial decisions remain fully independent, and advertising partnerships do not influence reviews, rankings, or published opinions.
Since 2023, CoinsProbe has delivered reliable insights on cryptocurrency, blockchain, and digital assets. Our content is created by experienced researchers and analysts who follow strict editorial standards focused on accuracy, transparency, and credibility. Every article is carefully reviewed and verified using trusted sources and current market data. We provide unbiased analysis and timely updates covering everything from emerging crypto projects to major industry developments.