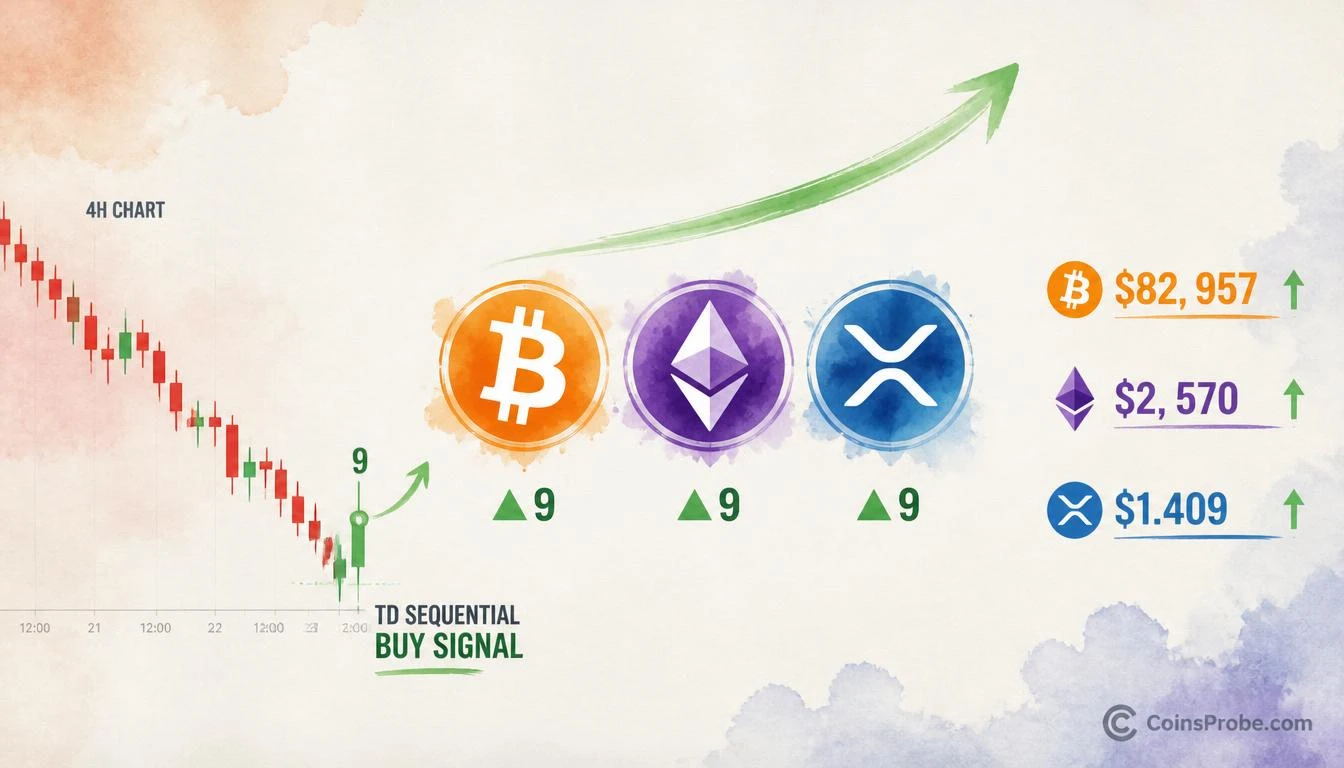

- Bitcoin fell 5.55% from $86,976 on Oct 5 to $82,150 — TD Sequential 9 buy signal now active on 4-hour chart
- Ethereum dropped 7.36% from $2,738 to $2,537 — same 4-hour buy signal printed at $2,570 confirmation zone
- XRP buy signal at $1.409 follows a sell signal at ~$1.53 that accurately called the swing high — internal track record within same sequence
- All three signals flagged simultaneously by analyst Ali Martinez (@alicharts) in a 5-part October 8 thread
Bitcoin is trading at $82,957 — down 1.29% in the past 24 hours and off 5.55% from its October 5 high of $86,976 — while Ethereum and XRP have shed 7.36% and a comparable magnitude in the same window. The decline is notable not for its size, but for what it has triggered simultaneously across three of crypto’s largest assets: a TD Sequential 9 buy signal on each of their 4-hour charts.
Crypto analyst Ali Martinez (@alicharts) flagged the convergence in a 5-part thread on October 8, writing: “BUY SIGNAL ON BITCOIN, ETHEREUM, AND XRP.” Martinez notes that the signal on Bitcoin’s 4-hour chart “comes after $BTC fell 5.55%, from $86,976 on October 5 to $82,150” and that “the signal suggests this pullback may be nearing an end, with a rebound now worth watching.”
What the TD Sequential Actually Measures
The TD Sequential is a momentum-exhaustion indicator, not a trend-following tool. It counts nine consecutive bars closing lower than the bar four periods prior — identifying the point at which selling pressure has statistically run its course. The “9” is not a price level. It is a count. When the count completes with an upward arrow, it signals that the selling sequence is exhausted — not that buyers have confirmed a reversal. Confirmation requires follow-through price action above the signal candle’s high.
The critical edge in Martinez’s observation is not that one asset printed a 9 — it is that Bitcoin, Ethereum, and XRP printed the signal at essentially the same moment on the same timeframe. That synchronicity reduces the probability of a false signal on any individual asset, since all three would need to fail simultaneously for the read to be wrong.
Signal 1 — Bitcoin: $82,150 Low After a 5.55% Drop
Bitcoin’s 4-hour chart shows a clean bearish sequence from October 5 to October 8 — a controlled decline from $86,976 to a low of $82,150, a drop of $4,826 in price terms. The TD Sequential registered its 9 buy signal at the recent low, mirroring an earlier 9 sell signal that appeared at the prior swing high. The symmetry is what Martinez is flagging: the sell signal marked the top accurately; the buy signal is now appearing at the bottom of the same move.
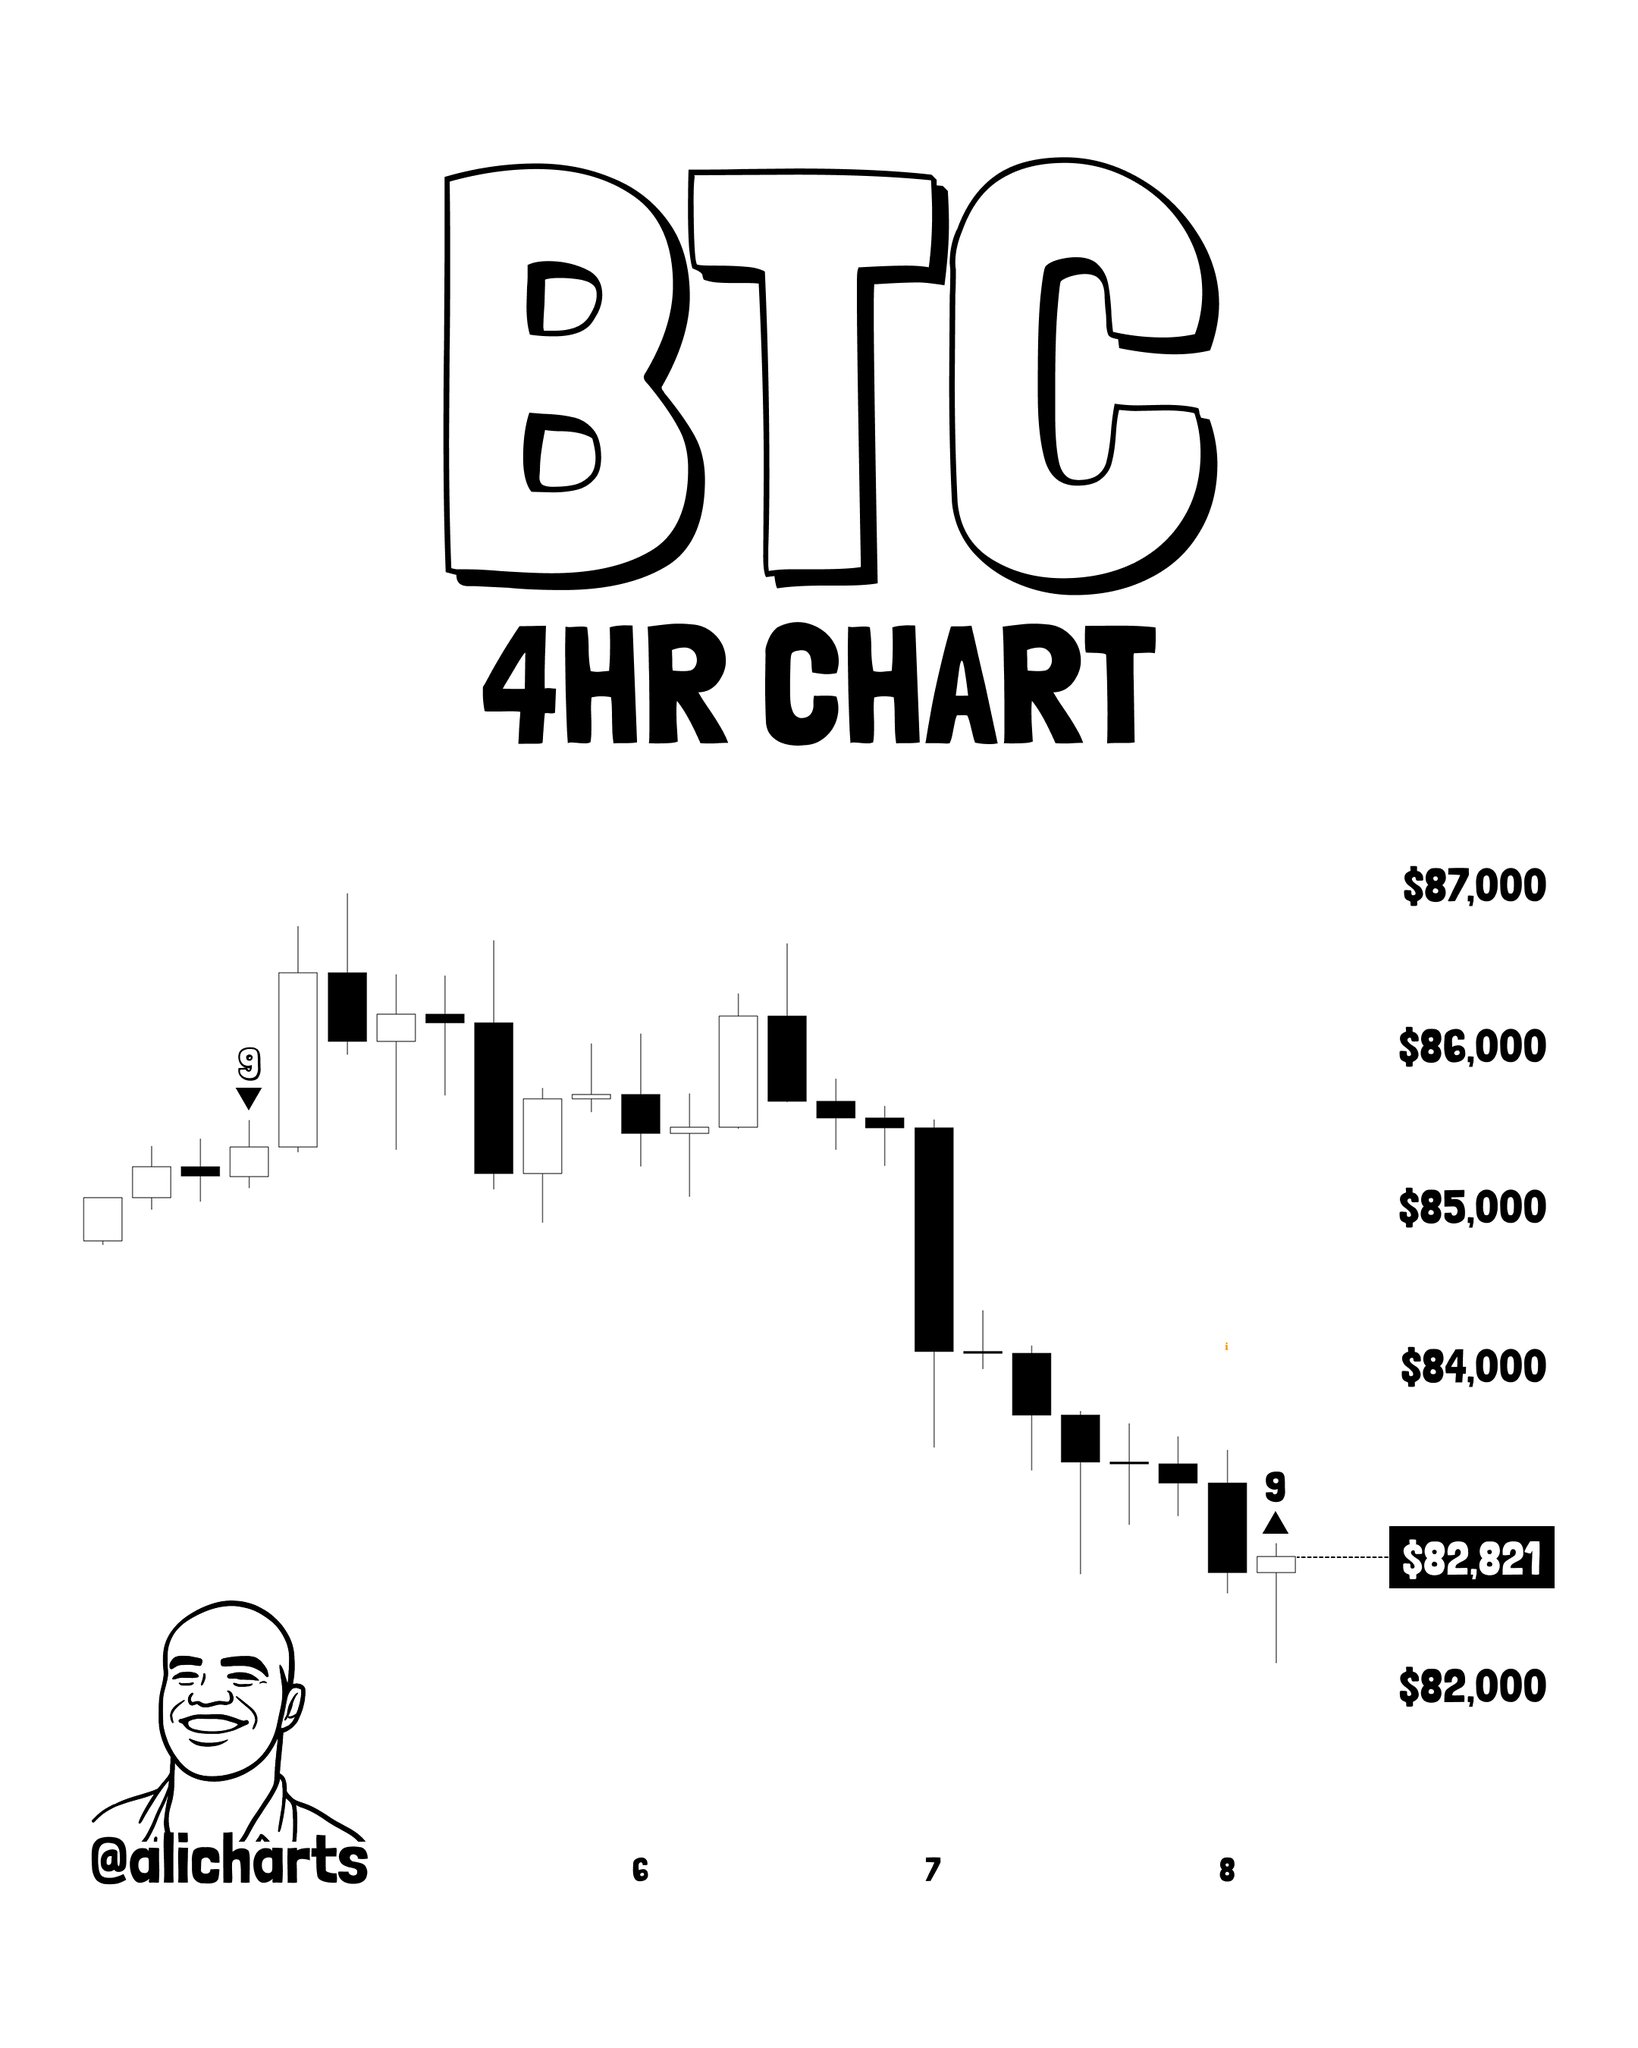
At the time of writing, Bitcoin has recovered modestly to $82,957 — approximately $807 above the TD Sequential trigger low. The 4-hour chart shows the signal candle printed near $82,821 per the chart price box, with the analyst’s stated low of $82,150 representing the intraday exhaustion point. The immediate question is whether buyers can push price above the signal candle’s high and sustain it — that is the confirmation the indicator requires before the buy signal is considered active. For context on what happens when Bitcoin loses key cost-basis levels during pullbacks, see Bitcoin Fails to Hold the Active Realized Price — What That Means.
Signal 2 — Ethereum: $2,537 Low After a 7.36% Drop
Ethereum’s decline was steeper in percentage terms. Martinez cites a 7.36% drop from $2,738 to $2,537 — a $201 move in absolute terms across the same October 5–8 window. The 4-hour TD Sequential printed its 9 buy signal at the $2,537 low, with the chart dashed-line level explicitly marked at $2,570 as the zone Martinez is watching for buyer confirmation.
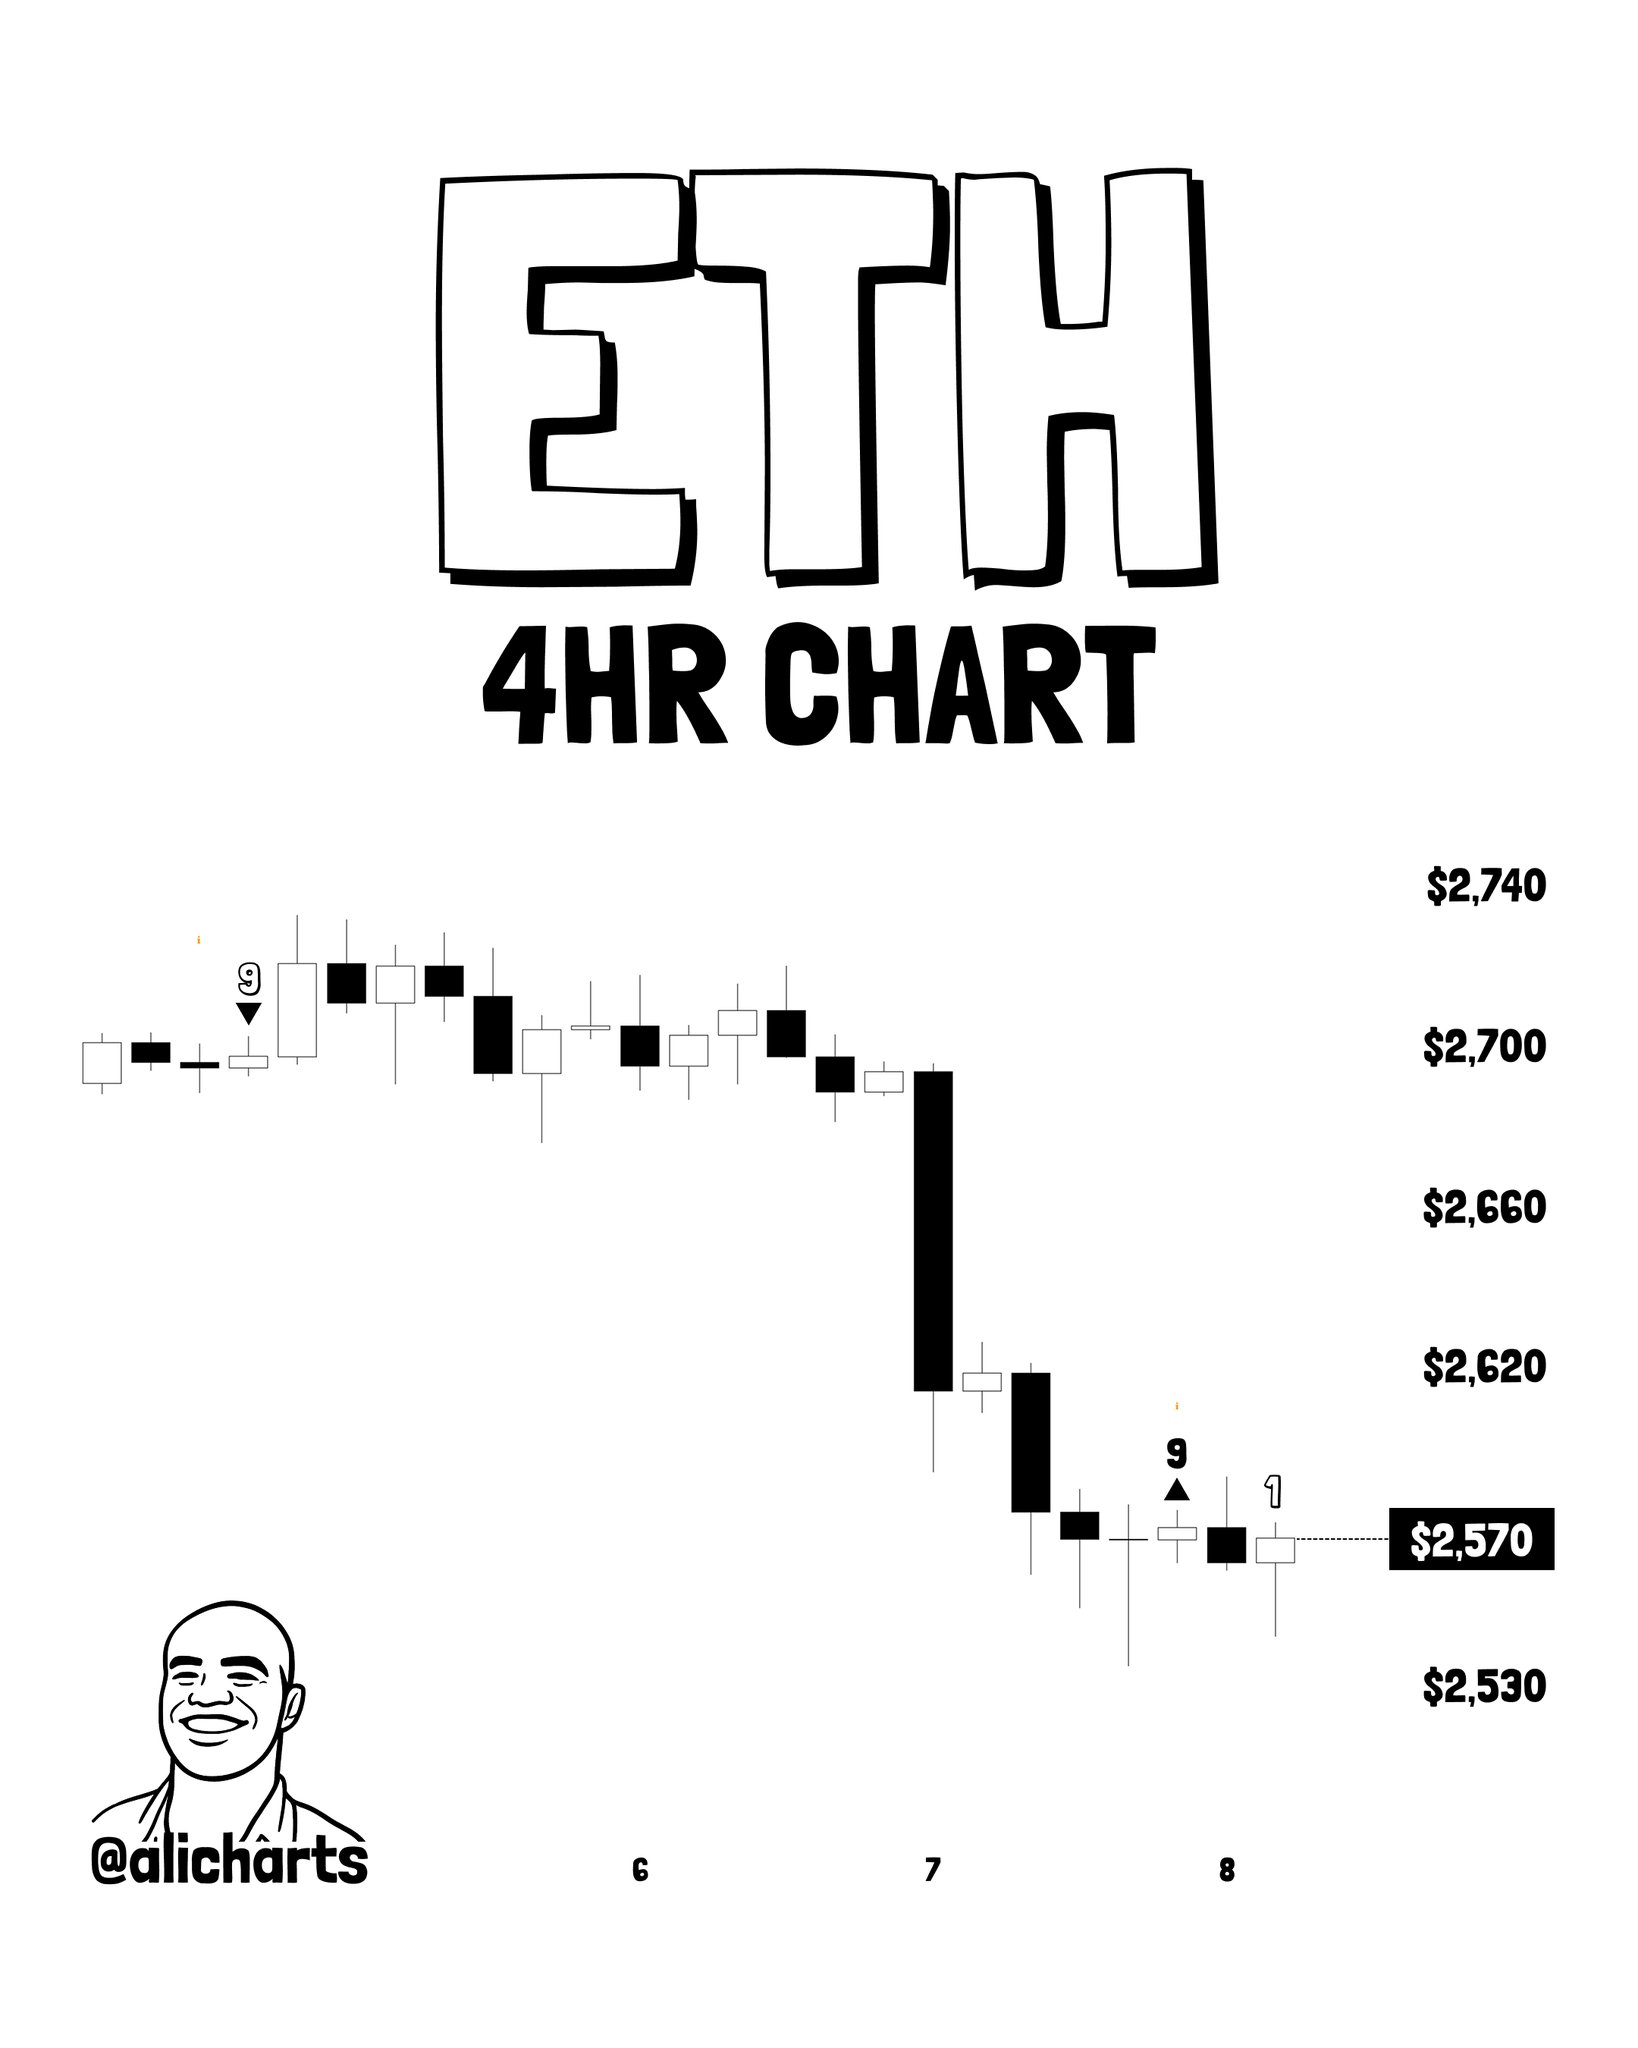
The chart shows small-bodied consolidation candles forming near the lows following the sharp multi-candle decline — a pattern consistent with exhaustion rather than active distribution. Martinez stated he is “watching for” buyer confirmation to trigger a recovery bounce, with the target price referenced in the original thread text but not printed on the chart image itself. Ethereum’s signal is the weakest of the three in magnitude terms — the asset fell hardest — which makes buyer confirmation at $2,570 the most critical confirmation level across the three assets.
Signal 3 — XRP: $1.409 Low, Sell Signal Preceded the Drop
XRP’s chart adds the most structural weight to the thesis. The 4-hour chart shows two TD Sequential 9 markers: a sell signal with a downward arrow near the swing high around the $1.53 area, followed by a buy signal with an upward arrow near the recent low at $1.409. The sell signal at the top preceded the steep multi-candle decline — giving the current buy signal a documented track record within the same price sequence.
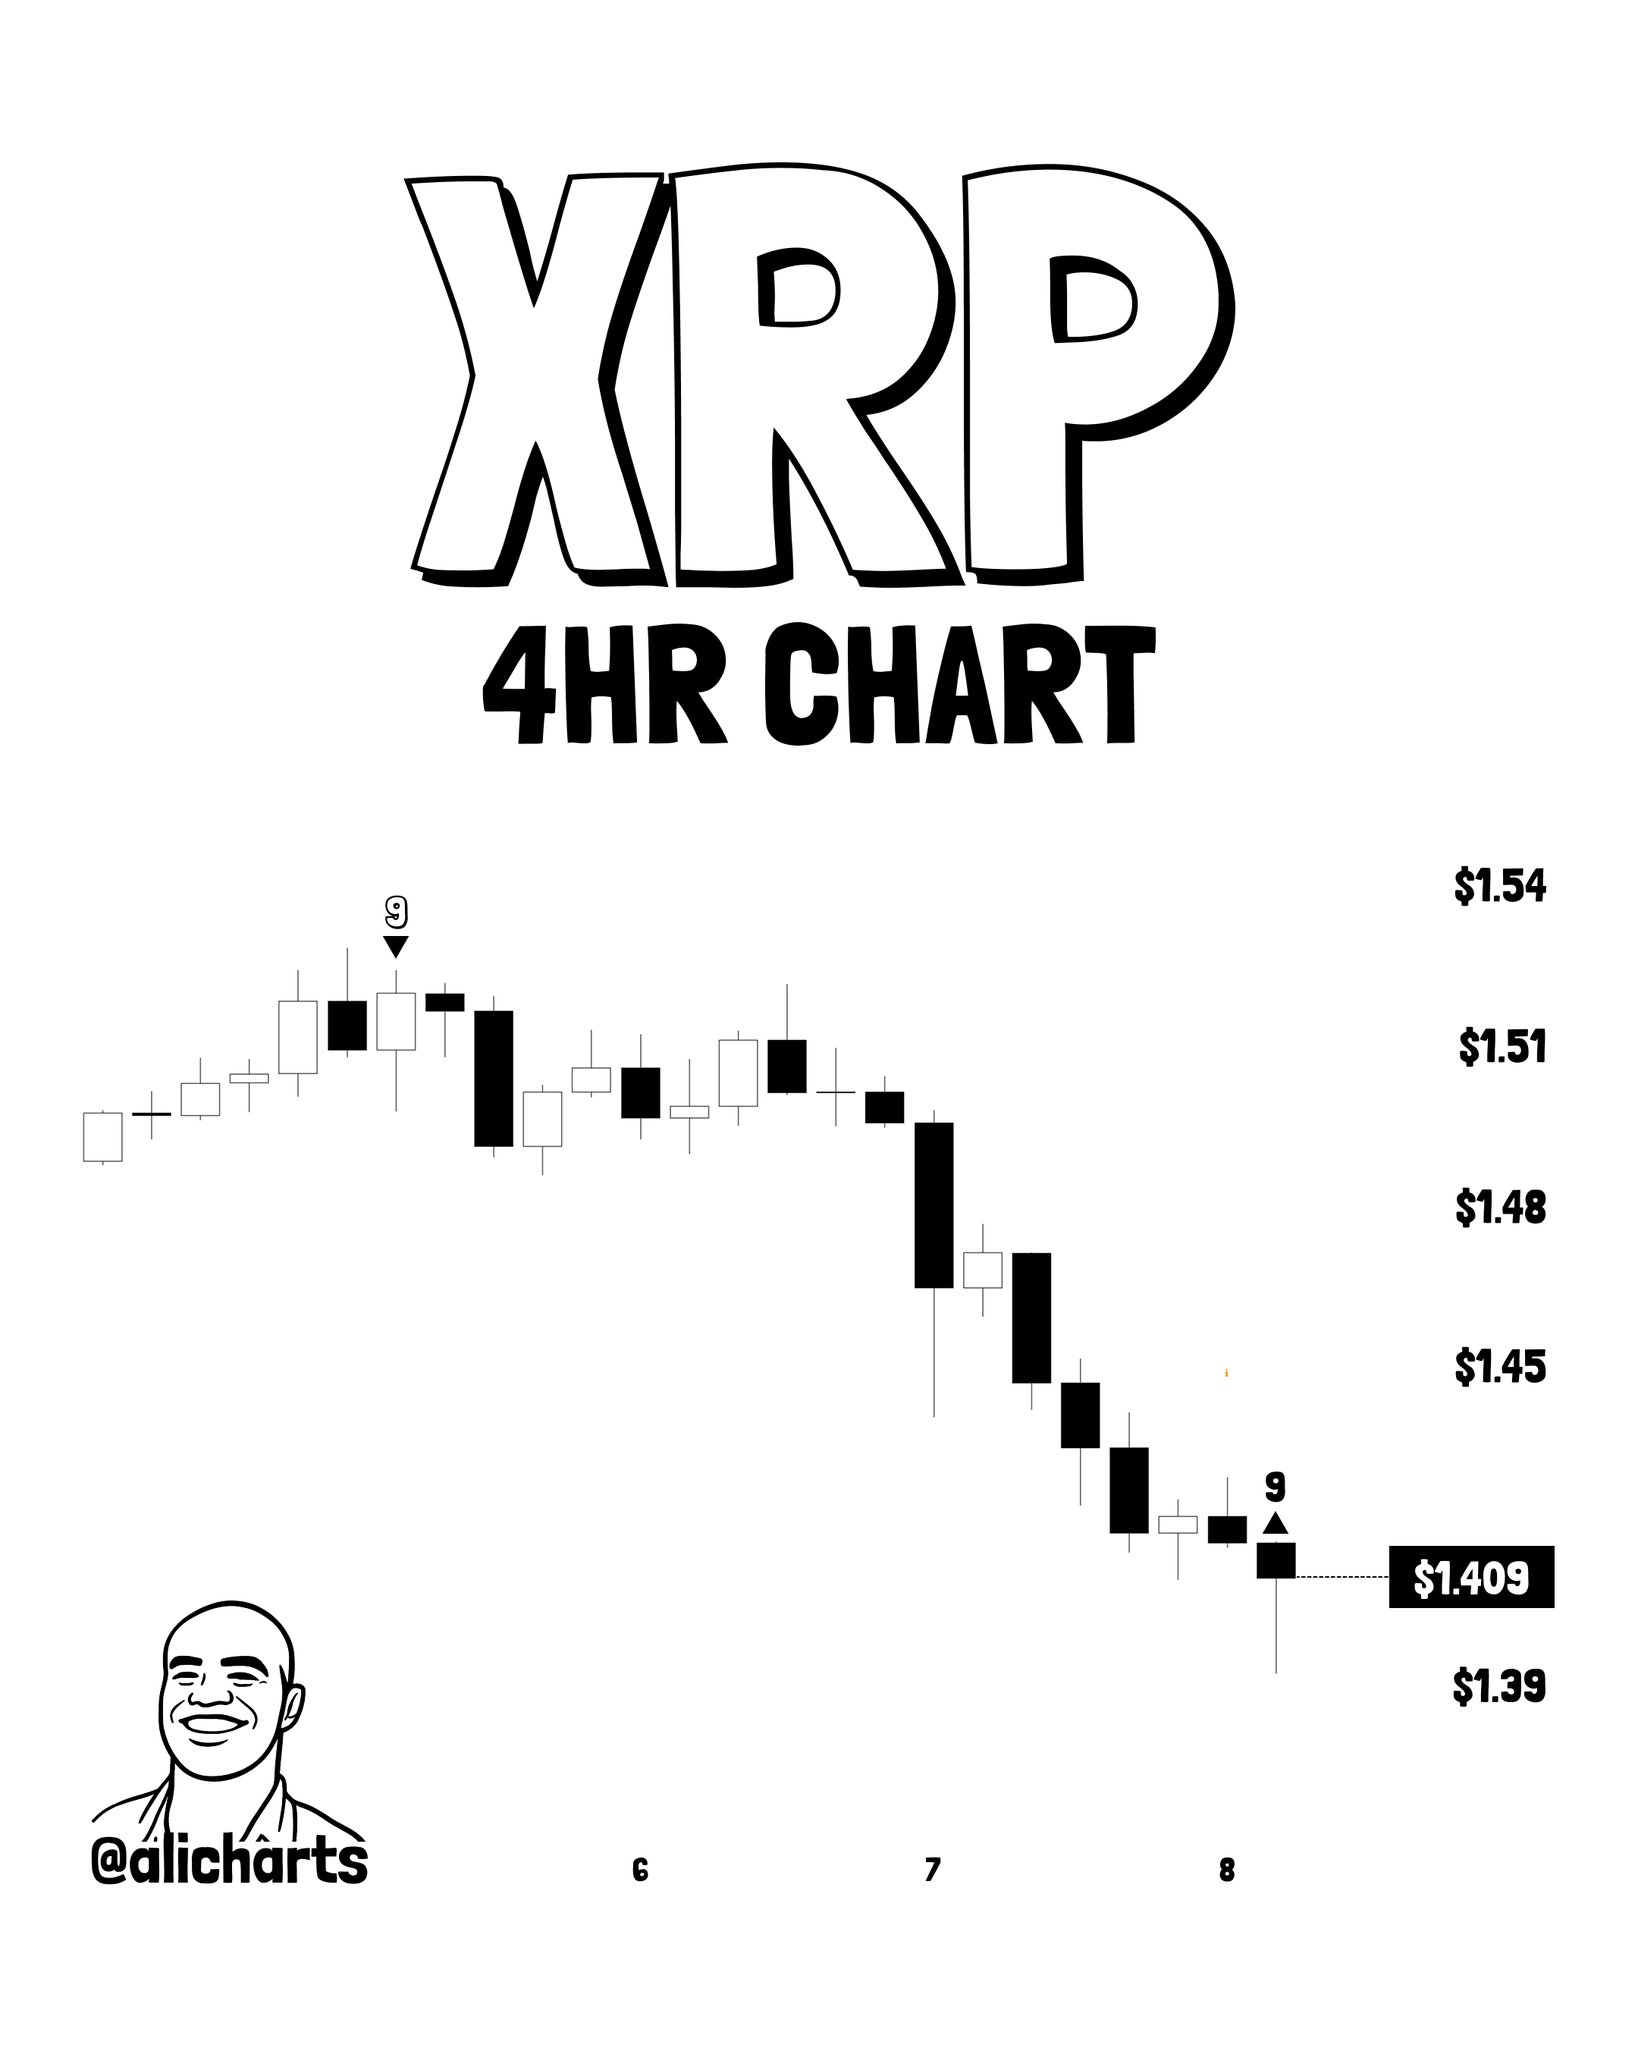
This internal consistency — sell signal called the top, buy signal now appearing at the bottom — is the pattern Martinez is drawing attention to across all three assets. XRP’s current price of $1.409 per the chart price box sits at the base of the decline. As with Bitcoin and Ethereum, the TD Sequential read is not a purchase order; it is a warning that the selling sequence is mathematically complete and that continuation lower would require a fresh count to begin.
Why the Convergence Matters More Than Any Single Signal
Isolated 4-hour TD Sequential signals fire frequently and carry limited standalone weight. What makes this thread analytically significant is the simultaneous appearance across Bitcoin ($1.67 trillion market cap), Ethereum, and XRP — three assets that, while correlated, run on separate chains with different liquidity profiles and different trader bases. The probability that all three exhaust their respective selling sequences at the same moment by coincidence is lower than any single instance.
The 4-hour timeframe is also relevant. TD Sequential signals on shorter timeframes (15-minute, 1-hour) produce noise. On daily charts, they are rarer but slower to confirm. The 4-hour sits at the intersection of intraday momentum and swing-trade relevance — the timeframe where institutional desks and active traders monitor entry zones. A 9 buy signal here is actionable in a way that a 1-hour signal is not. For historical context on how Bitcoin’s on-chain indicators have aligned with cyclical bottoms, see Bitcoin Profit/Loss Ratio ‘Kiss’ — The Signal That Has Marked Every Cycle Bottom.
Bullish Scenario
If buyers confirm the TD Sequential buy signals on all three assets — meaning price closes above each signal candle’s high on the 4-hour chart — the pullback structure is complete and the prior uptrend resumes. For Bitcoin, that means a reclaim of the $84,000–$85,000 zone as the first structural recovery target. For Ethereum, confirmation above $2,570 opens the path back toward $2,620–$2,660. For XRP, a close above $1.45 would represent the first structural higher low since the sell signal fired at $1.53.
Bearish Scenario
If the TD Sequential signals fail to attract buyers and price breaks below the signal candle lows — Bitcoin below $82,150, Ethereum below $2,537, XRP below $1.409 — a fresh bearish count begins. Under that scenario, the 9 buy signals become failed setups, and the next support levels would need to be identified from longer-timeframe charts. Simultaneous failure across all three assets would signal that the October 5 decline has further to run.
The signal is present across three assets simultaneously. Confirmation is not. Bitcoin at $82,957, Ethereum near $2,570, and XRP at $1.409 are each sitting at the exact levels where the TD Sequential says selling is exhausted — and where the next few 4-hour closes will determine whether the pullback ends or extends. Watch Bitcoin’s ability to hold above $82,150 and reclaim $84,000 as the clearest near-term confirmation that the October pullback has found its floor.
Frequently Asked Questions
Does a TD Sequential 9 buy signal guarantee a Bitcoin price reversal?
Why does a simultaneous buy signal across BTC, ETH, and XRP carry more weight than a single signal?
What is the exact confirmation level to watch on Ethereum following the TD Sequential signal?
How did the TD Sequential perform earlier in XRP’s October move?
Source: Ali Charts · Published by CoinsProbe Markets Desk
The opinions and market insights shared on CoinsProbe represent the views of individual authors based on prevailing market conditions at the time of publication. Cryptocurrency investments carry significant risk and volatility. Readers are encouraged to conduct their own research and seek professional financial advice before making investment decisions. CoinsProbe and its contributors do not accept responsibility for financial losses or decisions made based on published content.
CoinsProbe may publish sponsored articles, affiliate links, or promotional collaborations. All sponsored material is clearly labeled to maintain transparency with our audience. Our editorial decisions remain fully independent, and advertising partnerships do not influence reviews, rankings, or published opinions.
Since 2023, CoinsProbe has delivered reliable insights on cryptocurrency, blockchain, and digital assets. Our content is created by experienced researchers and analysts who follow strict editorial standards focused on accuracy, transparency, and credibility. Every article is carefully reviewed and verified using trusted sources and current market data. We provide unbiased analysis and timely updates covering everything from emerging crypto projects to major industry developments.