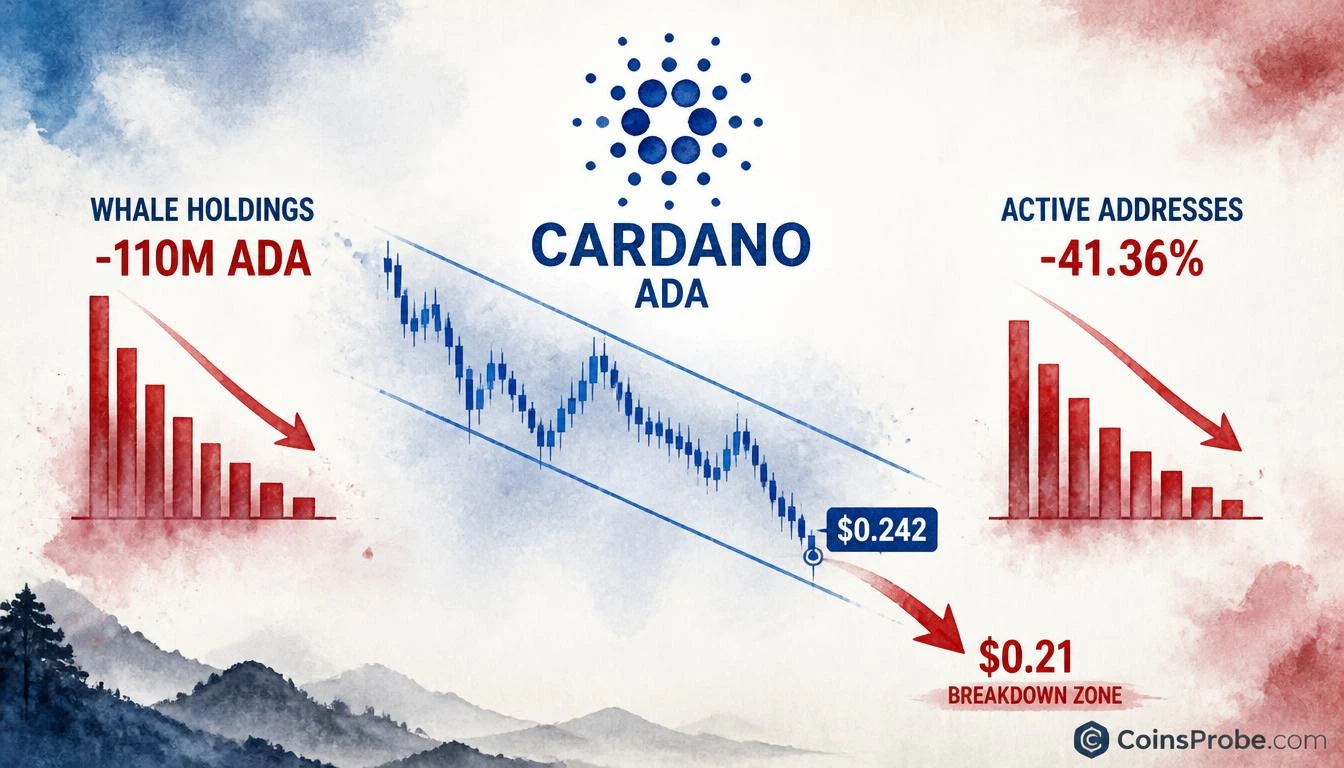

- ADA whales offloaded 110M+ tokens in 5 days, adding sell pressure as price tests rising channel support at $0.242
- Daily active addresses collapsed 41.36% — from 27,248 to 15,977 — per @alicharts' October 12 thread
- $0.242 is the analyst-named decisive level; a daily close below opens $0.21 as the stated downside target
Cardano is flashing a dual warning sign. ADA is trading at approximately $0.242, pressing directly against the lower boundary of a rising channel that has contained price since August — and two independent on-chain signals are now both pointing in the same direction: down.
Crypto analyst Ali Martinez (@alicharts) published a five-part thread on October 12, 2026, concluding that ADA is “ready for big correction.” The call rests on two data points: whale distribution totaling more than 110 million ADA over five days, and a 41.36% collapse in daily active addresses — both occurring simultaneously as price tests a channel support level that has held for roughly two months.
Signal 1 — Whale Distribution: 110M ADA Offloaded in Five Days
Large holders have been systematically reducing exposure. According to @alicharts, whales offloaded more than 110 million ADA over the five days preceding October 12 — adding sustained selling pressure precisely as price compresses toward the channel’s lower boundary. The whale holdings chart, covering roughly days 9 through 12, shows a clear step-down pattern: elevated holdings at the start of the window falling to persistently lower levels, with Y-axis range markers at 2.87B, 2.74B, and 2.61B — reflecting the scale of the distribution relative to total large-holder positioning.
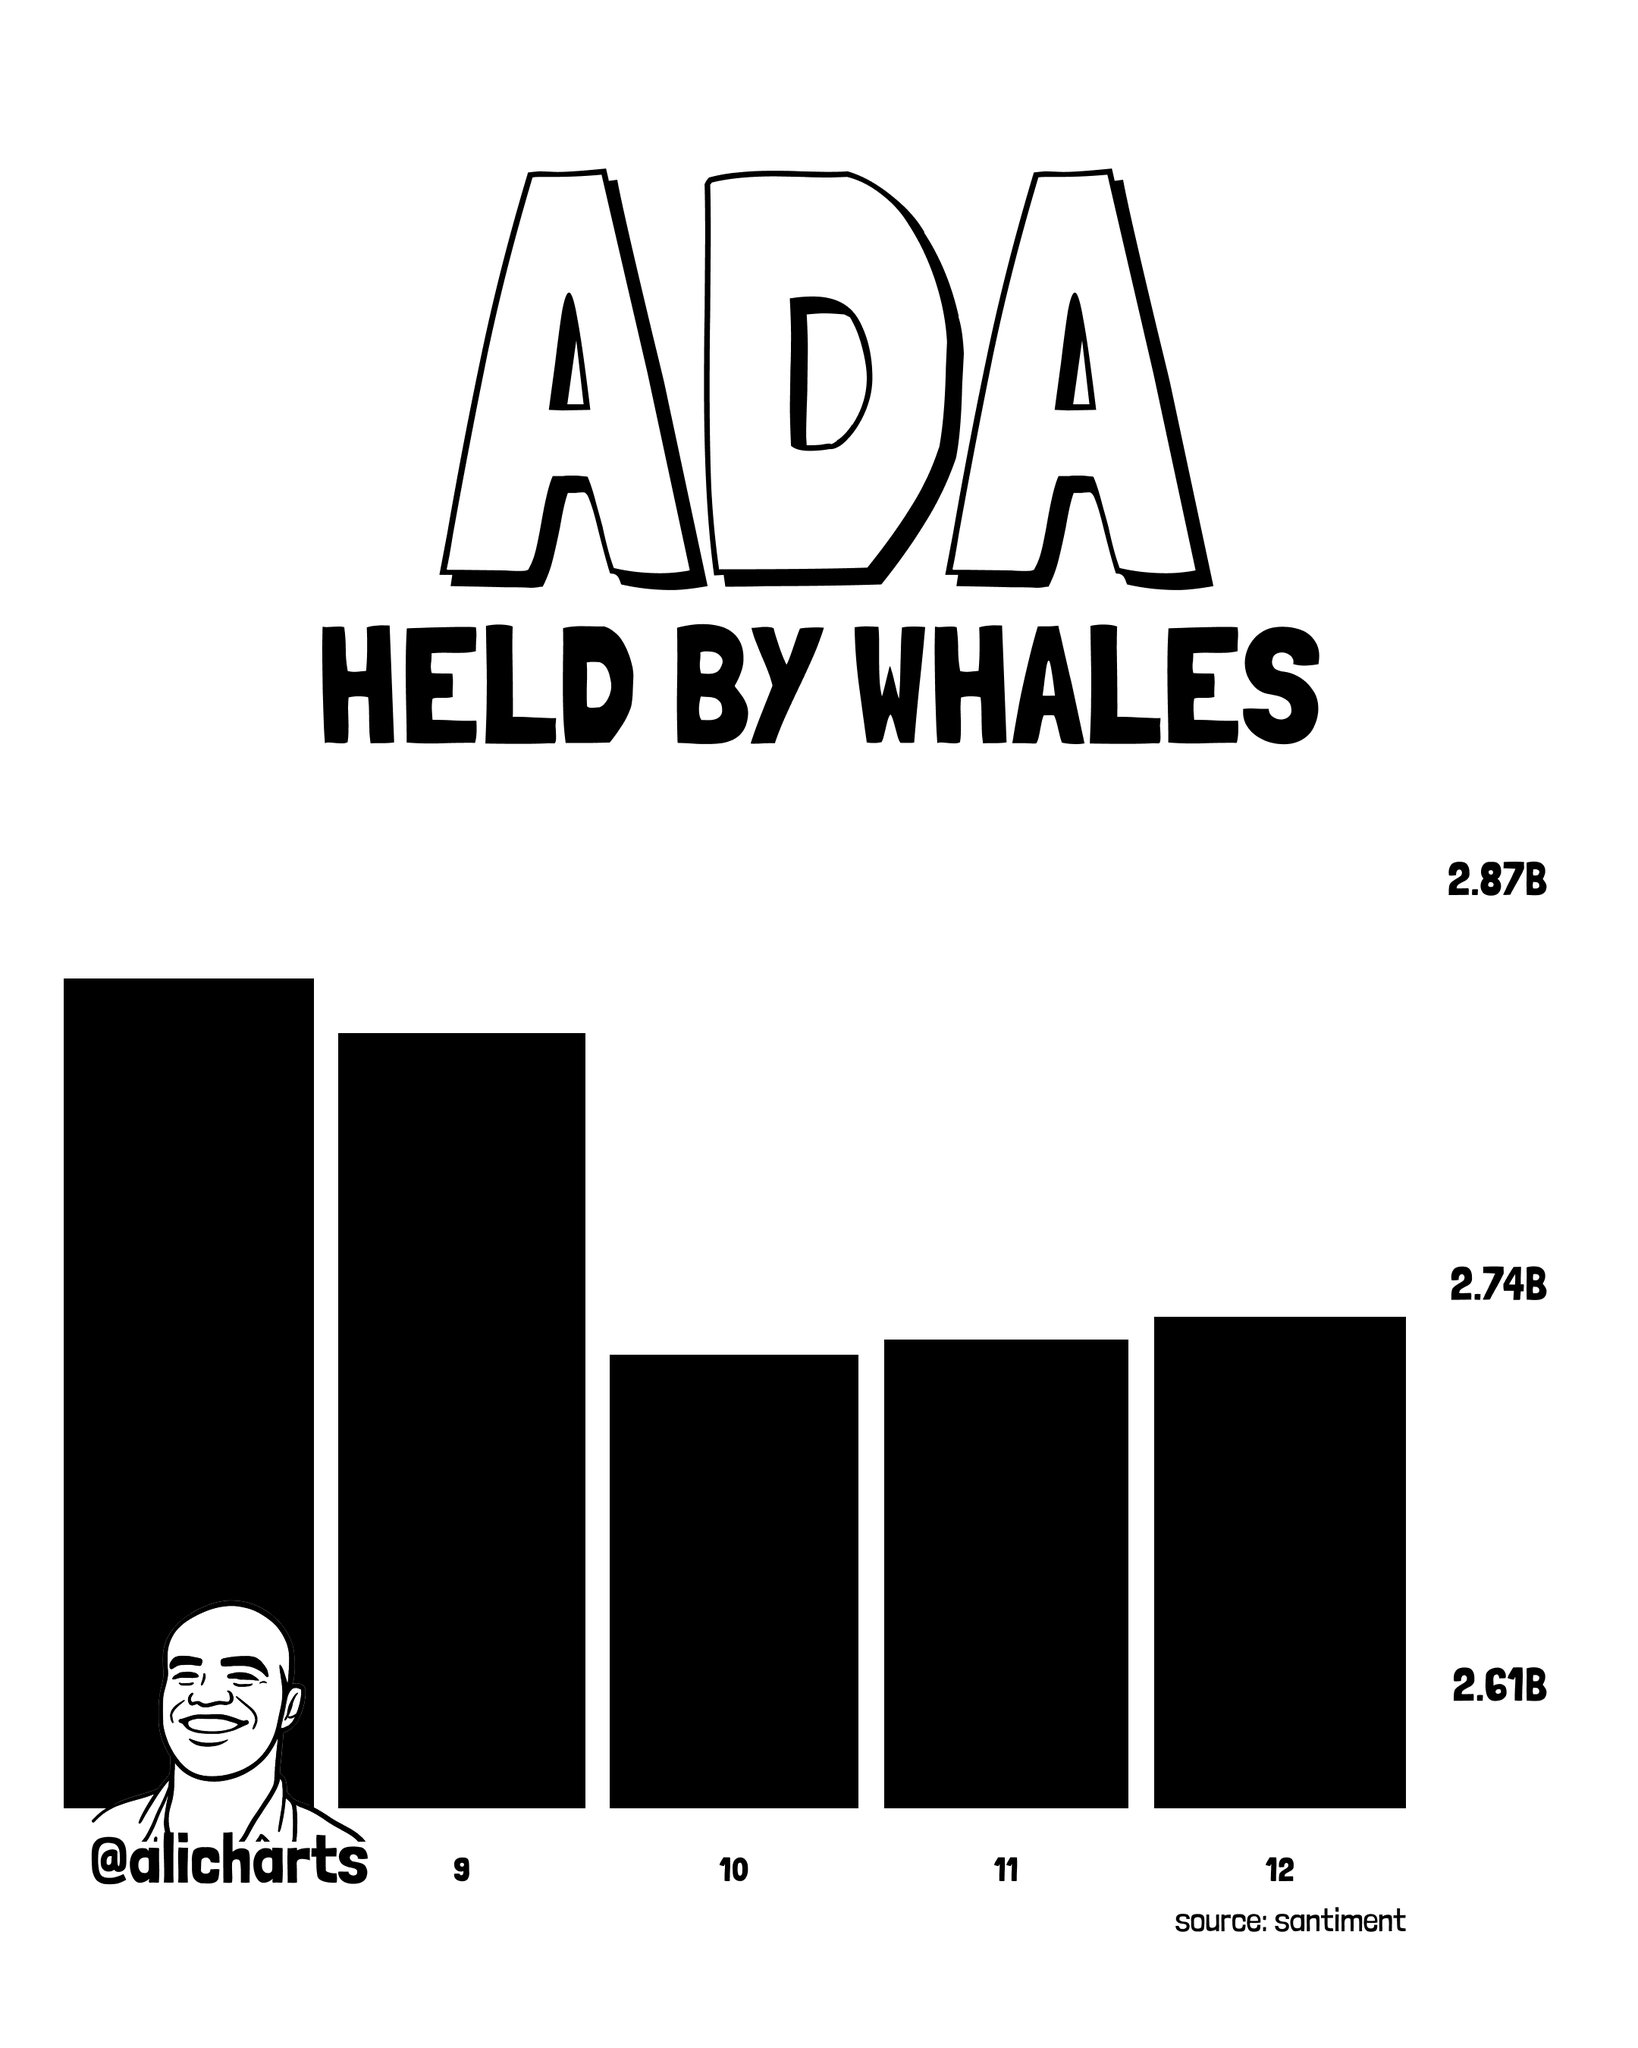
This type of distribution — large holders reducing into a price structure that retail participants may still read as an uptrend — is one of the more reliable bearish setups in on-chain analysis. The 110M ADA figure is not a rounding estimate; it is the analyst’s stated figure from thread post 2 of 5, sourced from on-chain large-holder data. For context on prior ADA whale behavior, ADA futures open interest also fell 9% during a separate whale offload episode earlier this year.
Signal 2 — Network Activity Collapse: Daily Active Addresses Down 41.36%
Simultaneously, user participation on the Cardano network is deteriorating. Daily active addresses have dropped from 27,248 to 15,977 — a decline of 41.36% — over the same five-day window. The network activity chart, covering months 9 through 12, shows an inverted-V pattern: a peak around month 10 followed by declining bars through months 11 and 12, with Y-axis reference markers at 25,700, 19,700, and 13,600 daily active addresses.
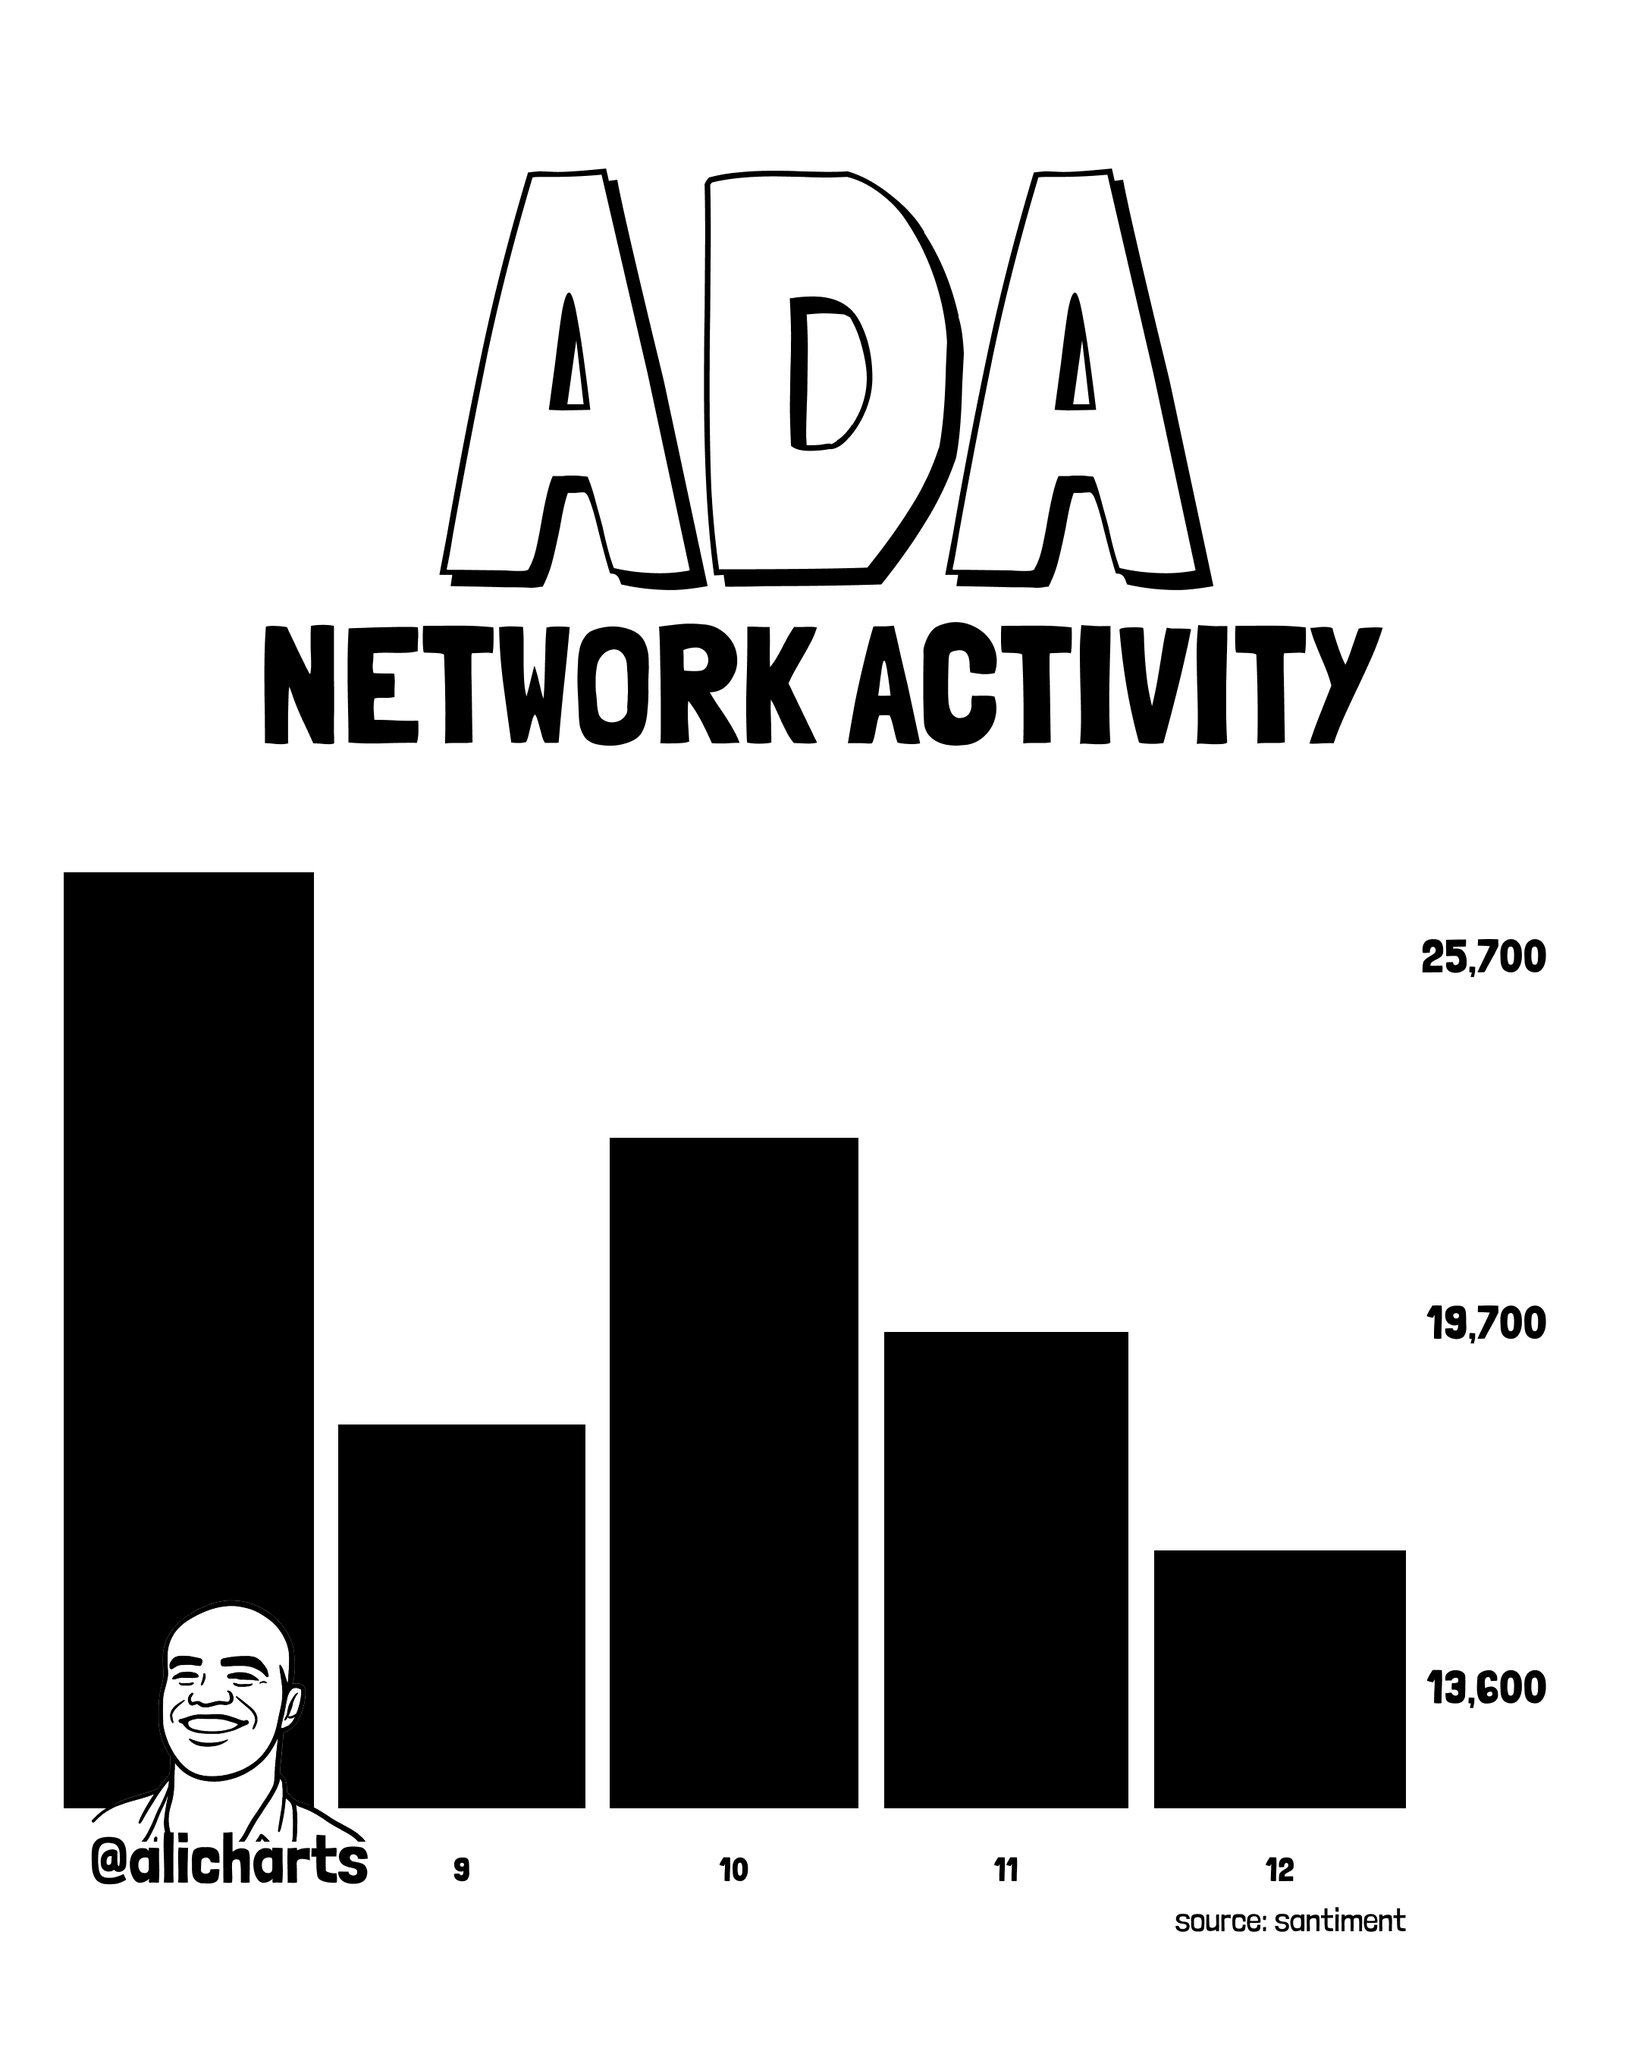
This matters because falling active addresses while whales are selling is a compounding bearish signal — not an additive one. Whale distribution alone can be absorbed if retail demand is growing. When retail participation is simultaneously contracting (as measured by active addresses), there is no natural demand layer to absorb the supply being released by large holders. The two signals reinforce each other, not merely add to each other.
The Chart Structure — $0.242 Support, $0.21 If It Breaks
The daily ADA chart shared by @alicharts shows a rising parallel channel in force since August, with a dotted midline and two solid boundary lines. ADA’s current price of approximately $0.242 is testing the lower solid boundary of that channel — the same level the analyst identifies as the decisive line for the correction thesis. The upper channel resistance is labeled at $0.29 on the chart. The lower boundary, currently acting as support, sits at the $0.242 zone. If that level breaks on a daily close, the analyst’s stated downside target is the channel’s secondary support at $0.21.
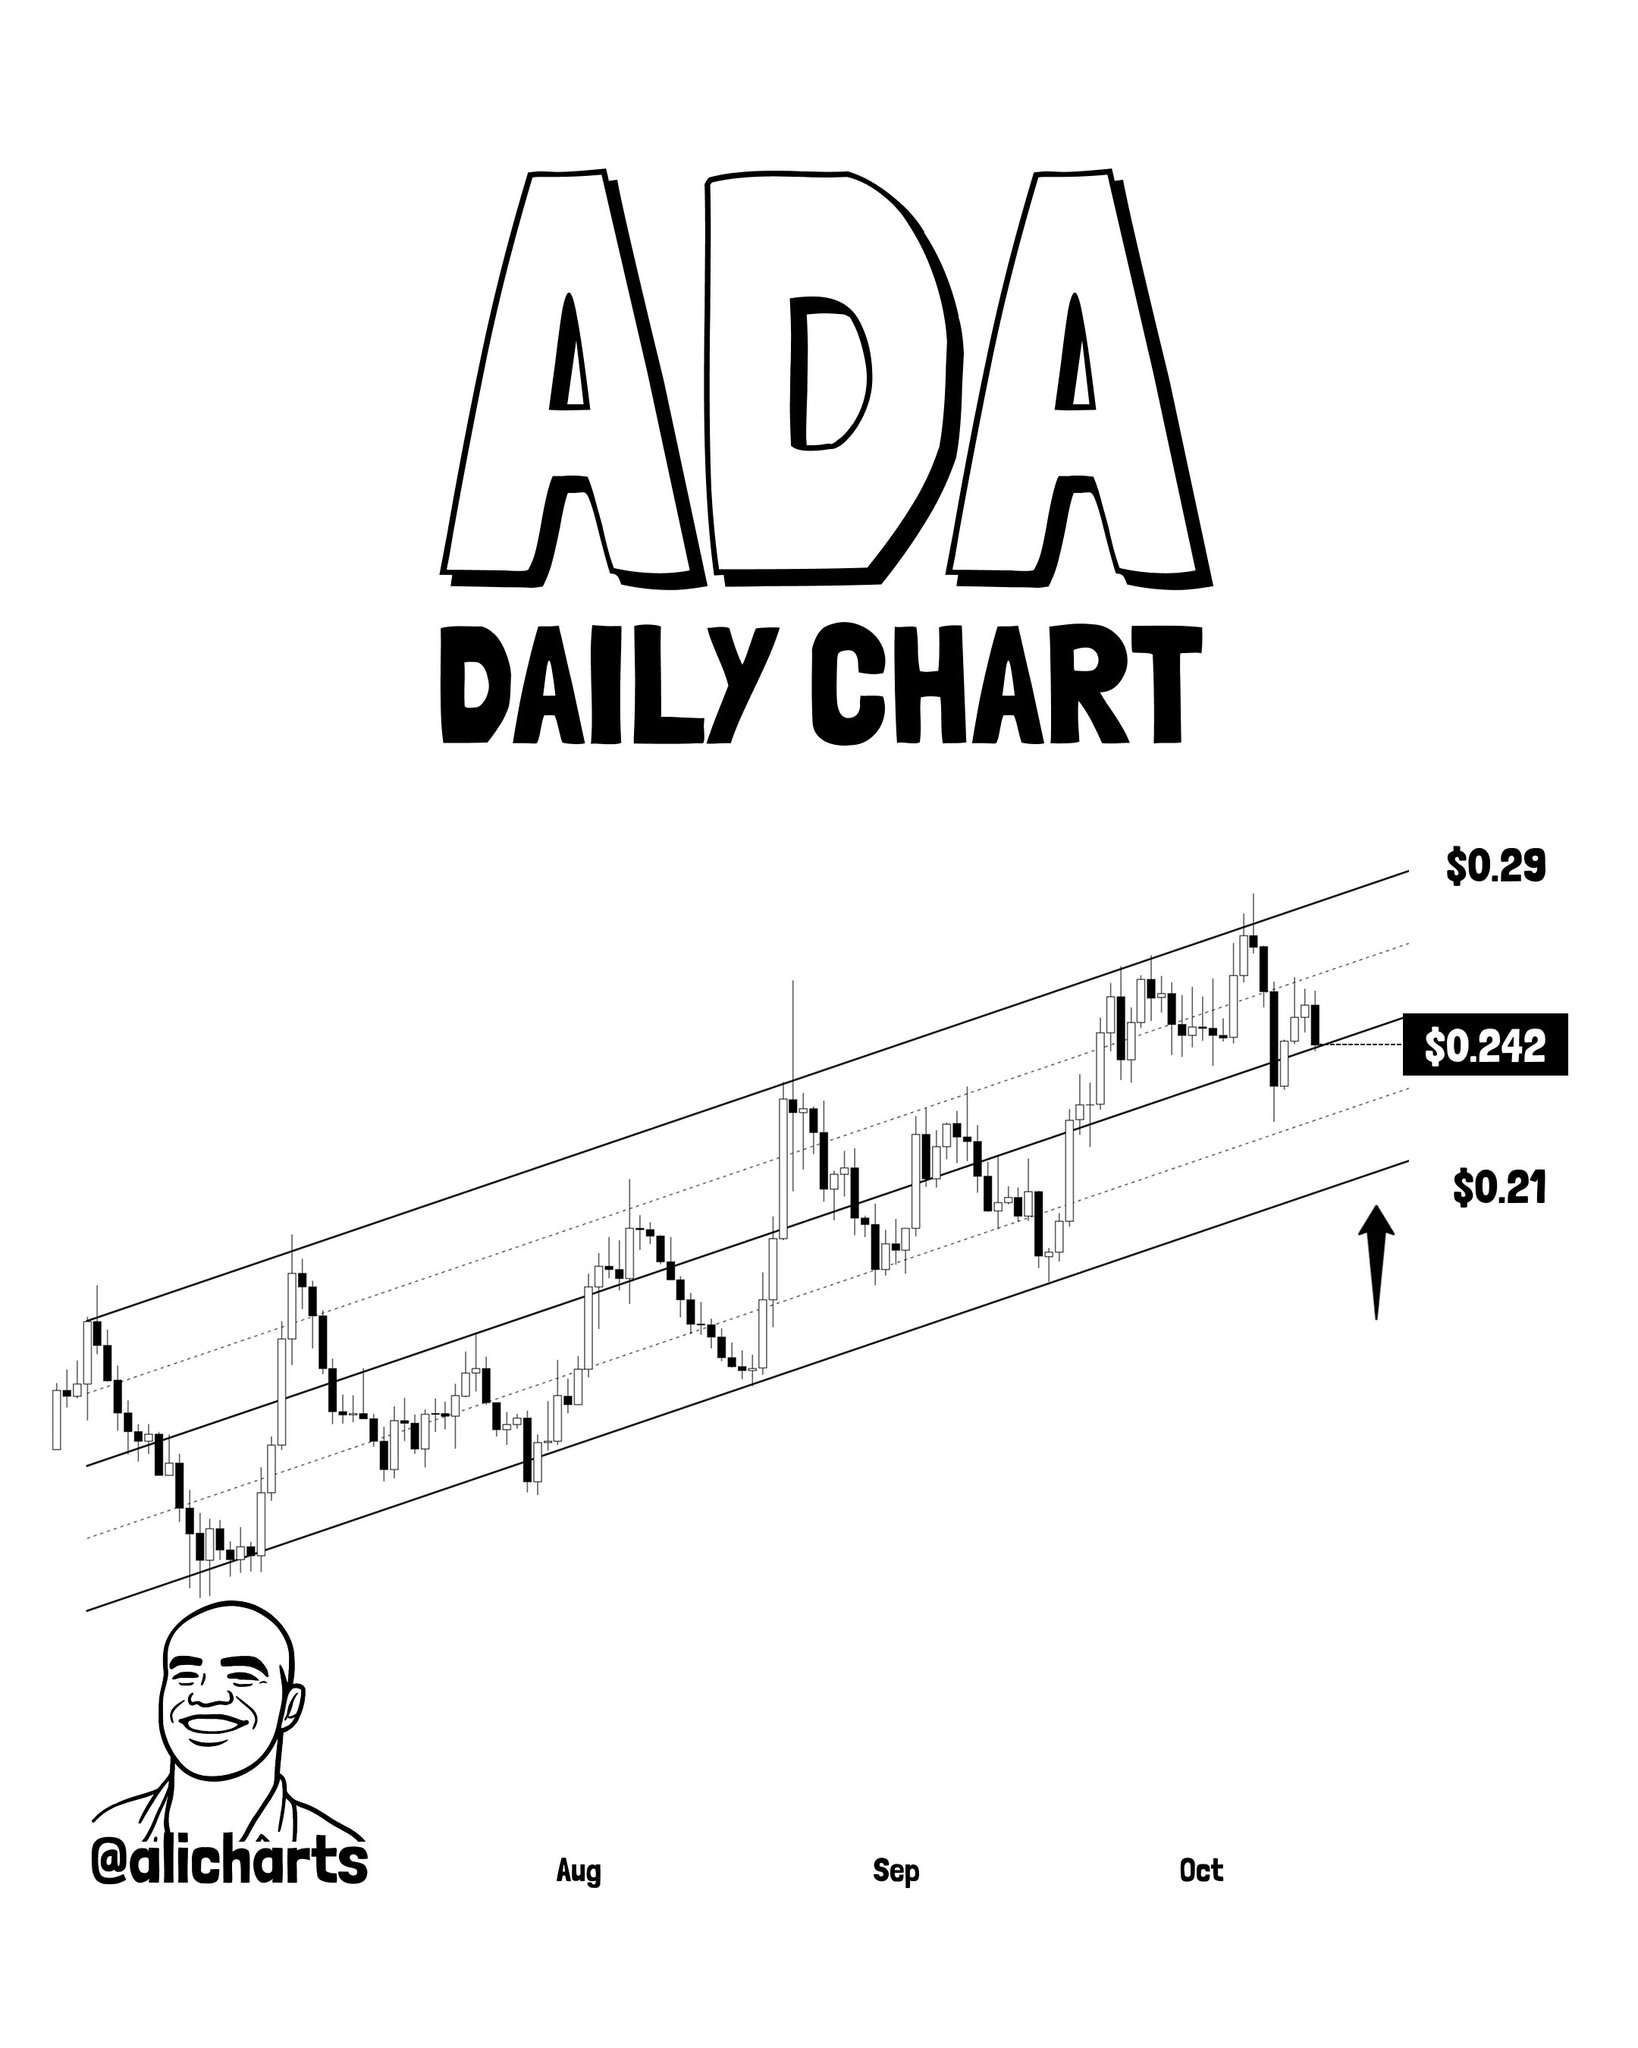
The $0.21 level is not an arbitrary figure — it represents where the channel’s lower boundary will be located on a further breakdown, and it is the only explicit price target @alicharts states in the thread. No upside targets are cited in the note. This article flags no additional levels beyond what the analyst stated. Readers tracking prior ADA technical setups may note that this channel structure sits in the same price range discussed in the broader bearish setup piece covering ADA and SOL.
Why These Two Signals Together Are More Bearish Than Either Alone
Whale distribution without network deterioration can be a rotation — large holders taking profit while new participants step in. Network deterioration without whale selling can be a quiet consolidation period before a re-engagement. When both occur together at a key chart support, the confluence is what the analyst is calling out.
| Signal | Reading | Implication |
|---|---|---|
| Whale holdings | −110M ADA in 5 days | Supply being added to market |
| Daily active addresses | −41.36% (27,248 → 15,977) | Demand layer weakening |
| Channel support | $0.242 (lower boundary) | Decisive level per @alicharts |
| Downside target if break | $0.21 | Analyst-stated secondary support |
Source: @alicharts thread, October 12, 2026
For readers who followed ADA’s last signal cycle, the contrast is notable. Cardano previously printed a TD Sequential buy signal that had preceded 11%–51% rebounds — a bullish setup anchored in the same price range. The current thread is the opposite configuration: distribution at resistance, not accumulation at support.
Bullish Scenario
ADA holds the $0.242 channel support on a daily close, whale selling stabilizes, and active addresses begin recovering. In that case the rising channel structure remains intact and the upper boundary at $0.29 becomes the next logical test. The bearish thesis requires $0.242 to break — if it holds, the analyst’s correction call is invalidated.
Bearish Scenario
A daily close below $0.242 confirms the channel breakdown. @alicharts’ stated downside target is $0.21 — a decline of approximately 13% from the current level. No floor below $0.21 is cited in the analyst’s thread; that level is the sole stated target on a breakdown.
The on-chain case for a correction is specific: 110 million ADA in whale outflows, a 41.36% drop in daily active addresses, and price sitting at the only channel support that separates the current structure from a confirmed breakdown. Whether the correction materializes depends entirely on whether $0.242 holds on a daily closing basis — that is the exact level @alicharts names as decisive.
Source: x.comFrequently Asked Questions
How significant is a 41.36% drop in ADA daily active addresses?
What happens to ADA if $0.242 breaks on a daily close?
Could ADA recover from here despite the whale selling?
Is 110M ADA in whale outflows unusual relative to prior episodes?
Source: Ali Charts · Published by CoinsProbe Markets Desk
The opinions and market insights shared on CoinsProbe represent the views of individual authors based on prevailing market conditions at the time of publication. Cryptocurrency investments carry significant risk and volatility. Readers are encouraged to conduct their own research and seek professional financial advice before making investment decisions. CoinsProbe and its contributors do not accept responsibility for financial losses or decisions made based on published content.
CoinsProbe may publish sponsored articles, affiliate links, or promotional collaborations. All sponsored material is clearly labeled to maintain transparency with our audience. Our editorial decisions remain fully independent, and advertising partnerships do not influence reviews, rankings, or published opinions.
Since 2023, CoinsProbe has delivered reliable insights on cryptocurrency, blockchain, and digital assets. Our content is created by experienced researchers and analysts who follow strict editorial standards focused on accuracy, transparency, and credibility. Every article is carefully reviewed and verified using trusted sources and current market data. We provide unbiased analysis and timely updates covering everything from emerging crypto projects to major industry developments.