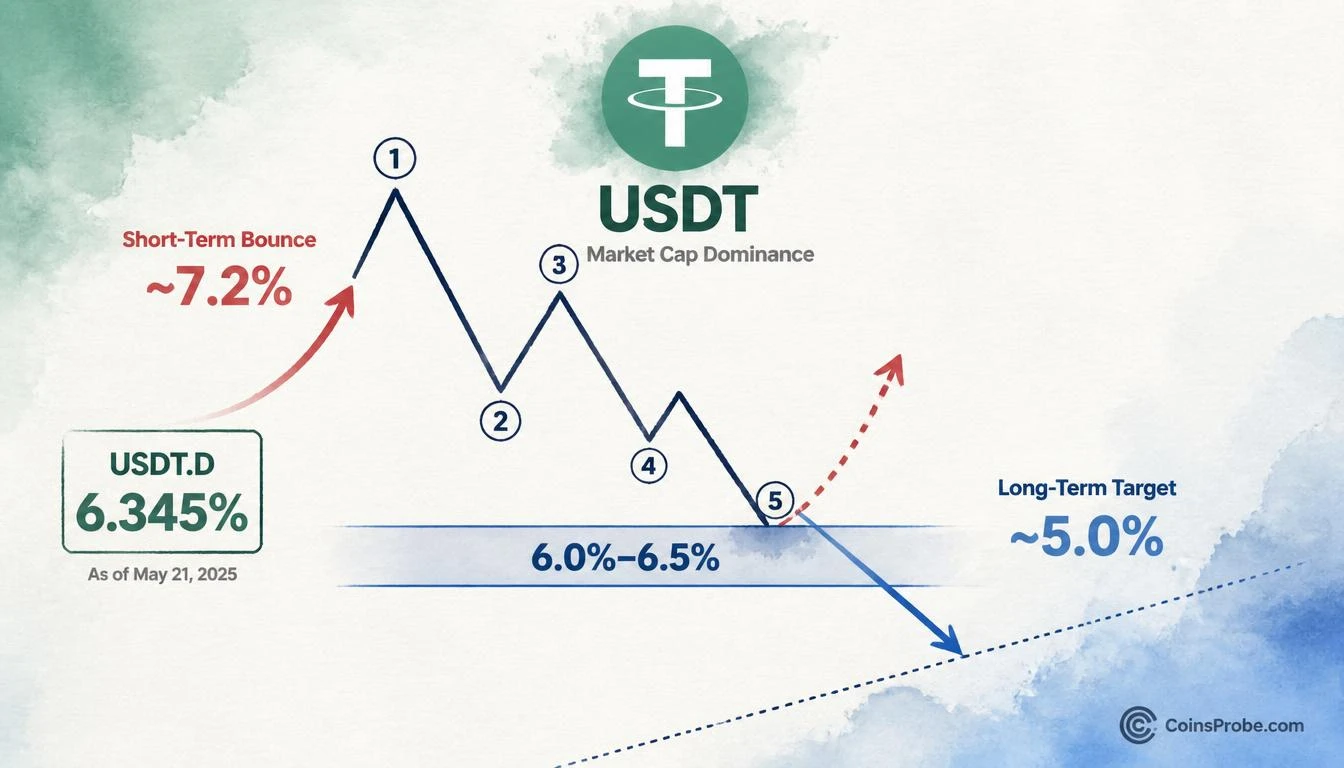

- USDT.D hits 6.345% — inside the 6.0%–6.5% horizontal support zone after a 5-wave Elliott Wave impulse from 9.5% peak
- Analyst @CryptoBullet1 projects a corrective bounce toward ~7.2% USDT.D, signaling a near-term crypto market pullback before resumption lower
- Long-term USDT.D target: ~5.0% ascending trendline — which would represent a major bullish macro expansion for crypto assets
- Invalidation level: a clean break below 6.0% without a bounce would negate the corrective scenario entirely
USDT Dominance is sitting at 6.345% — a level that has become one of the most watched macro indicators in the current crypto cycle. After declining from a peak of approximately 9.5%, USDT.D has completed a full five-wave Elliott Wave impulse move and is now resting directly on a historically significant support zone between 6.0% and 6.5%. What that means for crypto markets in the near term is clear: a corrective bounce in dominance — and a pullback in broader crypto prices — is the most probable short-term outcome before the larger trend reasserts itself.
That is the assessment of analyst @CryptoBullet1, who flagged the setup on September 22, 2026, in a post that has drawn significant attention from market participants. “$USDT.D reached a significant Support zone and completed a 5-wave move,” he wrote. “Expecting a bounce in this area (correction in the crypto market) before going much lower.” The framing here is precise: this is not a blanket bearish call on crypto. It is a two-speed structural read — short-term weakness, long-term continuation of crypto strength.
What USDT Dominance Actually Measures
Before interpreting the signal, the mechanism must be understood. USDT Dominance (USDT.D) measures Tether’s market capitalization as a percentage of total crypto market cap. When dominance rises, capital is rotating into stablecoins — meaning investors are exiting risk assets. When dominance falls, capital is flowing out of stablecoins and into altcoins and Bitcoin — risk appetite is expanding.
It is a macro sentiment gauge, not a price predictor. A bounce in USDT.D does not mean Bitcoin is going to zero. It means the balance of capital flow is temporarily shifting toward caution. The size and duration of that bounce determines the severity of any crypto market pullback.
Signal — Elliott Wave 5-Wave Completion at Support
The 2-day CRYPTOCAP chart shared by @CryptoBullet1 reveals the full structural picture. USDT.D has declined in a textbook five-wave Elliott Wave impulse sequence from its peak near 9.5%, passing through a Wave (2) correction that reached approximately 8.5%, and terminating Wave (5) at the current 6.345% reading — directly inside the blue shaded horizontal support zone spanning roughly 6.0% to 6.5%.
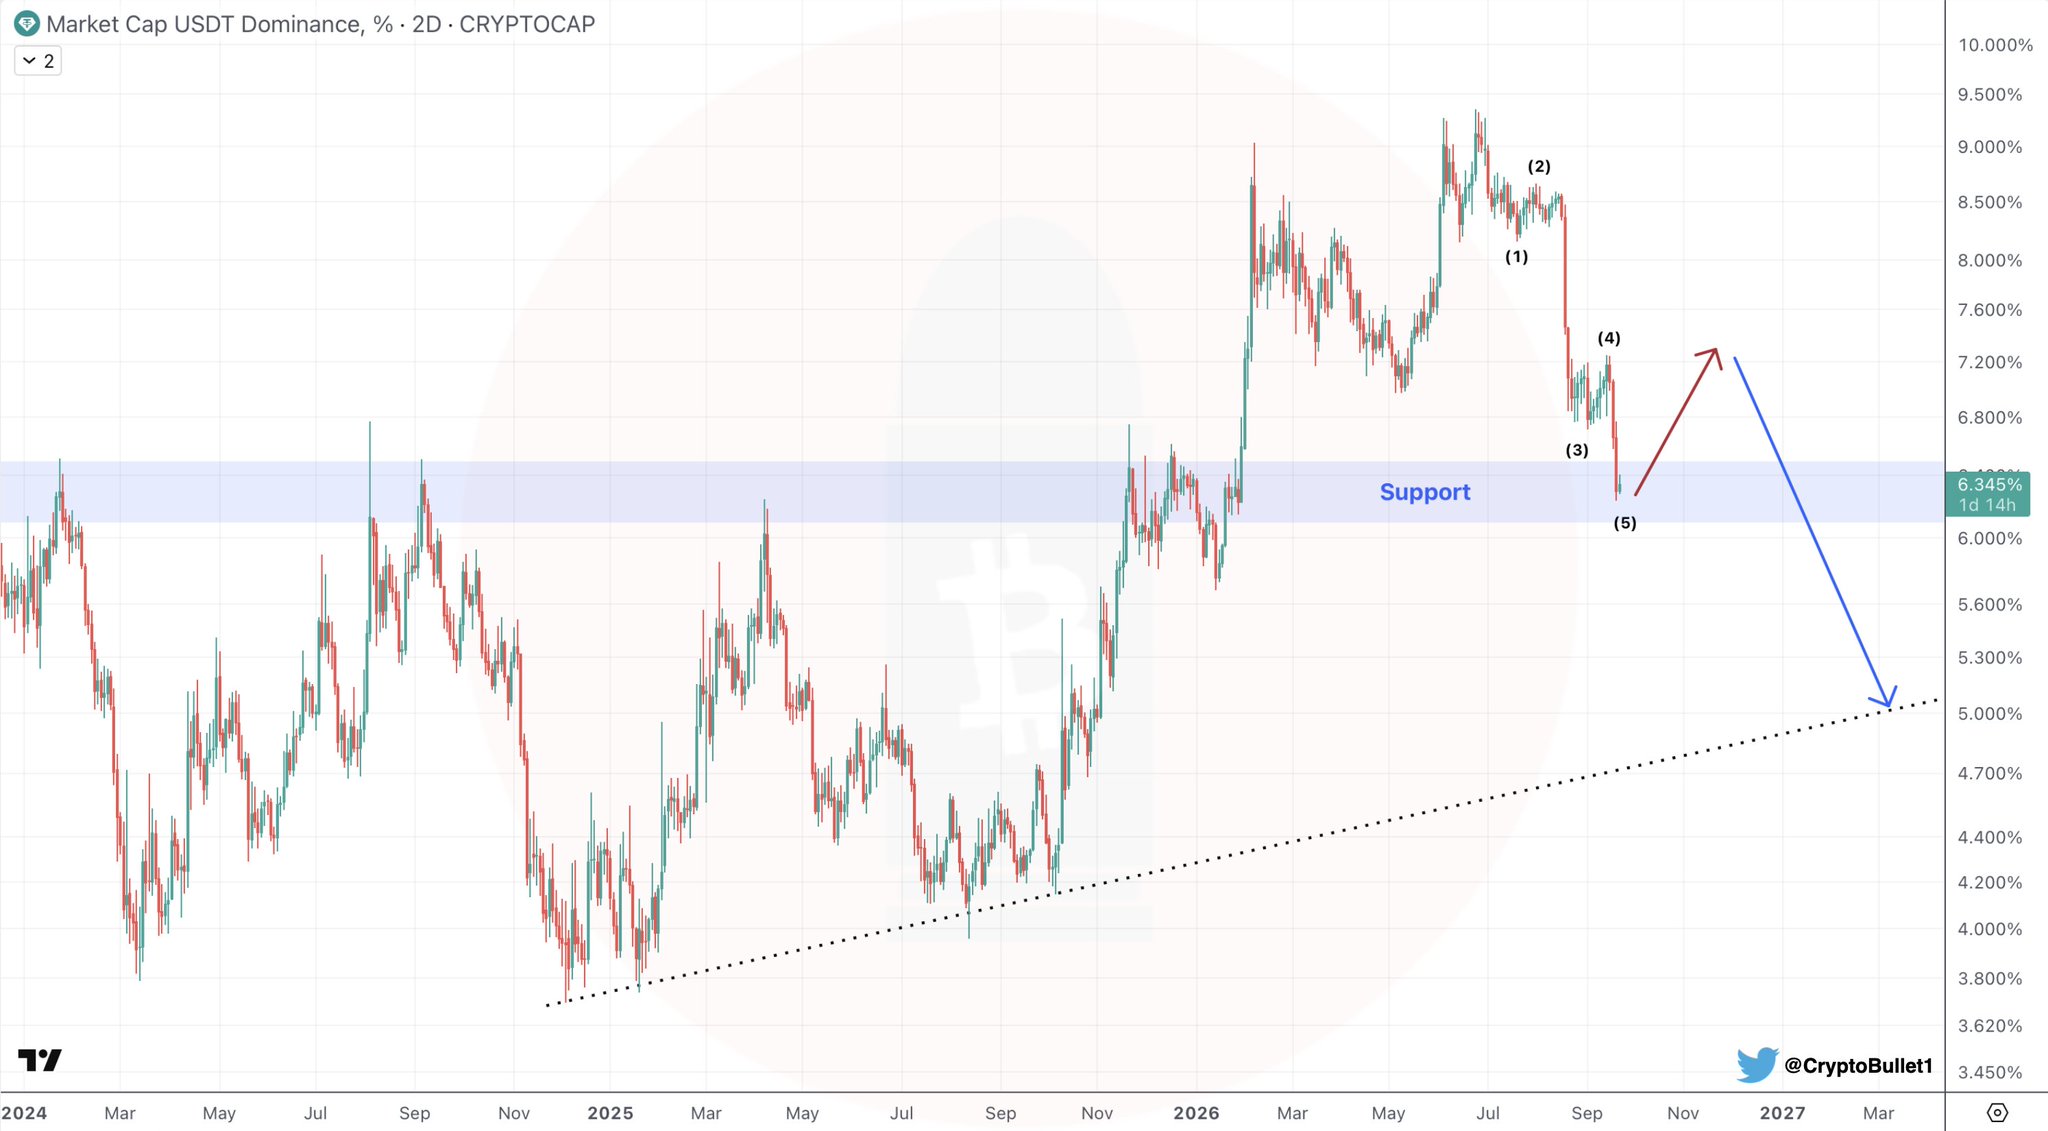
Elliott Wave impulse theory defines a five-wave structure as a complete directional move. The sequence ends at Wave (5), and by definition, what follows is a corrective structure — a retracement against the prior trend. In the context of USDT.D, the prior trend is down (bullish for crypto). The corrective move that follows is therefore up in USDT.D — temporarily bearish for crypto.
The red arrow on @CryptoBullet1’s chart projects this corrective bounce toward approximately 7.2% — roughly 855 basis points above current levels. That degree of USDT.D expansion would represent a meaningful, though temporary, rotation into stablecoins. Following that corrective phase, the blue arrow on the chart projects a resumption of the broader downtrend, targeting the long-term ascending trendline near 5.0% — a level that, if reached, would represent the lowest USDT.D reading in years and a strongly bullish macro backdrop for crypto assets.
What the Chart Says — and What It Doesn’t
What it says: USDT.D has completed a five-wave impulse decline from 9.5% and is now at a documented horizontal support zone (6.0%–6.5%). Corrective bounces follow completed five-wave structures. A move toward 7.2% is the near-term base case.
What it doesn’t say: Elliott Wave counts are inherently subjective. The 5-wave structure @CryptoBullet1 has identified is the dominant read, but an alternate count remains possible. Critically, the analysis does not specify which crypto assets will see the largest drawdown during the corrective bounce phase, nor does it provide a timeline — only that the bounce is expected “in this area.”
What to watch for invalidation: A decisive breakdown below the 6.0% support zone without a corrective bounce would invalidate the five-wave corrective scenario. In that case, the impulsive decline would be accelerating — which would be structurally bullish for crypto immediately, but would require a full recounting of the wave structure.
The Two-Phase Macro Playbook
The @CryptoBullet1 framework presents a two-phase playbook that is worth stating explicitly:
- Phase 1 (Near-term): USDT.D bounces from 6.345% toward ~7.2%. Capital rotates into stablecoins. Crypto market experiences a pullback — altcoins likely absorb more of this pressure than Bitcoin. This is the corrective phase traders should be positioned for.
- Phase 2 (Medium-to-long term): After the corrective bounce exhausts itself, USDT.D resumes its decline toward the ascending trendline at ~5.0%. This would represent a major expansion in crypto market cap as stablecoin capital deploys into risk assets. The setup for that phase begins when the corrective bounce tops out near 7.2%.
For context on the macro environment driving these capital flows, recent on-chain activity has been significant — Bitcoin Whales logged 2,722 million-dollar transactions in a single day, signaling that large-capital participants remain active even as dominance signals a near-term pause. Similarly, understanding what drives sharp single-session Bitcoin moves — as detailed in Bitcoin’s +6.7% Single-Day Surge: Three-Factor Catalyst Explained — matters when interpreting where capital flows during a USDT.D corrective bounce.
Bullish and Bearish Scenarios
Bullish Scenario (for crypto) — USDT.D Bounce Is Shallow and Short-Lived
If the corrective bounce in USDT.D stalls below 7.0% and reverses quickly, the near-term crypto pullback will be minor — likely a 5%–10% consolidation in majors rather than a trend-reversing decline. This would accelerate the timeline for Phase 2 and the eventual decline toward 5.0% USDT.D. In this scenario, altcoins with strong fundamental tailwinds absorb the pullback and recover rapidly.
Bearish Scenario (for crypto) — USDT.D Bounce Extends Beyond 7.5%
If USDT.D overshoots the projected 7.2% corrective target and reclaims the 7.5%–8.0% zone, the corrective phase would be more protracted — implying a sharper, multi-week crypto market drawdown. A reclaim of 8.0% would bring the entire five-wave count into question and suggest a potential shift in the macro dominance trend. The Coinbase Premium Gap analysis is worth monitoring alongside this — as covered in Bitcoin Coinbase Premium Gap Turns Negative at $86K — since US spot demand weakening in tandem with rising USDT.D would compound the bearish near-term signal.
Bottom Line
USDT Dominance has completed a five-wave Elliott Wave impulse decline from 9.5% to 6.345% and is sitting directly on its documented horizontal support zone (6.0%–6.5%). Analyst @CryptoBullet1 identifies this as a corrective bounce setup — a short-term rotation into stablecoins that implies near-term crypto market weakness before the dominant downtrend in USDT.D resumes toward its long-term trendline near 5.0%. The two levels that define what happens next are clear: a bounce toward 7.2% is the near-term base case (crypto pullback), and a sustained break below 6.0% without that bounce invalidates the corrective scenario entirely. Watch 6.0% — a loss of that level without any bounce changes the entire short-term structure.
Frequently Asked Questions
What does a bounce in USDT Dominance mean for crypto markets?
What is the Elliott Wave 5-wave completion signal at USDT.D 6.345%?
What is the long-term target for USDT Dominance after the corrective bounce?
What level would invalidate the USDT.D corrective bounce scenario?
Source: Cryptobullet1 · Published by CoinsProbe Markets Desk
The opinions and market insights shared on CoinsProbe represent the views of individual authors based on prevailing market conditions at the time of publication. Cryptocurrency investments carry significant risk and volatility. Readers are encouraged to conduct their own research and seek professional financial advice before making investment decisions. CoinsProbe and its contributors do not accept responsibility for financial losses or decisions made based on published content.
CoinsProbe may publish sponsored articles, affiliate links, or promotional collaborations. All sponsored material is clearly labeled to maintain transparency with our audience. Our editorial decisions remain fully independent, and advertising partnerships do not influence reviews, rankings, or published opinions.
Since 2023, CoinsProbe has delivered reliable insights on cryptocurrency, blockchain, and digital assets. Our content is created by experienced researchers and analysts who follow strict editorial standards focused on accuracy, transparency, and credibility. Every article is carefully reviewed and verified using trusted sources and current market data. We provide unbiased analysis and timely updates covering everything from emerging crypto projects to major industry developments.