
- Bitcoin trades at $83,292 (-0.08% 24h) as CryptoQuant CEO Ki Young Ju declares the bear cycle structurally over
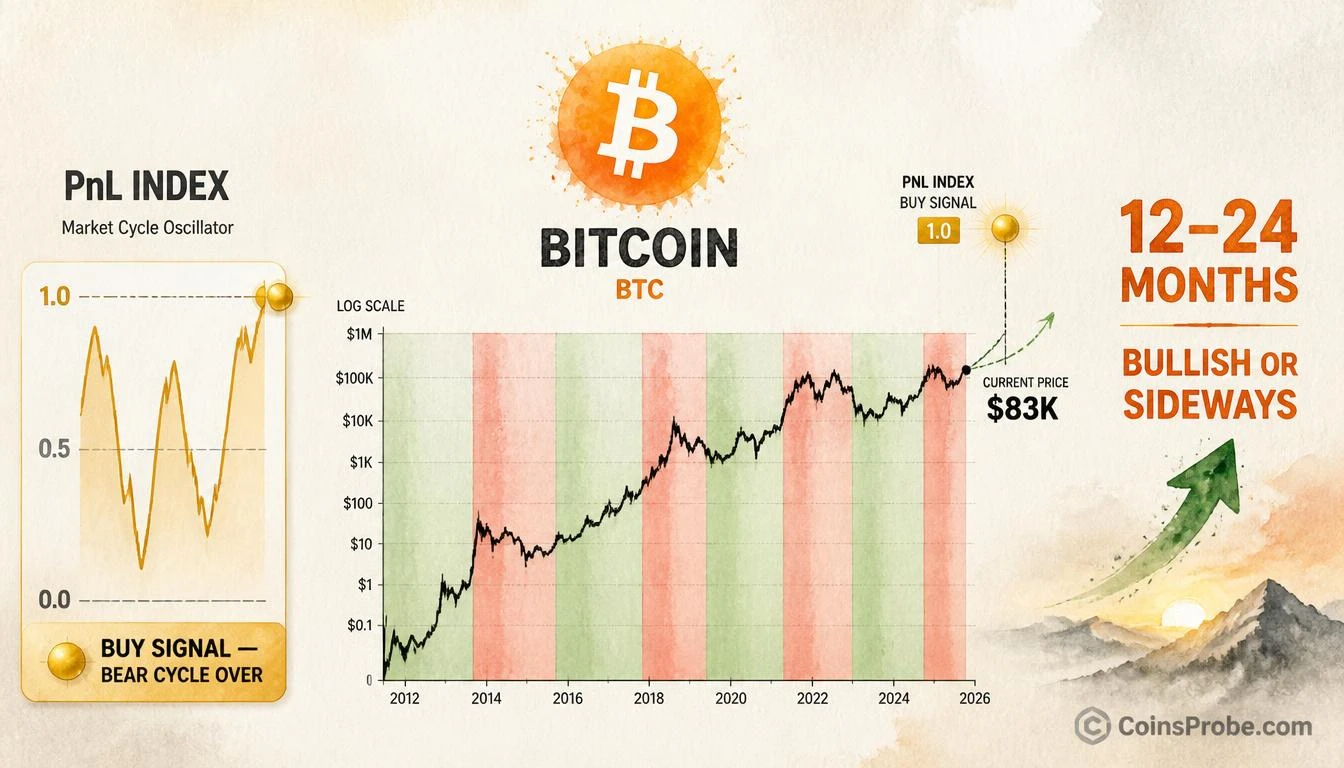
- CryptoQuant's PnL Index has returned to a Buy signal reading of 1.0 — matching identical setups at every prior cycle accumulation zone since 2013
- Spot Bitcoin ETF net inflows average $2.1B per week with cumulative inflows exceeding $30B (Farside Investors)
- Ki Young Ju projects 12–24 months of bullish or sideways price action; Bitcoin exchange reserves sit at a 14-month low (Glassnode)
Bitcoin is trading at $83,292 — down just 0.08% over the past 24 hours — with a market capitalization of $1.67 trillion. Behind that flat daily candle sits one of the most direct declarations this cycle: the Bitcoin bear cycle is structurally over.
That conclusion comes from Ki Young Ju (@ki_young_ju), CEO of CryptoQuant and one of the most closely followed on-chain analysts in the industry. His post states without qualification: “Bitcoin bear cycle is over, expecting 12–24 months of bullish or sideways price action.” The declaration is anchored to CryptoQuant’s proprietary PnL Index — a composite indicator that has cycled through every Bitcoin bear and bull market since 2013.
The PnL Index — What It Measures and What It Is Saying Now
The PnL Index aggregates unrealized profit and loss across the Bitcoin network into a single normalized oscillator ranging from 0 to 1. At readings near 1, the market is deeply profitable on an aggregate basis — a condition historically associated with peak euphoria and distribution. At readings near 0, the network sits in broad unrealized loss — the structural condition of bear market capitulation and long-term accumulation. The index does not measure price direction. It measures the realized cost basis of the entire network relative to current price.
The long-term logarithmic chart shared by Ki Young Ju — spanning Bitcoin’s complete price history from 2013 through the present — shows the PnL Index has returned to a Buy signal level of 1.0, marked with a gold circle identical to those appearing at every prior cycle accumulation zone. Green vertical bands on the chart identify prior Buy signal periods; red bands identify prior Sell signal exhaustion zones. The black price line — plotted on a logarithmic right axis running from $1 to $10,000 and beyond — follows a consistent upward trajectory through each cycle. The current reading, with Bitcoin’s chart label reading $81,700 at the time of the chart capture, places the PnL Buy signal at a level that has preceded every major Bitcoin bull market in the data set.
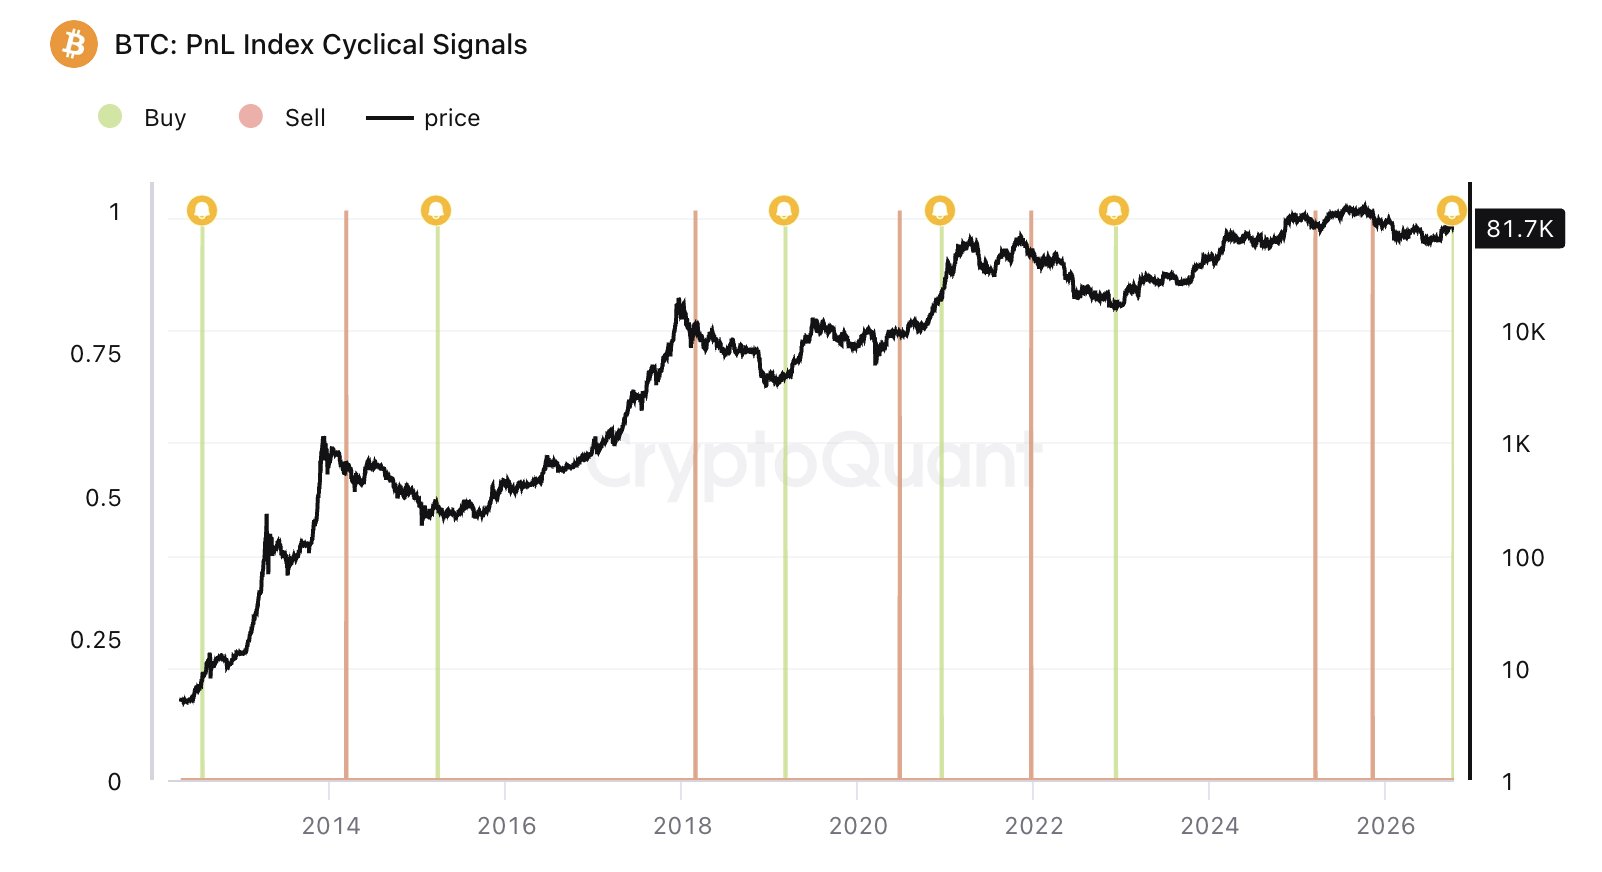
This is not a hedged reading. Ki Young Ju is making a regime declaration: the bear cycle that followed the 2021 peak has ended, and the next 12 to 24 months are expected to produce either bullish price action or, at minimum, sideways consolidation. In on-chain cycle analysis, sideways at elevated PnL readings is structurally different from sideways at depressed readings — it represents distribution and digestion, not capitulation.
The On-Chain Environment Supporting the Call
The PnL Index declaration does not exist in isolation. Several independently verified on-chain metrics corroborate the regime shift Ki Young Ju is describing.
Bitcoin exchange reserves have fallen to multi-year lows — as tracked in Bitcoin Exchange Reserves Fall to 2.67M BTC — A Supply Squeeze Building at $83K — with Glassnode confirming reserves at a 14-month low. Supply leaving exchanges is a structural indicator of long-term holder accumulation, not short-term speculation. When the PnL Index reaches a Buy signal simultaneously with declining exchange reserves, the combination suggests conviction among holders, not panic distribution.
Spot Bitcoin ETF net inflows have averaged $2.1 billion per week since their January 2024 launch, according to Farside Investors data. Cumulative inflows have exceeded $30 billion. BlackRock and Fidelity 13F filings confirm sustained institutional accumulation across multiple quarters. This demand structure did not exist in the 2018–2019 bear market or the 2022 bear market — it represents a fundamentally different buyer base entering the market at scale. Separately, institutional selling dynamics have added complexity to the picture, as detailed in U.S. Institutions Are Selling BTC Faster Than Binance Traders: CryptoQuant — which underscores why Ki Young Ju’s 12–24 month window includes sideways as a legitimate scenario, not just a directional bull case.
Bitcoin’s 200-week moving average has maintained a firmly upward trajectory since late 2022 — the same structural floor that held during the post-FTX collapse. Every prior Bitcoin bear market ended with price reclaiming the 200-week moving average and holding it. The current configuration shows price above that average, consistent with Ki Young Ju’s regime conclusion.
Why “12–24 Months of Bullish or Sideways” Is a Precise Statement
The specific framing of Ki Young Ju’s projection deserves attention. He does not say “Bitcoin will rally to X.” He does not provide a price target. The 12–24 month window with a dual outcome — bullish or sideways — reflects what the PnL Index actually tells an analyst: that the structural conditions for a bear market (broad network-wide unrealized losses, capitulation selling, declining realized price) have resolved. What the index cannot determine is the magnitude or pace of what follows.
In prior cycles, the same Buy signal on the PnL Index appeared at accumulation zones before sustained multi-month rallies. The chart’s green bands — each marking a Buy signal period — precede the logarithmic upward legs in Bitcoin’s price history. The 2015 bottom, the 2018–2019 accumulation zone, and the 2022 post-FTX recovery all produced green band readings before the next major price expansion. The current gold circle at value 1.0 matches those prior structural setups.
The April 2024 halving reduced Bitcoin’s block subsidy from 6.25 BTC to 3.125 BTC per block. Supply shocks of this magnitude have historically taken 12–18 months to fully propagate through price — a timeline that aligns precisely with Ki Young Ju’s 12–24 month projection window.
Bullish Scenario
If Bitcoin sustains current exchange reserve drawdowns while spot ETF inflows maintain their weekly average above $2.1 billion, the PnL Index Buy signal conditions remain intact. Prior cycles with comparable Buy signal entries preceded the logarithmic price expansion phases visible on Ki Young Ju’s chart. A 12–24 month bullish phase would place the timeline extending into mid-to-late 2027.
Bearish Scenario
Ki Young Ju’s note includes sideways as an explicit scenario — not a failure mode. The risk to the bullish reading would be a structural reversal in ETF inflows turning to sustained net redemptions, or a macro shock forcing institutional liquidation before the halving supply shock fully transmits to price. If exchange reserves begin rising sharply — reversing the 14-month drawdown trend — that would challenge the on-chain accumulation thesis supporting the PnL Buy signal call.
At $83,292, Bitcoin is holding within the range that produced Ki Young Ju’s PnL Index Buy signal. The bear cycle declaration from CryptoQuant’s CEO is one of the most direct on-chain regime calls of this cycle. The 12–24 month window begins now. Watch spot ETF weekly inflow data from Farside Investors and Glassnode’s exchange reserve figures — those two metrics will determine whether the sideways scenario or the bullish scenario within Ki Young Ju’s range resolves first.
Source: x.comFrequently Asked Questions
What is CryptoQuant’s PnL Index and why does its Buy signal matter?
Does Ki Young Ju give a specific Bitcoin price target in his bear cycle call?
What on-chain data supports the bear cycle conclusion beyond the PnL Index?
When did the April 2024 halving occur and how does it relate to the 12–24 month projection?
Source: Ki Young Ju · Published by CoinsProbe Markets Desk
The opinions and market insights shared on CoinsProbe represent the views of individual authors based on prevailing market conditions at the time of publication. Cryptocurrency investments carry significant risk and volatility. Readers are encouraged to conduct their own research and seek professional financial advice before making investment decisions. CoinsProbe and its contributors do not accept responsibility for financial losses or decisions made based on published content.
CoinsProbe may publish sponsored articles, affiliate links, or promotional collaborations. All sponsored material is clearly labeled to maintain transparency with our audience. Our editorial decisions remain fully independent, and advertising partnerships do not influence reviews, rankings, or published opinions.
Since 2023, CoinsProbe has delivered reliable insights on cryptocurrency, blockchain, and digital assets. Our content is created by experienced researchers and analysts who follow strict editorial standards focused on accuracy, transparency, and credibility. Every article is carefully reviewed and verified using trusted sources and current market data. We provide unbiased analysis and timely updates covering everything from emerging crypto projects to major industry developments.