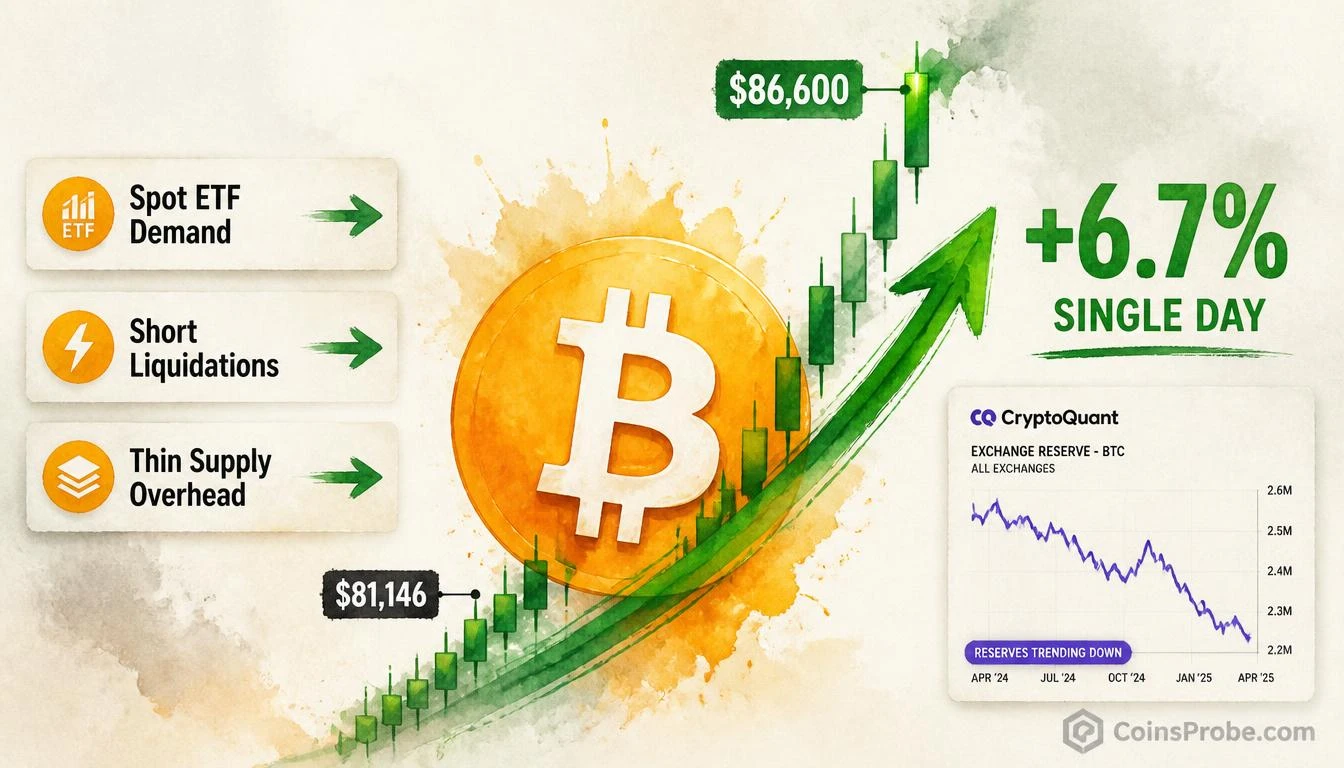

- Bitcoin surged +6.7% in a single session — from $81,146 to $86,600 — per CryptoQuant on-chain data
- Three named catalysts: spot ETF demand, short liquidations above $81K, and thin cost-basis supply overhead
- 7-day % change hit ~8–9% — highest sustained weekly reading since the August spike, per CryptoQuant chart
- Watch $86,600 as key level — daily close above validates level shift; loss of $81,000 signals mean reversion
Bitcoin posted a +6.7% single-session move — climbing from $81,146 to $86,600 in one trading day — with a market capitalization now sitting at approximately $1.73 trillion. This was not a drift higher on ambient optimism. CryptoQuant’s data team identified three simultaneous, structurally distinct forces converging in the same session window, each amplifying the other. At the time of writing, Bitcoin is trading at approximately $85,964, holding the bulk of that single-day gain with 24-hour volume at $56.75 billion.
The analysis comes directly from @cryptoquant_com, the on-chain data platform that tracks institutional flows, realized supply, and derivatives positioning across the Bitcoin market in real time. Their post-move breakdown reduced the session to three named variables: “Spot ETF demand + short liquidations + little historical supply.” Each of those three factors is independently significant. Together, they created the conditions for a move that most directional bets could not have anticipated purely from chart structure.
The Three-Factor Catalyst — Dissected
Catalyst 1 — Spot ETF Demand
Spot Bitcoin ETFs do not operate like derivatives. When ETF inflows arrive, the issuer must purchase actual BTC from the open market — creating real, non-synthetic buy pressure. Unlike futures-based demand, which can be offset by corresponding short positions, spot ETF demand removes Bitcoin from circulating supply permanently for the duration of the holding. CryptoQuant’s data confirmed that this institutional-grade purchasing activity contributed to the upward price pressure during the session that produced the $81,146 → $86,600 move. For deeper context on how ETF flows interact with Bitcoin’s price structure, see this related CoinsProbe analysis: Bitcoin Coinbase Premium Gap Turns Negative at $86K — What It Means.
Catalyst 2 — Short Liquidations
As Bitcoin cleared the $81,000 resistance zone — a level that had served as a ceiling during the preceding consolidation — derivatives positions betting on a continuation lower were automatically closed by exchanges. These forced buy orders, known as short liquidations, add momentum to an upside break because they convert bearish positions into market buy orders at precisely the moment when supply overhead is thinnest. The mechanism is reflexive: price rises, triggers liquidations, liquidations add buying pressure, price rises further. CryptoQuant’s attribution of short liquidations as a named driver confirms this cascade was measurable in the derivatives data, not merely implied.
Catalyst 3 — Thin Historical Supply Overhead
On-chain supply analysis distinguishes between Bitcoin held at a profit versus Bitcoin held at a loss relative to current prices. Above $81,000 at the time of the move, CryptoQuant’s data indicated little historical supply — meaning relatively few coins were last moved at prices in the $81,000–$90,000 range. This matters because holders who acquired BTC in a given zone tend to sell when prices return to that zone (cost-basis selling). With that overhead supply structurally absent, buy pressure from Catalyst 1 and Catalyst 2 encountered minimal natural sell-side resistance — allowing price to travel $5,454 in a single session.
The 7-Day Chart: What CryptoQuant’s Data Shows
The 7-day rolling percentage change chart published by @cryptoquant_com, spanning April through late September, maps both the price trajectory and momentum readings across the full six-month window. The chart marks a support zone at approximately $57,500 — the June low — and shows Bitcoin consolidating near the $67,500 base reference level before the September session break. The right edge of the chart displays a sharp green spike confirming the +6.7% surge, with the 7-day percentage change reading reaching approximately 8–9% at its peak — the highest sustained weekly reading since a comparable spike in late August. That August spike, visible in the chart’s mid-section, preceded a pullback — a pattern worth noting for risk management. The three-factor convergence drove Bitcoin decisively through the $81,000–$86,600 resistance band, with the rightmost price point anchored at $86,600.
What the Move Does and Doesn’t Say
What it says: Three independent demand and supply mechanisms aligned in a single session. Spot ETF inflows provided foundational buy pressure. Short liquidations above $81,000 amplified the move mechanically. Thin cost-basis supply overhead removed natural selling resistance. The result was a $5,454 single-day gain with measurable on-chain confirmation.
What it doesn’t say: A single-session three-factor spike does not confirm a sustained trend change. CryptoQuant’s own chart analysis notes that prior large green spikes — including the August instance — corrected within days. The short liquidation component is by definition a one-time event: once the overleveraged short positions are cleared, that particular buy-pressure source is exhausted.
What to watch for continuation: Whether spot ETF demand sustains at elevated inflow rates in subsequent sessions. DeFiLlama and SoSoValue ETF flow trackers update daily figures in real time. A second consecutive session of institutional ETF inflows without a proportional pullback would structurally separate this move from a pure short squeeze. The Ethereum ETF approval narrative — covered in this CoinsProbe analysis on BlackRock’s Ethereum ETF approach — provides parallel context for how institutional ETF demand reshapes market microstructure.
The Supply Map Above $86,600
With Bitcoin currently at $85,964 — marginally below the session high of $86,600 — the immediate structural question is what the cost-basis supply distribution looks like above the current price. CryptoQuant’s analysis identified thin supply as a key driver of the move to $86,600. Whether that thinness extends meaningfully above $86,600, or whether a denser cost-basis cluster exists at higher levels, determines how much additional resistance Bitcoin faces. The $86,600 level now converts from a resistance zone into the first support reference — a close below it reopens the $81,000 area as the next meaningful anchor.
Bullish Scenario — Sustained Hold Above $86,600
If Bitcoin reclaims and holds a daily close above $86,600, it signals that the three-factor catalyst produced a genuine level shift rather than a temporary spike. With thin supply overhead confirmed by CryptoQuant’s analysis, the next structural resistance zone referenced in the data sits in the $90,000–$95,000 range — an area with denser historical cost-basis concentration from the late 2024 / early 2025 distribution period.
Bearish Scenario — Rejection Back Below $81,000
If Bitcoin fails to sustain above $86,600 and revisits $81,000, the move is classified as a short-squeeze-driven spike followed by mean reversion — consistent with the August spike pattern visible in CryptoQuant’s 7-day chart. A loss of $81,000 on a daily close would re-expose the $75,000–$77,000 demand zone as the next structural test. CryptoQuant’s chart specifically flagged mean reversion risk: “prior large green spikes corrected within days.”
The Three Drivers — At a Glance
| Driver | Mechanism | Exhaustion Risk |
|---|---|---|
| Spot ETF Demand | Real BTC purchased from open market; removes circulating supply | Low — ongoing if inflows persist |
| Short Liquidations | Forced buy orders from cleared short positions above $81K | High — one-time event per level |
| Thin Supply Overhead | Low cost-basis concentration above $81K reduces sell resistance | Moderate — supply thins further above or clusters at higher levels |
Source: CryptoQuant (@cryptoquant_com)
Bottom Line
Bitcoin’s +6.7% single-session move from $81,146 to $86,600 was not chart-pattern noise. CryptoQuant’s data team attributed it to three named, structurally distinct forces: spot ETF demand creating real buy pressure, short liquidations above $81,000 triggering a forced-buy cascade, and thin historical supply overhead removing natural sell resistance. Each factor is independently verifiable in on-chain and derivatives data. At $85,964, Bitcoin is holding the majority of the gain — but the short liquidation component is, by definition, spent. Whether the move extends from here depends entirely on whether spot ETF inflow data confirms sustained institutional demand in subsequent sessions. Watch $86,600 — a clean daily close above it validates a level shift; a rejection back below $81,000 classifies this as a technically-driven spike with no fundamental follow-through.
Source: x.comFrequently Asked Questions
Why did Bitcoin jump +6.7% in a single day according to CryptoQuant?
What does ‘thin historical supply overhead’ mean for Bitcoin’s price?
Are short liquidations a sustainable driver of Bitcoin’s price rally?
What price level is most critical for Bitcoin after this move?
Source: CryptoQuant · Published by CoinsProbe Markets Desk
The opinions and market insights shared on CoinsProbe represent the views of individual authors based on prevailing market conditions at the time of publication. Cryptocurrency investments carry significant risk and volatility. Readers are encouraged to conduct their own research and seek professional financial advice before making investment decisions. CoinsProbe and its contributors do not accept responsibility for financial losses or decisions made based on published content.
CoinsProbe may publish sponsored articles, affiliate links, or promotional collaborations. All sponsored material is clearly labeled to maintain transparency with our audience. Our editorial decisions remain fully independent, and advertising partnerships do not influence reviews, rankings, or published opinions.
Since 2023, CoinsProbe has delivered reliable insights on cryptocurrency, blockchain, and digital assets. Our content is created by experienced researchers and analysts who follow strict editorial standards focused on accuracy, transparency, and credibility. Every article is carefully reviewed and verified using trusted sources and current market data. We provide unbiased analysis and timely updates covering everything from emerging crypto projects to major industry developments.