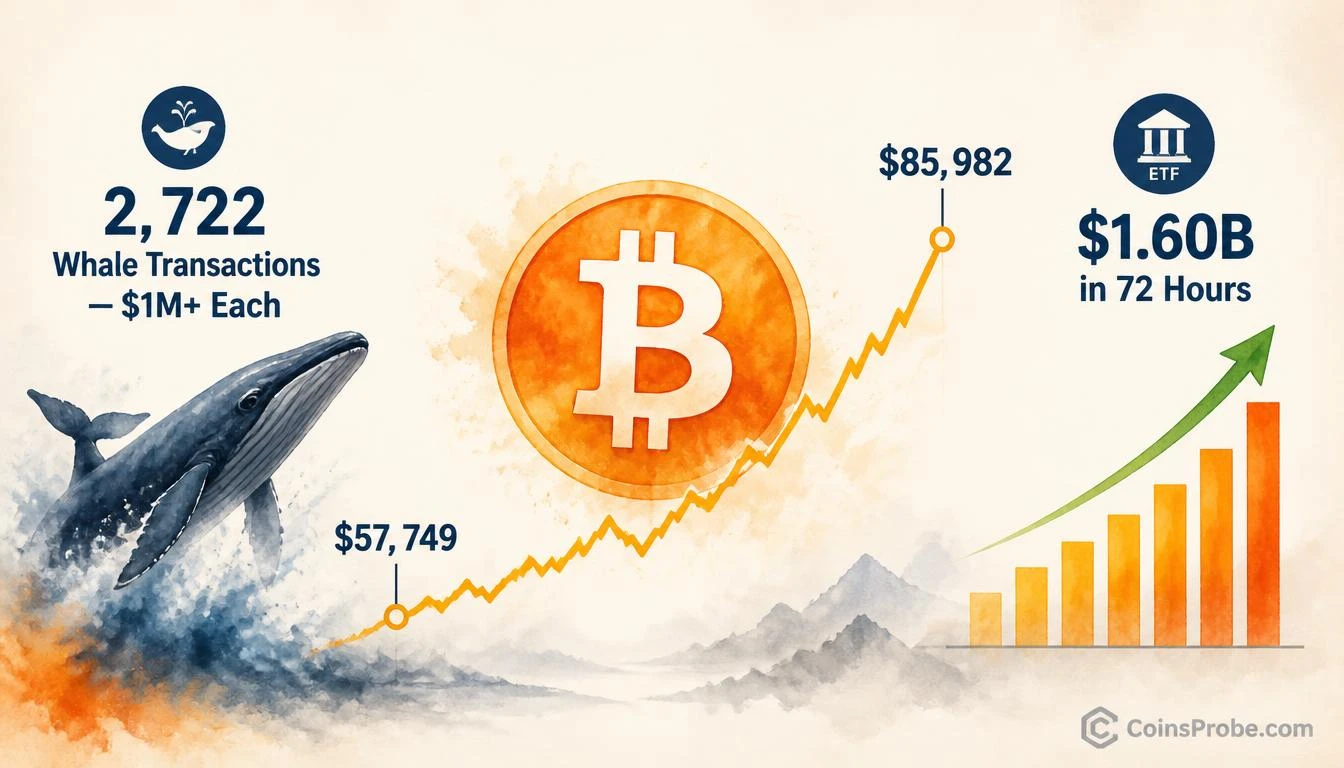
- Bitcoin trades at $85,982 (+1.22%) — up 48.9% from its July 1 cycle low of $57,749 with no distribution signal
- 2,722 on-chain transactions worth $1M+ recorded in a single day — near 3x baseline activity per Santiment via @alicharts
- US spot Bitcoin ETFs added $1.60B worth of BTC in 72 hours — averaging $533M/day in structural buying pressure
- Key support: $80,000 daily close — loss of this level invalidates the institutional accumulation thesis
Bitcoin is trading at approximately $85,982 — up 1.22% in the last 24 hours — with a market capitalization of $1.73 trillion. Despite a 50%-plus rally from its cycle low, the network’s largest participants are not distributing. They are accumulating. That distinction is not semantic — it is the difference between a technically extended rally and one with structural institutional backing.
Crypto analyst Ali Martinez (@alicharts) flagged the on-chain signal in a five-part thread on September 22, 2026: “Even after this sharp move, large investors appear to be stepping in rather than taking profits. Yesterday alone, the $BTC network recorded more than 2,722 transactions, each worth over $1 million.” When combined with $1.60 billion in US spot Bitcoin ETF inflows over 72 hours, the signal presents one of the clearest accumulation-at-highs data points of this cycle.
Signal 1 — 2,722 Whale Transactions in a Single Day
The metric Ali Martinez cites is Bitcoin’s daily count of on-chain transactions valued at $1 million or more, sourced from Santiment. This is not a volume-weighted average or a rolling sum — it is a discrete count of individual network transfers that cleared seven figures in a single 24-hour window.
Why does it matter? Large on-chain transfers of this magnitude represent wallet-to-wallet movement by entities with sufficient capital to move markets: mining pools, OTC desks, institutional custodians, and high-net-worth accumulators. When the count spikes after a major price rally — not before — it signals that these entities are adding exposure at current prices rather than rotating profits off-chain or to exchanges for sale.
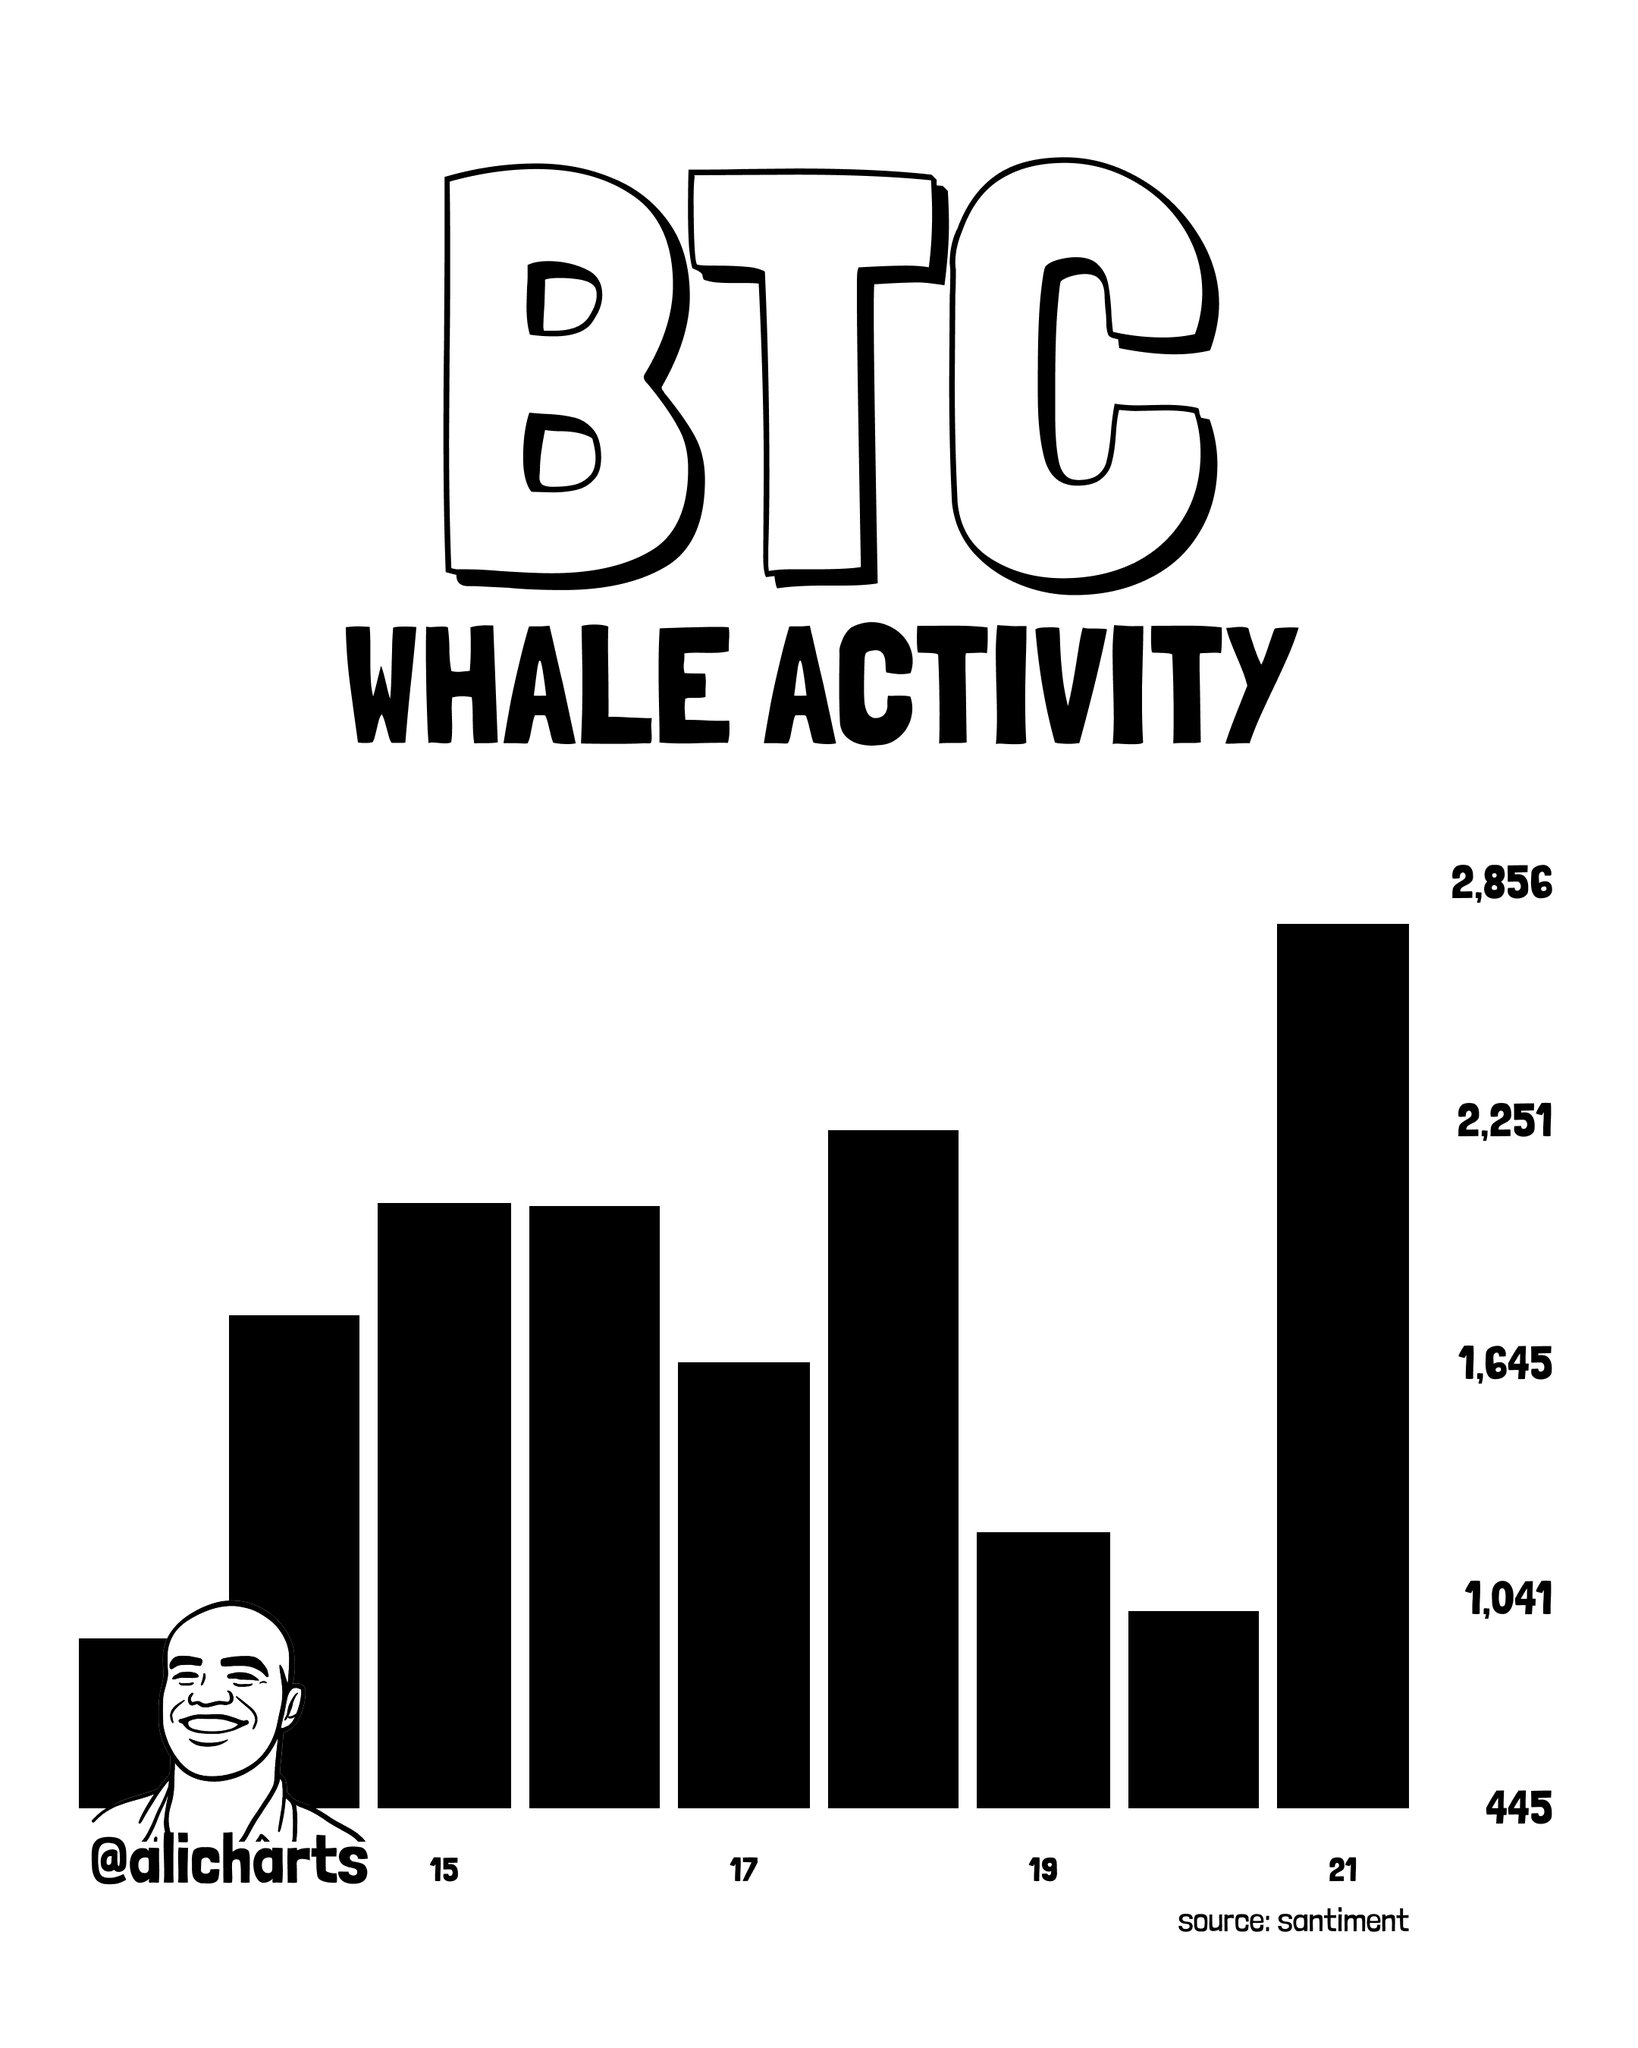
The Santiment data shared by Ali Martinez shows a chart spanning a seven-day window. Whale transaction activity bottomed at approximately 900 transactions on day 15 before recovering to a mid-range of 1,645–2,251 across days 16–18. A sharp dip on days 19–20 (roughly 1,100–1,200) was followed by a V-shaped surge to 2,856 transactions on day 21 — the highest reading on the chart and approximately 3x the starting volume from day 15. The reading of 2,722 cited by Ali Martinez reflects the trailing figure ahead of that final surge, confirming the directional acceleration rather than a one-day outlier.
Ali Martinez’s chart from Santiment shows the whale transaction count accelerating sharply into the session he flagged, reaching a multi-day high of 2,856 — a near-tripling of activity from the baseline seven days prior.
What the data actually means — and what it doesn’t: A spike in $1M+ transactions is not exclusively an accumulation signal. Large transfers between exchange cold wallets, custodial rebalancing, and OTC settlement can all produce elevated counts. What the data does confirm with certainty is that large capital is actively moving on the Bitcoin network — and doing so after a 50% rally, not before it. The absence of corresponding exchange inflow spikes (which would indicate sell-side intent) is what tilts the interpretation toward accumulation. Confirm with exchange netflow data from CryptoQuant or Glassnode before treating this as a standalone trade signal.
Signal 2 — $1.60 Billion in US Spot Bitcoin ETF Inflows Over 72 Hours
Ali Martinez’s thread notes a second concurrent data point: US spot Bitcoin ETFs accumulated more than $1.60 billion worth of BTC over the past 72 hours. This is ETF-level demand — tracked through SoSoValue‘s daily net flow dashboard — arriving simultaneously with elevated whale on-chain activity.
The mechanism matters here. Spot ETF inflows represent net new Bitcoin purchases by authorized participants on behalf of fund shareholders. Unlike futures-based products, spot ETFs require physical BTC acquisition. At $1.60 billion over 72 hours, that averages approximately $533 million per day in structural buying pressure — against a 24-hour network volume of $56.37 billion. ETF demand at this rate represents roughly 0.95% of daily volume in consistent directional pressure, compounding daily.
This is not momentum chasing. Institutional allocators operating through ETF structures do not reverse course on a 24-hour basis. The 72-hour persistence of inflows — across three consecutive trading sessions — indicates a deliberate positioning decision, not a reactive one. For more on how ETF-driven flows have historically preceded extended Bitcoin rallies, see our earlier analysis: Bitcoin’s +6.7% Single-Day Surge: Three-Factor Catalyst Explained.
The Context — 50% Rally From $57,749 With No Distribution Signal
Bitcoin bottomed at $57,749 on July 1, 2026, per Ali Martinez’s data. From that low to the current price of $85,982, Bitcoin has appreciated 48.9% — effectively the 50%-plus rally Martinez cites. In most prior cycles, a move of this magnitude produces one clear on-chain response: distribution. Large holders sell into retail demand, exchange inflows rise, and whale transaction counts shift from accumulation to dispersal.
That is not what the September 22 data shows. The 2,722 million-dollar transaction count arriving after a near-50% rally — without a corresponding exchange inflow spike — represents a structural divergence from the typical post-rally playbook. It suggests that the entities with the most capital invested are treating current prices not as an exit opportunity but as a continuation entry. The Coinbase Premium Gap turning negative at $86K adds nuance to this picture — US institutional buyers were briefly paying less than offshore spot price, a signal worth monitoring as Bitcoin tests this zone.
Bull and Bear Scenarios
Bullish Scenario — Sustained Accumulation Above $85,000
If whale transaction counts remain above 2,000 per day and ETF inflows sustain at $400M+ daily, Bitcoin’s next technical resistance cluster sits near $92,000–$95,000 — the upper boundary of the consolidation range preceding the July 1 low. A confirmed daily close above $95,000 would reopen the all-time high territory and establish new price discovery. Historical precedent from prior post-halving accumulation phases suggests a 30–45% extension from the current level is within structural range when institutional demand persists at this velocity.
Bearish Scenario — Whale Activity Fades, ETF Flows Reverse
The risk scenario is straightforward: if the 2,722 transaction count proves to be a single-day anomaly driven by custodial rebalancing rather than net accumulation, and ETF inflows normalize to the 30-day average (which has been lower than the current 72-hour pace), Bitcoin’s immediate support sits at $80,000 — a round-number psychological level. Loss of $80,000 on a daily close would expose the $74,000–$76,000 demand zone that preceded the July 1 bottom formation. That level would be the true invalidation of the accumulation narrative.
The Accumulation Loop — Summarized
- July 1 low at $57,749 — cycle bottom established
- 50% rally to $85,982 — retail and momentum capital re-enters
- 2,722 whale transactions ($1M+) in one day — large capital adds exposure at current prices
- $1.60B ETF inflows in 72 hours — institutional structural demand reinforces bid
Steps 3 and 4 occurring simultaneously — after step 2, not before — is what makes this setup analytically significant. It is the opposite of distribution.
Bottom Line: Bitcoin has rallied 48.9% from its July 1 low of $57,749 to the current level of $85,982. Rather than triggering distribution, this rally has coincided with 2,722 on-chain transactions worth $1 million or more in a single day — a near-tripling of baseline whale activity per Santiment data — alongside $1.60 billion in US spot Bitcoin ETF inflows over 72 hours. Both signals point in the same direction: large capital is adding exposure at current prices, not exiting. The key level to watch is $80,000 — a daily close below that level would challenge the accumulation thesis. A hold above $85,000 with sustained whale counts above 2,000 per day keeps the path toward $92,000–$95,000 structurally open. Santiment’s daily whale transaction feed and SoSoValue’s ETF flow dashboard will answer that question in real time.
Frequently Asked Questions
What does the 2,722 whale transaction count mean for Bitcoin?
How much have US spot Bitcoin ETFs bought in the past 72 hours?
What level would invalidate Bitcoin’s accumulation narrative?
What is Bitcoin’s next resistance target if accumulation continues?
Source: Ali Charts · Published by CoinsProbe Markets Desk
The opinions and market insights shared on CoinsProbe represent the views of individual authors based on prevailing market conditions at the time of publication. Cryptocurrency investments carry significant risk and volatility. Readers are encouraged to conduct their own research and seek professional financial advice before making investment decisions. CoinsProbe and its contributors do not accept responsibility for financial losses or decisions made based on published content.
CoinsProbe may publish sponsored articles, affiliate links, or promotional collaborations. All sponsored material is clearly labeled to maintain transparency with our audience. Our editorial decisions remain fully independent, and advertising partnerships do not influence reviews, rankings, or published opinions.
Since 2023, CoinsProbe has delivered reliable insights on cryptocurrency, blockchain, and digital assets. Our content is created by experienced researchers and analysts who follow strict editorial standards focused on accuracy, transparency, and credibility. Every article is carefully reviewed and verified using trusted sources and current market data. We provide unbiased analysis and timely updates covering everything from emerging crypto projects to major industry developments.