
- SUI trades at $1.02 (+0.57%) after an 83% bear market drawdown from the $4.40 peak to lows near $0.40
- Parabolic SAR dots flipped below price on the weekly chart — analyst @alicharts declares "SUI bull market has begun"
- Three independent macro signals — TD Sequential, SuperTrend, and Parabolic SAR — all read bullish simultaneously
- $1.40 is the first key resistance; prior highs at $3.80–$4.40 represent the full macro recovery target range
SUI is trading at $1.02 — up 0.57% in the last 24 hours — with a market cap of $4.19 billion. After an 83% bear market that erased the token from roughly $4.40 to a low near $0.40, the weekly chart has just printed the first macro-level bullish structural shift since the downtrend began.
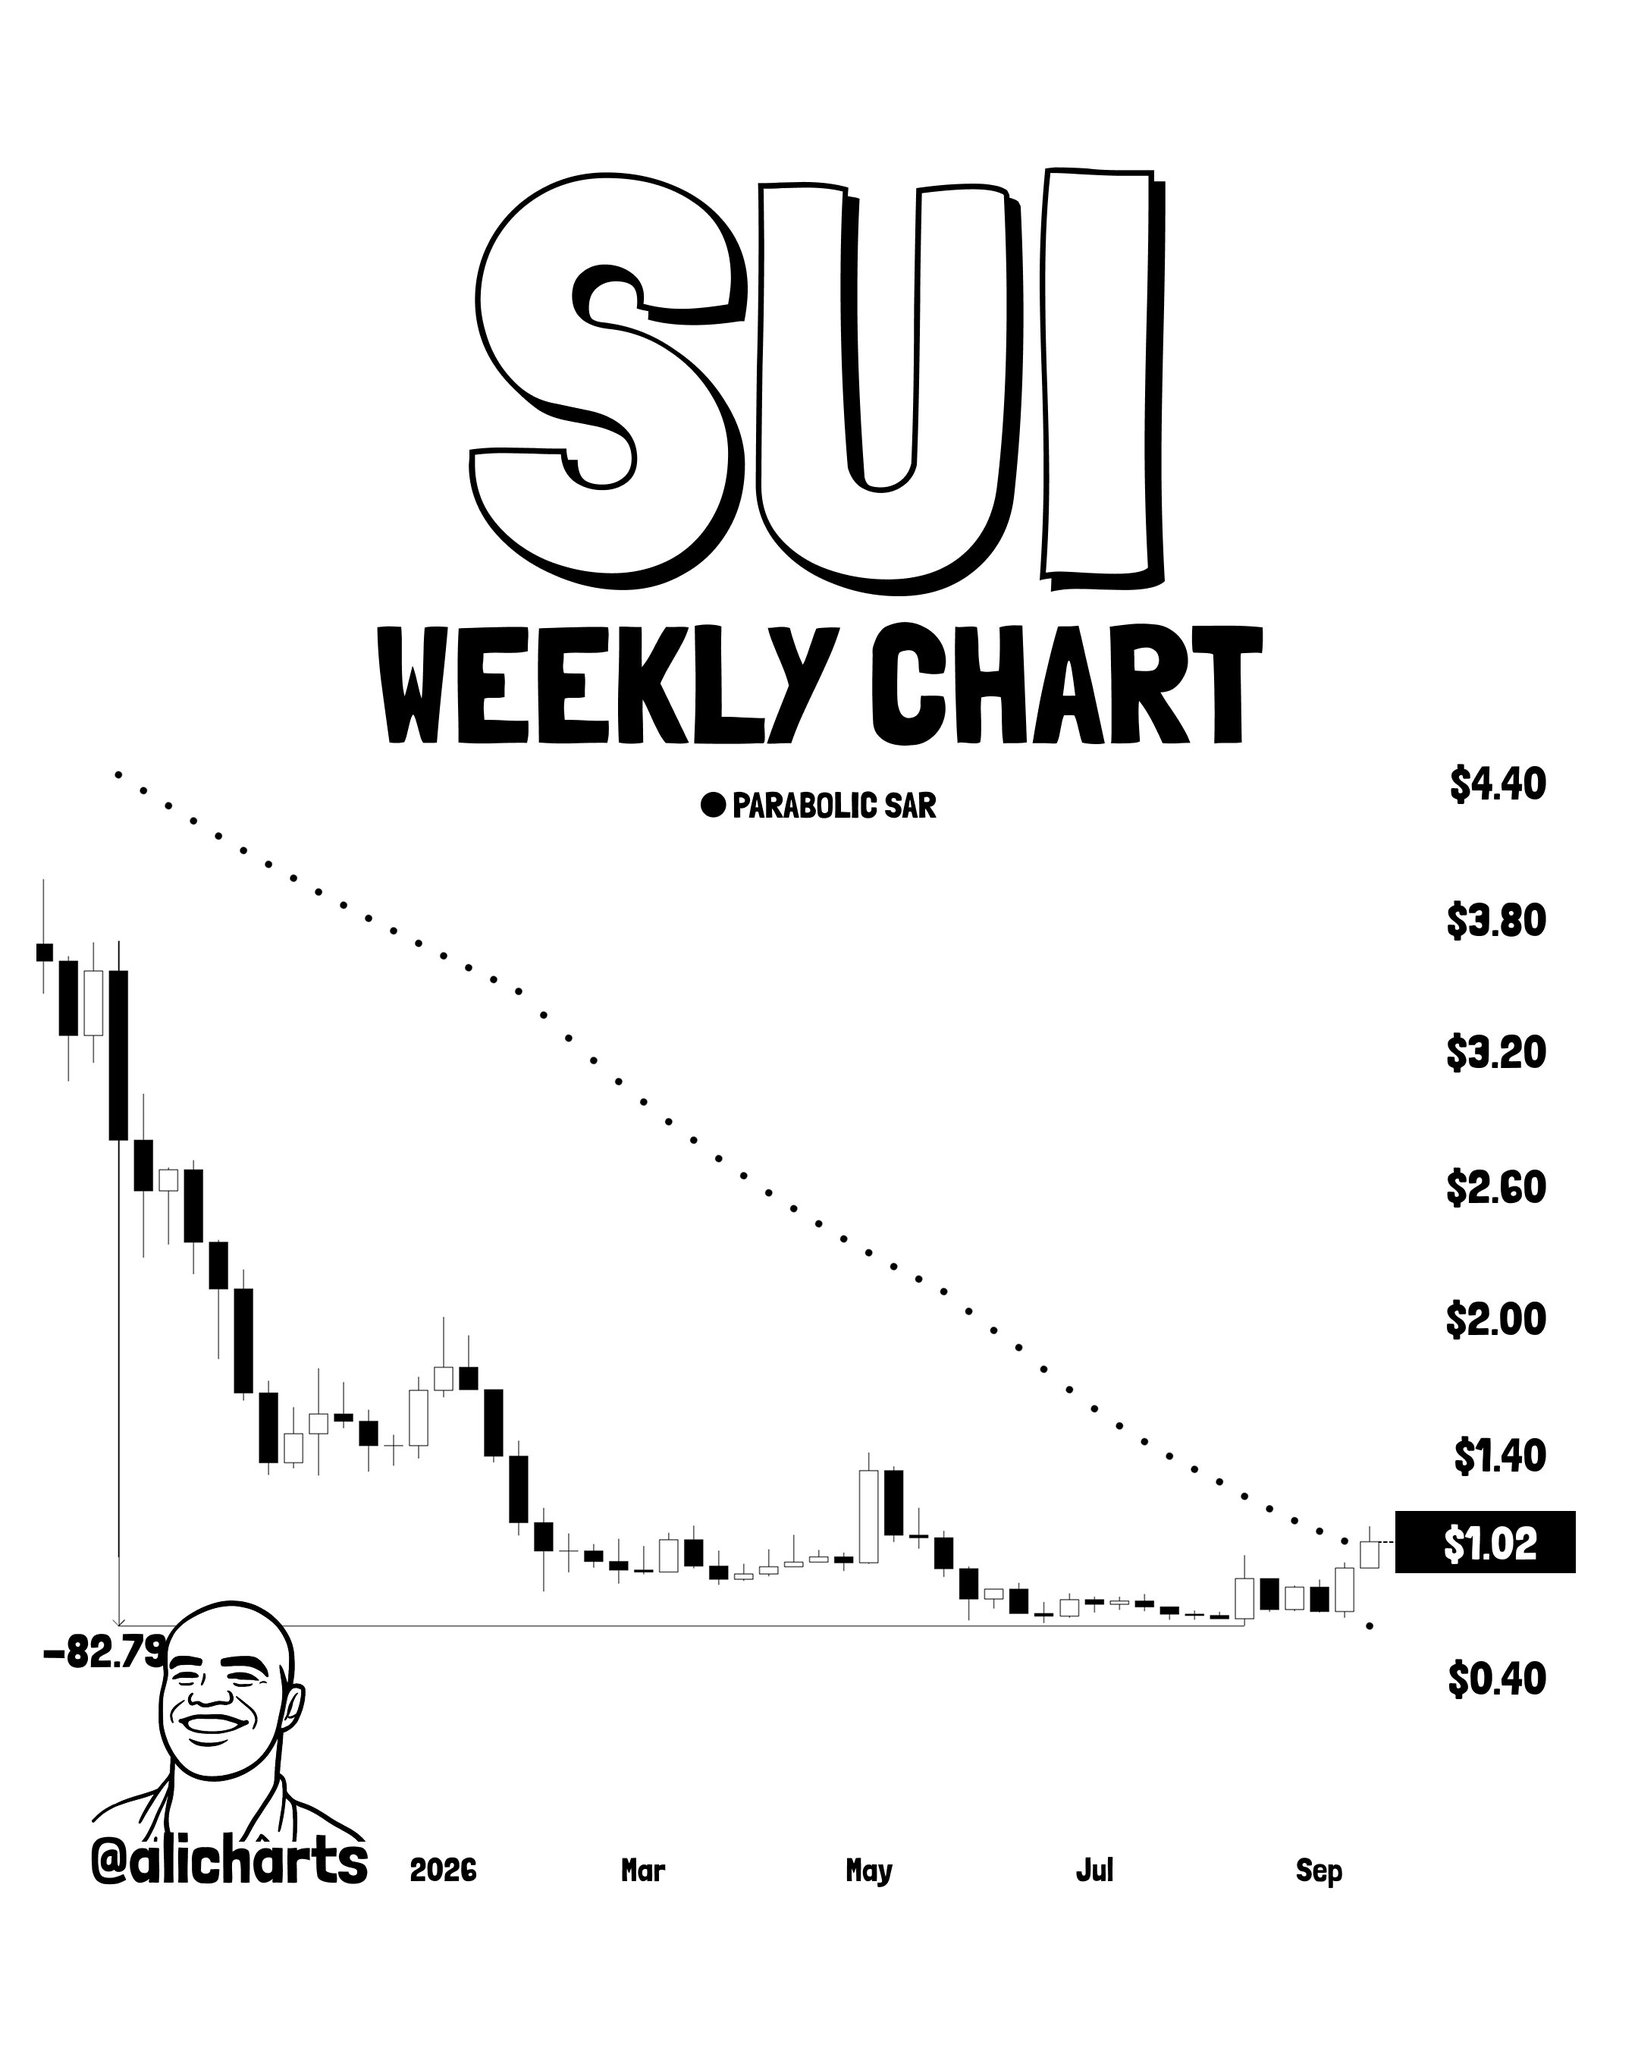
That shift is the Parabolic SAR dot flip below price on the weekly timeframe — which analyst Ali Martinez (@alicharts) identifies as one of SUI’s most important macro signals. His assessment was unambiguous: “SUI BULL MARKET HAS BEGUN. After an 83% bear market, $SUI has just flashed one of its most important macro bullish signals.”
What the Parabolic SAR Actually Measures
The Parabolic SAR — Stop and Reverse — is a trend-following indicator that places dots either above or below price depending on the prevailing direction. When dots sit above price, the indicator reads bearish: it is signaling that momentum is downward and the dots act as a dynamic resistance ceiling. When dots flip below price, the indicator reverses its reading entirely — registering a structural shift from a downtrend to an uptrend.
Critically, this is not a momentum oscillator and not a volume-based signal. The Parabolic SAR measures directional trend regime. A flip on a daily chart carries limited significance. A flip on the weekly chart — which compresses five sessions of price action into a single candle — is a macro-level reading, not a short-term trade signal. It means the dominant trend over the weekly timeframe has officially changed.
For SUI, those dots tracked above price for the entirety of the bear market. Today, for the first time, they have moved below price on the weekly chart.
The Chart: 83% Decline, Then a Structural Flip
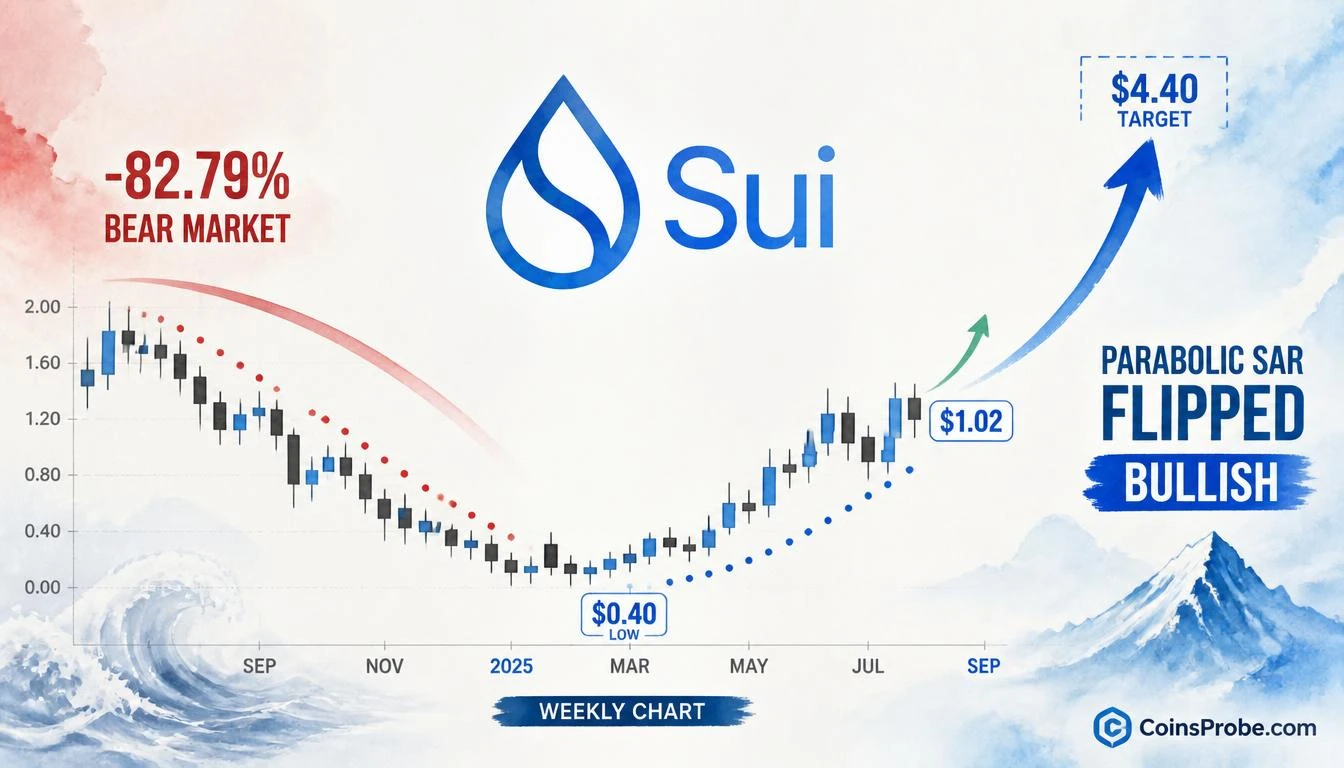
The weekly chart shared by @alicharts maps SUI’s full bear market from peak to the current reading. The decline measured -82.79% from the prior highs near the $3.80–$4.40 range, bottoming in the $0.40–$0.50 zone. Throughout that entire descent — every week of the drawdown — the Parabolic SAR dots remained above price, confirming the downtrend with no interruption.
At the far right of the chart, the configuration inverts. The SAR dots have printed below the current $1.02 price level for the first time. This is the signal Martinez is flagging as the macro trend reversal — not a retest, not a bounce, but the indicator changing its structural reading from bearish to bullish on the highest-conviction timeframe used for trend analysis.
This is the third consecutive macro-level technical signal SUI has generated in recent weeks. The token previously confirmed a TD Sequential ’13’ buy signal that preceded a 45% rally, and separately produced a SuperTrend indicator flip from bearish to bullish — a signal also flagged on the macro timeframe. The Parabolic SAR flip now constitutes a third independent technical indicator registering the same directional shift. Each uses a different calculation methodology. All three are reading the same outcome.
What This Signal Does — and Doesn’t — Confirm
The weekly Parabolic SAR flip confirms a regime change in trend direction. It does not confirm a specific price target, and it does not guarantee the reversal sustains. Single-indicator signals on any timeframe carry the risk of false positives — particularly when price is emerging from a deep drawdown where volatility remains elevated.
What the signal does establish with precision: SUI has transitioned from a confirmed weekly downtrend to a confirmed weekly uptrend by the Parabolic SAR’s measurement criteria. The prior highs at $3.80–$4.40 represent the macro recovery target range if the new uptrend sustains. The previous bear market lows near $0.40–$0.50 represent the structural invalidation zone if the signal fails and price reverts below the SAR dot level.
Volume confirmation and a sustained close above near-term resistance would strengthen the signal materially. The earlier SAR flip analysis targeting $1.40 as the first key resistance level remains relevant — that level is approximately 37% above the current $1.02 price and represents the first meaningful test of whether bulls can extend the new uptrend structure.
Bullish and Bearish Scenarios
Bullish Scenario
SUI holds above the weekly Parabolic SAR dot level and builds on the current $1.02 base. The first target is the $1.40 resistance zone — approximately 37% above current price. A sustained break above $1.40 with volume confirmation opens the path toward the $3.80–$4.40 prior high range, representing a potential 272%–331% recovery from the current level if the full prior bull cycle is retraced. The three-signal confluence — TD Sequential, SuperTrend, and now Parabolic SAR — all reading bullish simultaneously increases the structural weight of the case.
Bearish Scenario
A weekly close back above the Parabolic SAR dots — meaning the dots revert to printing above price — invalidates the macro flip signal. That would likely require a sustained move back toward the $0.80–$0.85 range, which would negate the trend reversal reading and reassert the prior downtrend structure. Loss of the $0.40–$0.50 bear market low would be a full structural failure of the recovery thesis.
The Convergence Case
Three independent macro technical indicators — TD Sequential, SuperTrend, and Parabolic SAR — have each, separately, flipped to bullish readings on SUI within the same recovery window. The TD Sequential identified momentum exhaustion after nine consecutive bearish closes. The SuperTrend indicator changed its directional bias. The Parabolic SAR has now changed its trend regime classification. None of these indicators share a calculation basis. All three are registering the same structural conclusion on the weekly chart.
That convergence does not make a move to prior highs certain. It does mean the weight of weekly technical evidence has shifted — after an 83% drawdown — from bearish to bullish. The SAR dots now sit below price. Whether they remain there on the next weekly close is the only data point that matters in the immediate term. The $1.40 resistance level is the first test. Watch the weekly close at $1.40 as the line between trend continuation and stall.
Frequently Asked Questions
What does a Parabolic SAR flip below price mean for SUI on the weekly chart?
What is the first key resistance level SUI must break to confirm the new uptrend?
What would invalidate the Parabolic SAR bull signal on SUI?
Why does the weekly Parabolic SAR signal carry more weight than a daily signal?
Source: Ali Charts · Published by CoinsProbe Markets Desk
The opinions and market insights shared on CoinsProbe represent the views of individual authors based on prevailing market conditions at the time of publication. Cryptocurrency investments carry significant risk and volatility. Readers are encouraged to conduct their own research and seek professional financial advice before making investment decisions. CoinsProbe and its contributors do not accept responsibility for financial losses or decisions made based on published content.
CoinsProbe may publish sponsored articles, affiliate links, or promotional collaborations. All sponsored material is clearly labeled to maintain transparency with our audience. Our editorial decisions remain fully independent, and advertising partnerships do not influence reviews, rankings, or published opinions.
Since 2023, CoinsProbe has delivered reliable insights on cryptocurrency, blockchain, and digital assets. Our content is created by experienced researchers and analysts who follow strict editorial standards focused on accuracy, transparency, and credibility. Every article is carefully reviewed and verified using trusted sources and current market data. We provide unbiased analysis and timely updates covering everything from emerging crypto projects to major industry developments.