
- SUI surges 22.15% to $1.005, breaking above the $0.98 Parabolic SAR trigger level flagged by analyst Ali Martinez (@alicharts)
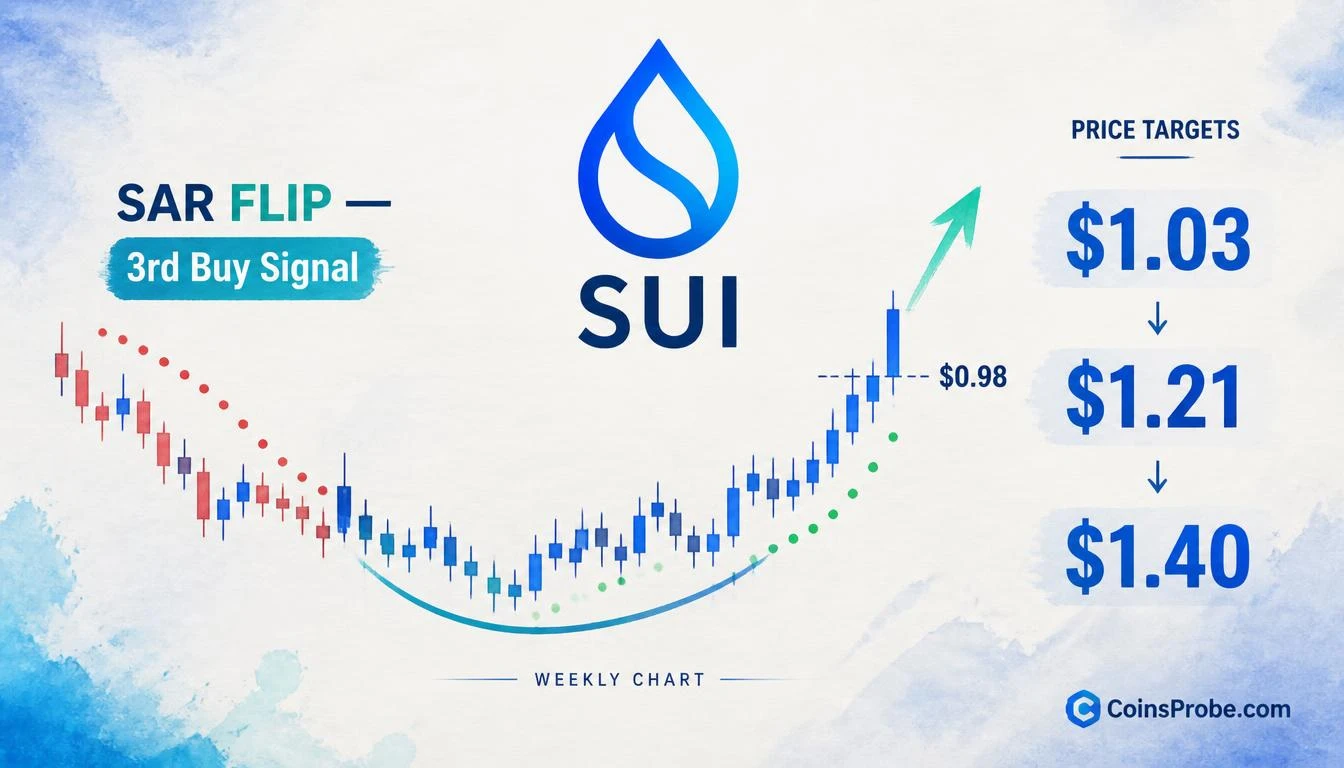
- Weekly SAR dots flip below price — third buy signal confirmed in a multi-signal sequence, with upside targets at $1.03, $1.21, and $1.40
- Invalidation: A weekly close back below $0.98 would mechanically re-flip SAR dots above price, canceling the signal
- $4.12B market cap / $1.79B 24h volume confirms breakout is backed by significant liquidity
SUI is trading at $1.005 — up 22.15% in 24 hours — with a market cap of $4.12 billion and $1.79 billion in daily volume. The move is not noise. It has triggered a specific, conditional technical signal that crypto analyst Ali Martinez had flagged as the threshold separating a continued downtrend from a confirmed reversal.
That threshold was $0.98. SUI has broken above it. The signal in question is a Parabolic SAR crossover — which Ali Martinez (@alicharts) identified as a potential “third buy signal” in a multi-part analysis thread. His exact words: “If SUI rises above $0.98, the SAR dot would move below price, confirming an uptrend and potentially acting as dynamic support.” That condition has now been met.
What the Parabolic SAR Actually Measures
Before citing the reading, the mechanism deserves clarity. The Parabolic SAR (Stop and Reverse) is a trend-following indicator that places dots above or below price on a chart. When the dots sit above price, the indicator defines the trend as bearish — the dots function as a ceiling of resistance and a trailing stop for short positions. When the dots shift below price, the trend definition inverts: the indicator reads bullish, and the SAR dots then serve as dynamic trailing support, rising with price as the uptrend develops.
The critical feature of the SAR is that the crossover is binary and mechanical — it cannot be partially triggered. Either the dots are above price (bearish regime) or below (bullish regime). There is no ambiguity in the reading. This is precisely why Ali Martinez cited $0.98 as a hard line: it was the precise level at which the weekly Parabolic SAR dots would have flipped from above to below, mechanically confirming a trend reversal on the weekly timeframe.
Signal 3 — Parabolic SAR Crossover Above $0.98
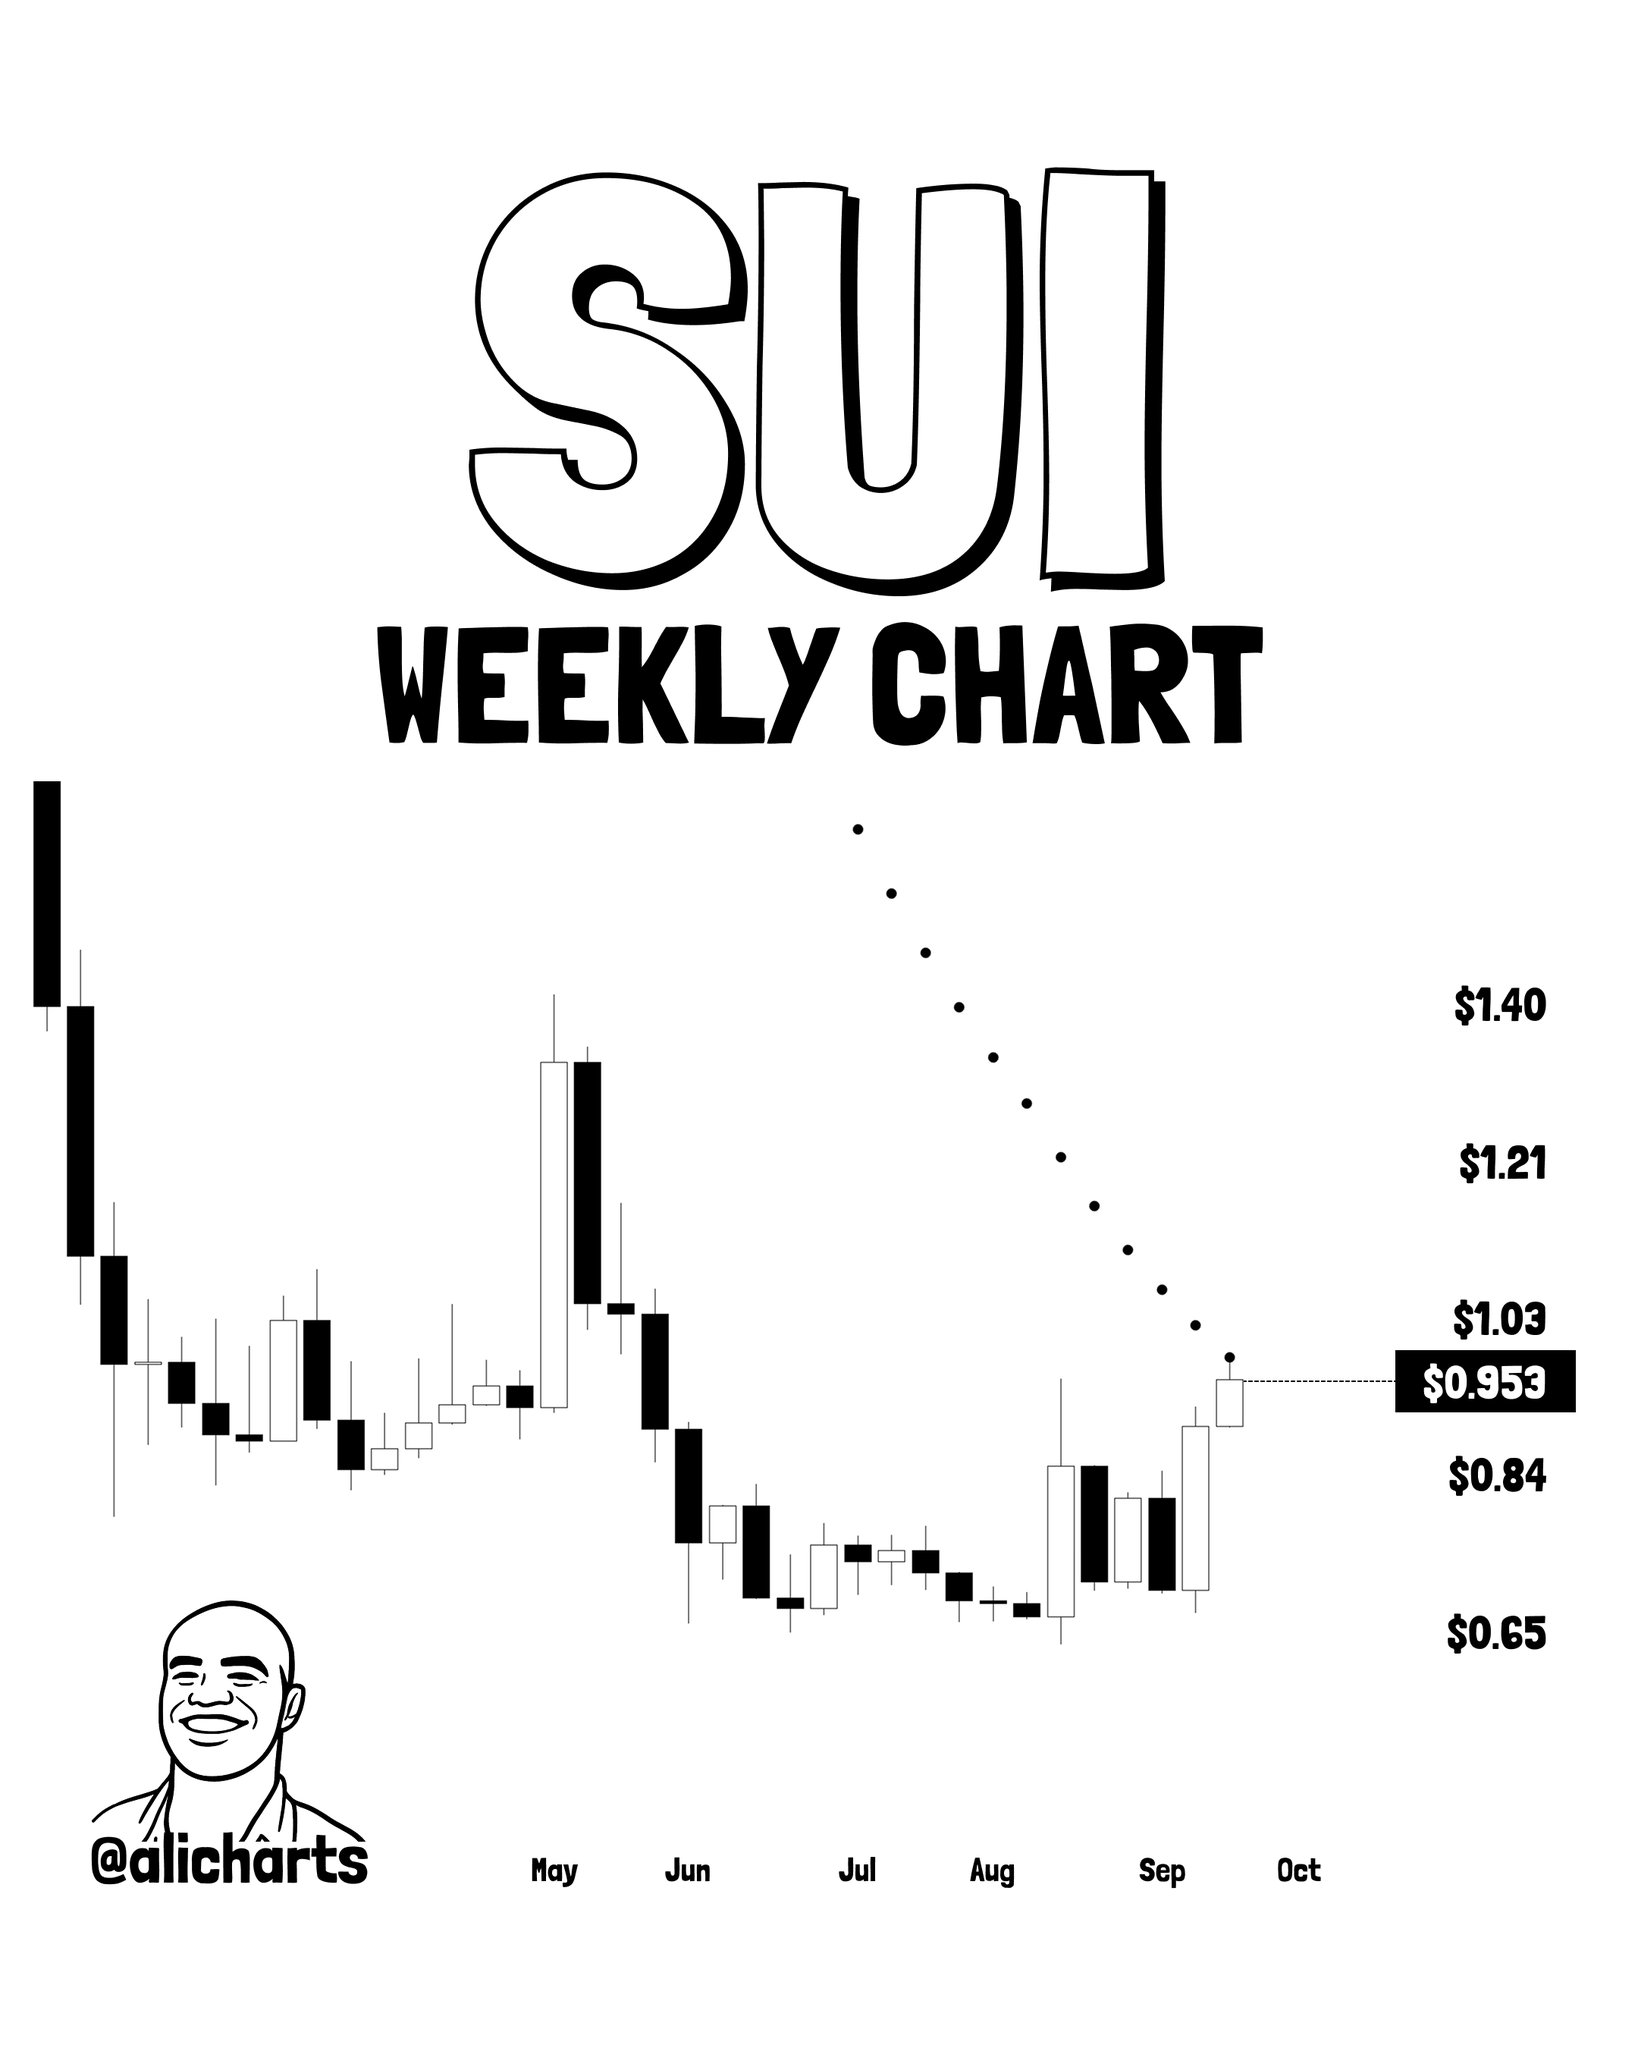
The weekly chart shared by Ali Martinez (@alicharts) showed SUI forming a rounded bottom accumulation structure between June and August 2024, followed by a recovery toward the $0.98 threshold. The Parabolic SAR dots were displayed in a downward arc above price throughout the decline — a bearish configuration that had remained intact since SUI’s prior highs. The projected SAR flip, shown as a dotted arc in the chart, indicated the exact week the crossover would trigger if price sustained above $0.98.
SUI has now closed above that level. At $1.005, the SAR dots have mechanically migrated below price on the weekly chart. The third buy signal is confirmed — not pending, not conditional. The SAR now functions as dynamic trailing support, defining the floor of the developing uptrend.
Upside Targets — $1.03, $1.21, and $1.40
Ali Martinez’s chart identifies three cascading resistance targets following the SAR confirmation:
| Target Level | % From $0.98 Trigger | % From Current $1.005 |
|---|---|---|
| $1.03 | +5.1% | +2.5% |
| $1.21 | +23.5% | +20.4% |
| $1.40 | +42.9% | +39.3% |
Source: @alicharts (X) — weekly SUI chart targets
The $1.03 level represents the nearest structural resistance — a level that must be absorbed for the SAR-defined uptrend to gain momentum. Beyond that, $1.21 and $1.40 represent the medium and upper targets from the chart structure. These are not arbitrary round numbers — they are the resistance zones visible in SUI’s weekly price history from prior consolidation periods and the parallel channel structure detailed in the SUI weekly parallel channel analysis published previously.
Context — This Is the Third Signal in a Multi-Signal Sequence
Ali Martinez framed this as a “4/6” post — the fourth entry in a six-part analytical thread — indicating this SAR signal is the third buy signal, not the first. The prior two signals in the sequence preceded today’s move, building the technical foundation. This matters structurally: a third confirming signal in the same directional thesis on the weekly timeframe represents convergence, not a standalone indicator reading.
As detailed in the earlier SUI three-signal alignment analysis, $0.98 was already identified as the critical confirmation level across multiple indicators simultaneously. The Parabolic SAR crossover now provides the third independent confirmation that $0.98 has transitioned from resistance to a validated breakout point.
The One Risk — What Invalidates the Signal
The Parabolic SAR is not a static level — it is dynamic. If SUI fails to hold the SAR dots as support and price closes back below them on a weekly basis, the dots would mechanically return above price, re-establishing the bearish regime. The precise invalidation level shifts weekly as the SAR recalculates, but given the current position, a weekly close back below $0.98 would be the clearest structural warning that the crossover was a false breakout rather than a genuine trend reversal.
The secondary support zone identified on the weekly chart sits between $0.84 and $0.65 — the range that defined the prior accumulation structure. A breakdown below $0.84 would suggest the rounded bottom pattern has failed entirely.
Bullish Scenario — SAR Holds as Support
SUI consolidates above $0.98 with the weekly SAR dots confirmed below price → $1.03 absorbed as first resistance → rally extends to $1.21 → upper target of $1.40 comes into scope. This is the measured-move projection from the rounded bottom formation. A weekly close above $1.03 with SAR dots rising beneath price would be the first confirming weekly candle in the new trend regime.
Bearish Scenario — False Breakout Below $0.98
A weekly close back below $0.98 would mechanically re-flip the SAR dots to above price, invalidating the third buy signal. Price would then likely test the $0.84 support zone. A sustained break below $0.84 opens the $0.65 level — the lower boundary of the accumulation range. This scenario would mean the breakout was volume-driven but not structurally sustained.
Bottom Line
SUI’s 22.15% surge to $1.005 has done exactly what Ali Martinez’s analysis required: it pushed price above $0.98, mechanically triggering the weekly Parabolic SAR crossover from bearish to bullish. The SAR dots have shifted below price — this is the third buy signal in a multi-signal sequence, and it is now confirmed. The three upside targets from the chart structure are $1.03, $1.21, and $1.40, cascading in that order. The single invalidation threshold is a weekly close back below $0.98 — which would mechanically reverse the SAR signal and restore the bearish regime. The weekly close this session is the number that defines whether today’s breakout is structural or a one-candle event. Watch $0.98 as the line that separates confirmed trend reversal from failed breakout.
Source: x.com
Frequently Asked Questions
What is the Parabolic SAR signal on SUI and why does $0.98 matter?
What are the price targets for SUI after the SAR breakout?
What would invalidate SUI’s Parabolic SAR buy signal?
Is the SUI Parabolic SAR signal the only buy signal, or are there others?
Source: Ali Charts · Published by CoinsProbe Markets Desk
The opinions and market insights shared on CoinsProbe represent the views of individual authors based on prevailing market conditions at the time of publication. Cryptocurrency investments carry significant risk and volatility. Readers are encouraged to conduct their own research and seek professional financial advice before making investment decisions. CoinsProbe and its contributors do not accept responsibility for financial losses or decisions made based on published content.
CoinsProbe may publish sponsored articles, affiliate links, or promotional collaborations. All sponsored material is clearly labeled to maintain transparency with our audience. Our editorial decisions remain fully independent, and advertising partnerships do not influence reviews, rankings, or published opinions.
Since 2023, CoinsProbe has delivered reliable insights on cryptocurrency, blockchain, and digital assets. Our content is created by experienced researchers and analysts who follow strict editorial standards focused on accuracy, transparency, and credibility. Every article is carefully reviewed and verified using trusted sources and current market data. We provide unbiased analysis and timely updates covering everything from emerging crypto projects to major industry developments.