- AAVE holds $91–$120 Fibonacci buy zone as Bitcoin falls to a new yearly low of $60,725
- Analyst flags Wave (2) correction landing inside 0.382–0.618 retracement with RSI bear divergence already played out
- AAVE backed by $18B TVL and $1M+ daily protocol fees per DeFiLlama
- $109 (0.618 Fib) is the invalidation level; close above $120 signals Wave (3) start
AAVE is holding a critical technical zone that one analyst first flagged six weeks ago — and the signal is getting sharper, not weaker. Bitcoin dropped to a new yearly low of $60,725 on November 22, 2026, yet AAVE has refused to follow it lower, sitting at approximately $120 at time of writing — the upper boundary of a Fibonacci buy zone that remains structurally intact.
A crypto analyst posting under @CryptoBullet1 on X flagged this divergence directly: “$BTC made a new yearly low and $AAVE is still within my Buy the Dip zone. Something’s changing, slowly but surely.” The buy zone — first published on October 16, 2026 — spans $91 to $120, anchored between the 0.382 and 0.618 Fibonacci retracement levels of AAVE’s prior impulse move. That zone has held through Bitcoin’s worst weekly performance of the year.
The Buy Zone — What It Is and Why It Matters
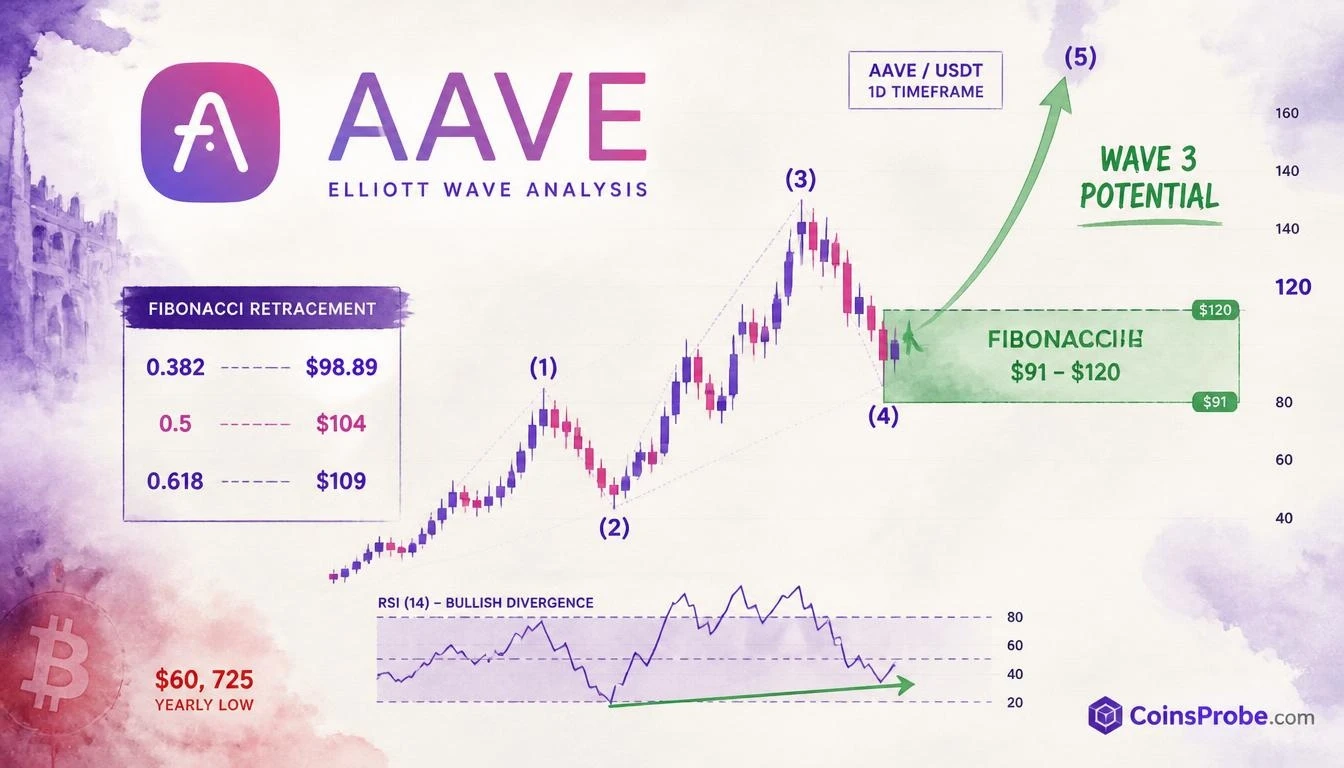
The AAVE/USDT daily chart shared by the analyst shows a completed five-wave Elliott impulse to the upside, followed by an ABC corrective structure that pulled price back into a highlighted Fibonacci zone. The 0.382 retracement sits near $98.89, the 0.5 level near $104, and the 0.618 near $109 — all of which are explicitly printed on the chart. Price is currently sitting at the $120 upper boundary, within the buy zone, with no confirmed breakout above resistance yet.
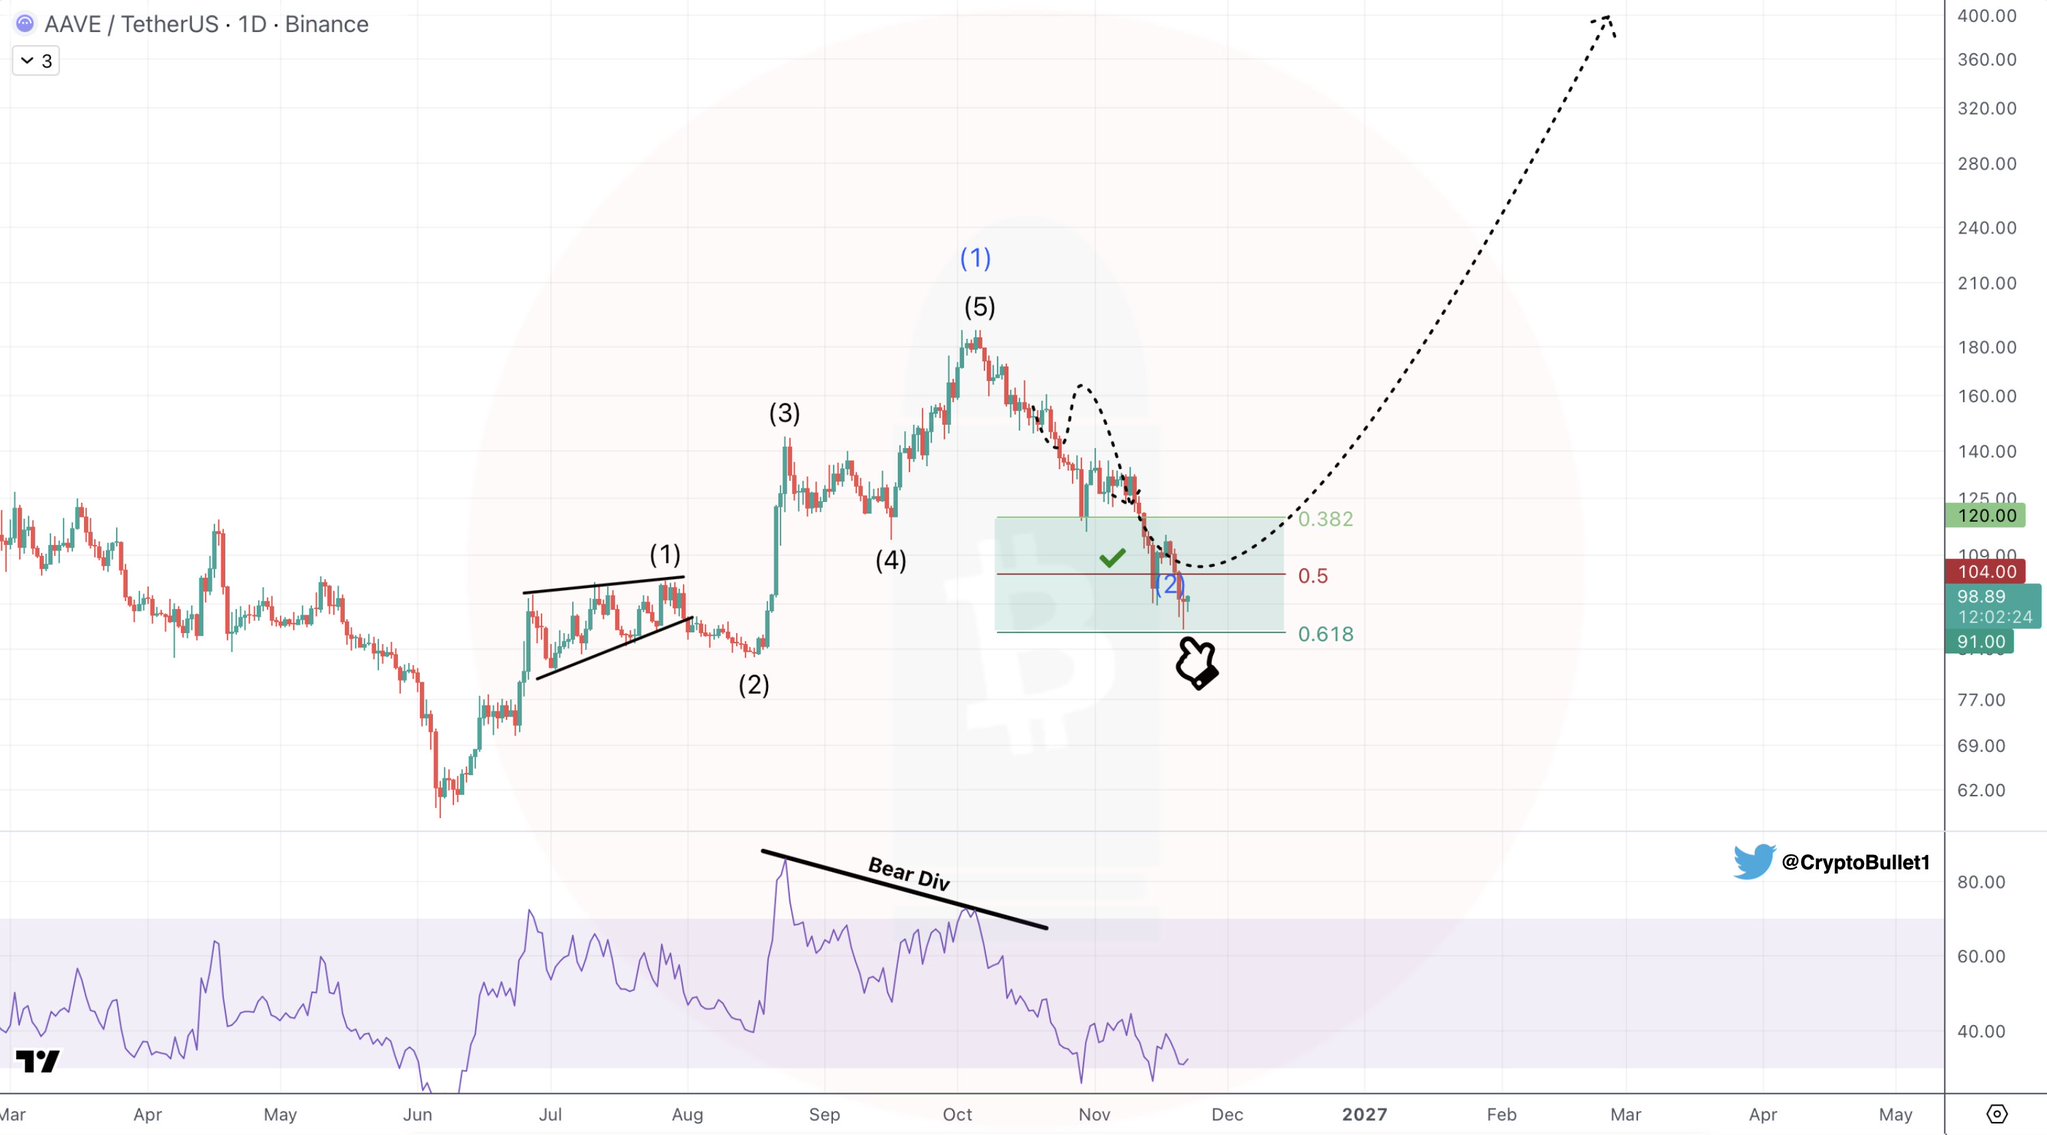
Critically, the analyst also notes RSI bear divergence has already played out on the daily timeframe — a descending trendline over RSI peaks while price made higher highs. That divergence typically precedes a corrective low. With Wave (2) appearing to complete inside the Fibonacci zone, the setup the analyst is tracking is the beginning of Wave (3) — historically the longest and most powerful wave in an Elliott impulse sequence. The pattern is still forming; there is no confirmed breakout above resistance at this stage.
The Fundamental Backstop — $18B TVL and $1M+ Daily Fees
What makes this technical setup meaningful rather than arbitrary is the on-chain data underneath it. The analyst’s original October 16 post cited AAVE’s $18 billion in total value locked (TVL) and over $1 million in daily protocol fees as the fundamental case for buying the dip. Those figures, sourced from DeFiLlama, represent AAVE’s position as the dominant decentralized lending protocol — not speculative flow but actual deployed capital generating real revenue.
At $1M+ in daily fees, AAVE is running at a revenue rate that few DeFi protocols can match. TVL at $18 billion means the protocol is not a thin-liquidity instrument — it is load-bearing infrastructure for DeFi’s lending layer. When Bitcoin falls to yearly lows and AAVE holds a Fibonacci support zone anchored to those fundamentals, that is not coincidence. It is the market distinguishing between speculative assets and productive ones.
Bitcoin’s Yearly Low — Context, Not Contradiction
Bitcoin at $60,725 — down from its cycle highs — is a macro headwind that cannot be dismissed. Spot BTC ETFs recorded a net outflow of $582.2 million on November 19, 2026, per data via SoSoValue, with IBIT alone seeing $541.1 million leave in a single session. The past four trading days have produced a net $1.12 billion in outflows, with three consecutive days of net selling. This is institutional de-risking, not retail noise.
Compounding the macro picture, markets are pricing an 88.6% probability of a Fed rate hike to 4.00%–4.25% at the December 9, 2026 FOMC meeting, per SoSoValue data. A tightening path — particularly one being priced in with this degree of conviction — is a structural headwind for risk assets broadly. Core PCE and GDP data dropping on November 24 will either reinforce or complicate that pricing. For context on where Bitcoin’s technical structure stands amid these pressures, the Bitcoin TD Sequential Buy Signal analysis at $61,000 and the Bitcoin 200-Week MA breakdown with CVDD at $50.8K are relevant reads.
Strategy (formerly MicroStrategy) continued accumulating despite the drawdown — adding 485 BTC for $33.4 million as recently as November 16, bringing total holdings to 850,849 BTC. That is a conviction signal from the largest corporate BTC holder, but it has not been enough to arrest ETF outflows.
Against all of that, AAVE holding $120 is a data point worth taking seriously. It is the analyst’s thesis in a single price: something is changing, slowly but surely.
The Levels That Decide the Outcome
The buy zone boundaries are specific. The 0.618 Fibonacci retracement — the deepest level the analyst considers within the buy zone — sits near $109 on the chart. A daily close below $109 would put price outside the corrective structure the analyst has mapped and would call the Wave (2) low thesis into question. The 0.5 level at $104 is the midpoint reference. The 0.382 at $98.89 sits near the lower boundary of the highlighted zone.
To the upside, $120 is the current price and the upper boundary of the buy zone. A sustained move and close above $120 would be the first signal that Wave (3) is beginning. The analyst has not stated a specific Wave (3) price target in this post — that projection remains open. What is stated is the entry zone: $91 to $120, with price currently at the top of it.
The analyst also flagged PUMP as holding the same buy zone structure simultaneously. Two assets maintaining Fibonacci support while Bitcoin prints a yearly low is a pattern — not a coincidence.
AAVE’s $18B TVL and $1M+ daily fee revenue provide the fundamental floor. The Fibonacci zone provides the technical one. Bitcoin’s macro pressure and aggressive ETF outflows provide the headwind. Watch $109 — a daily close below that level invalidates the corrective low thesis and opens the lower end of the zone near $91. Watch $120 — a sustained close above it is the first confirmation that the analyst’s “something is changing” observation has become a trend.
Frequently Asked Questions
What is AAVE’s buy zone and where are its exact Fibonacci levels?
Why is AAVE holding up while Bitcoin hits a yearly low?
What would invalidate the AAVE buy zone thesis?
What does the FOMC rate outlook mean for AAVE and DeFi assets?
Source: Cryptobullet1 · Published by CoinsProbe Markets Desk
The opinions and market insights shared on CoinsProbe represent the views of individual authors based on prevailing market conditions at the time of publication. Cryptocurrency investments carry significant risk and volatility. Readers are encouraged to conduct their own research and seek professional financial advice before making investment decisions. CoinsProbe and its contributors do not accept responsibility for financial losses or decisions made based on published content.
CoinsProbe may publish sponsored articles, affiliate links, or promotional collaborations. All sponsored material is clearly labeled to maintain transparency with our audience. Our editorial decisions remain fully independent, and advertising partnerships do not influence reviews, rankings, or published opinions.
Since 2023, CoinsProbe has delivered reliable insights on cryptocurrency, blockchain, and digital assets. Our content is created by experienced researchers and analysts who follow strict editorial standards focused on accuracy, transparency, and credibility. Every article is carefully reviewed and verified using trusted sources and current market data. We provide unbiased analysis and timely updates covering everything from emerging crypto projects to major industry developments.