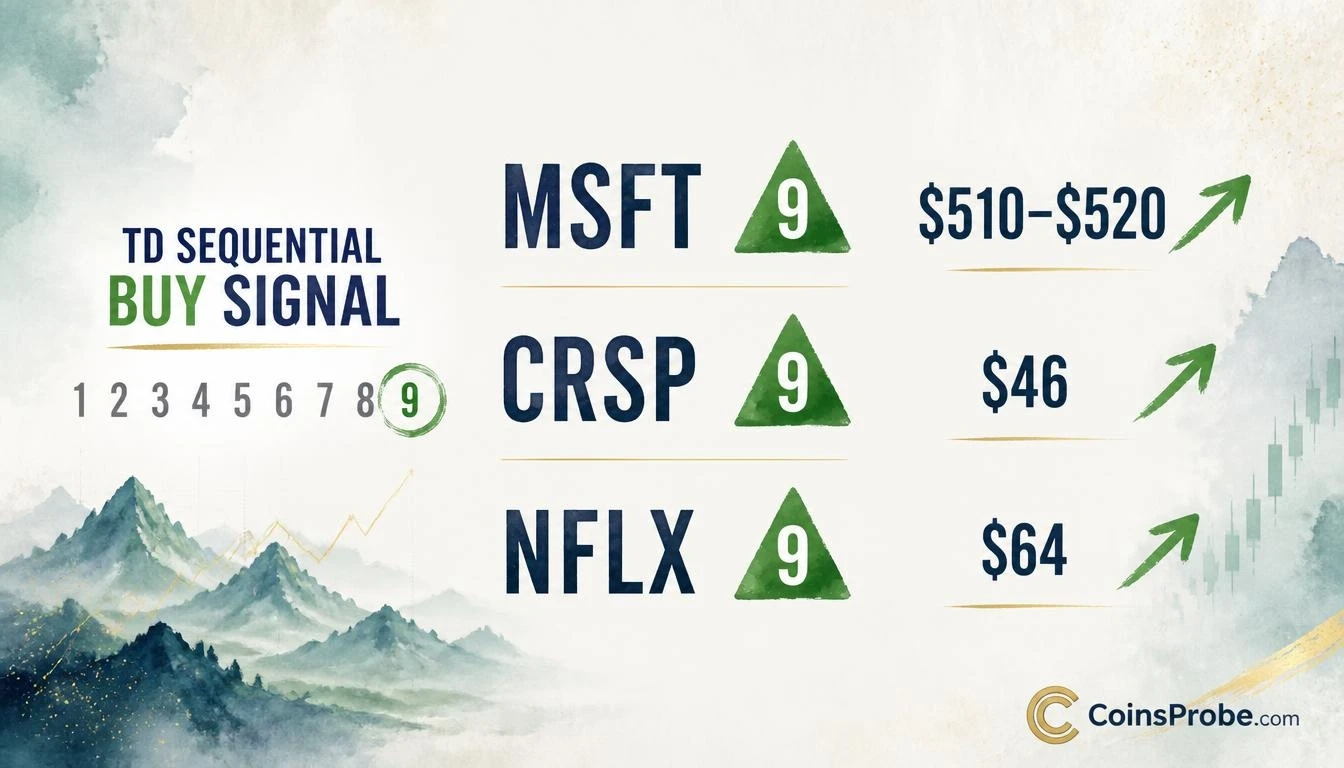
- MSFT, CRSP, and NFLX simultaneously print TD Sequential '9' buy signals on daily charts as market hits oversold levels
- Prior TD Sequential signals produced −7.47% (MSFT sell), +13.81% (CRSP buy), and +9.72% (NFLX buy) moves per @alicharts
- Watch $480 (MSFT), $36 (CRSP), and $56 (NFLX) — loss of any support invalidates the respective setup
Three major U.S. equities — Microsoft (MSFT), CRISPR Therapeutics (CRSP), and Netflix (NFLX) — have simultaneously printed TD Sequential “9” buy signals on their daily charts as broader market conditions reach oversold territory. The signal is not a guarantee of reversal, but its track record across all three names makes the setup worth tracking with discipline.
An analyst who goes by the handle @alicharts flagged all three in a five-part thread published November 22, 2026, noting that each prior instance of the same signal produced a measurable bounce — and that price confirmation at specific support levels is required before the thesis is active.
Signal 1 — Microsoft (MSFT): $480 Support, $510–$520 Target
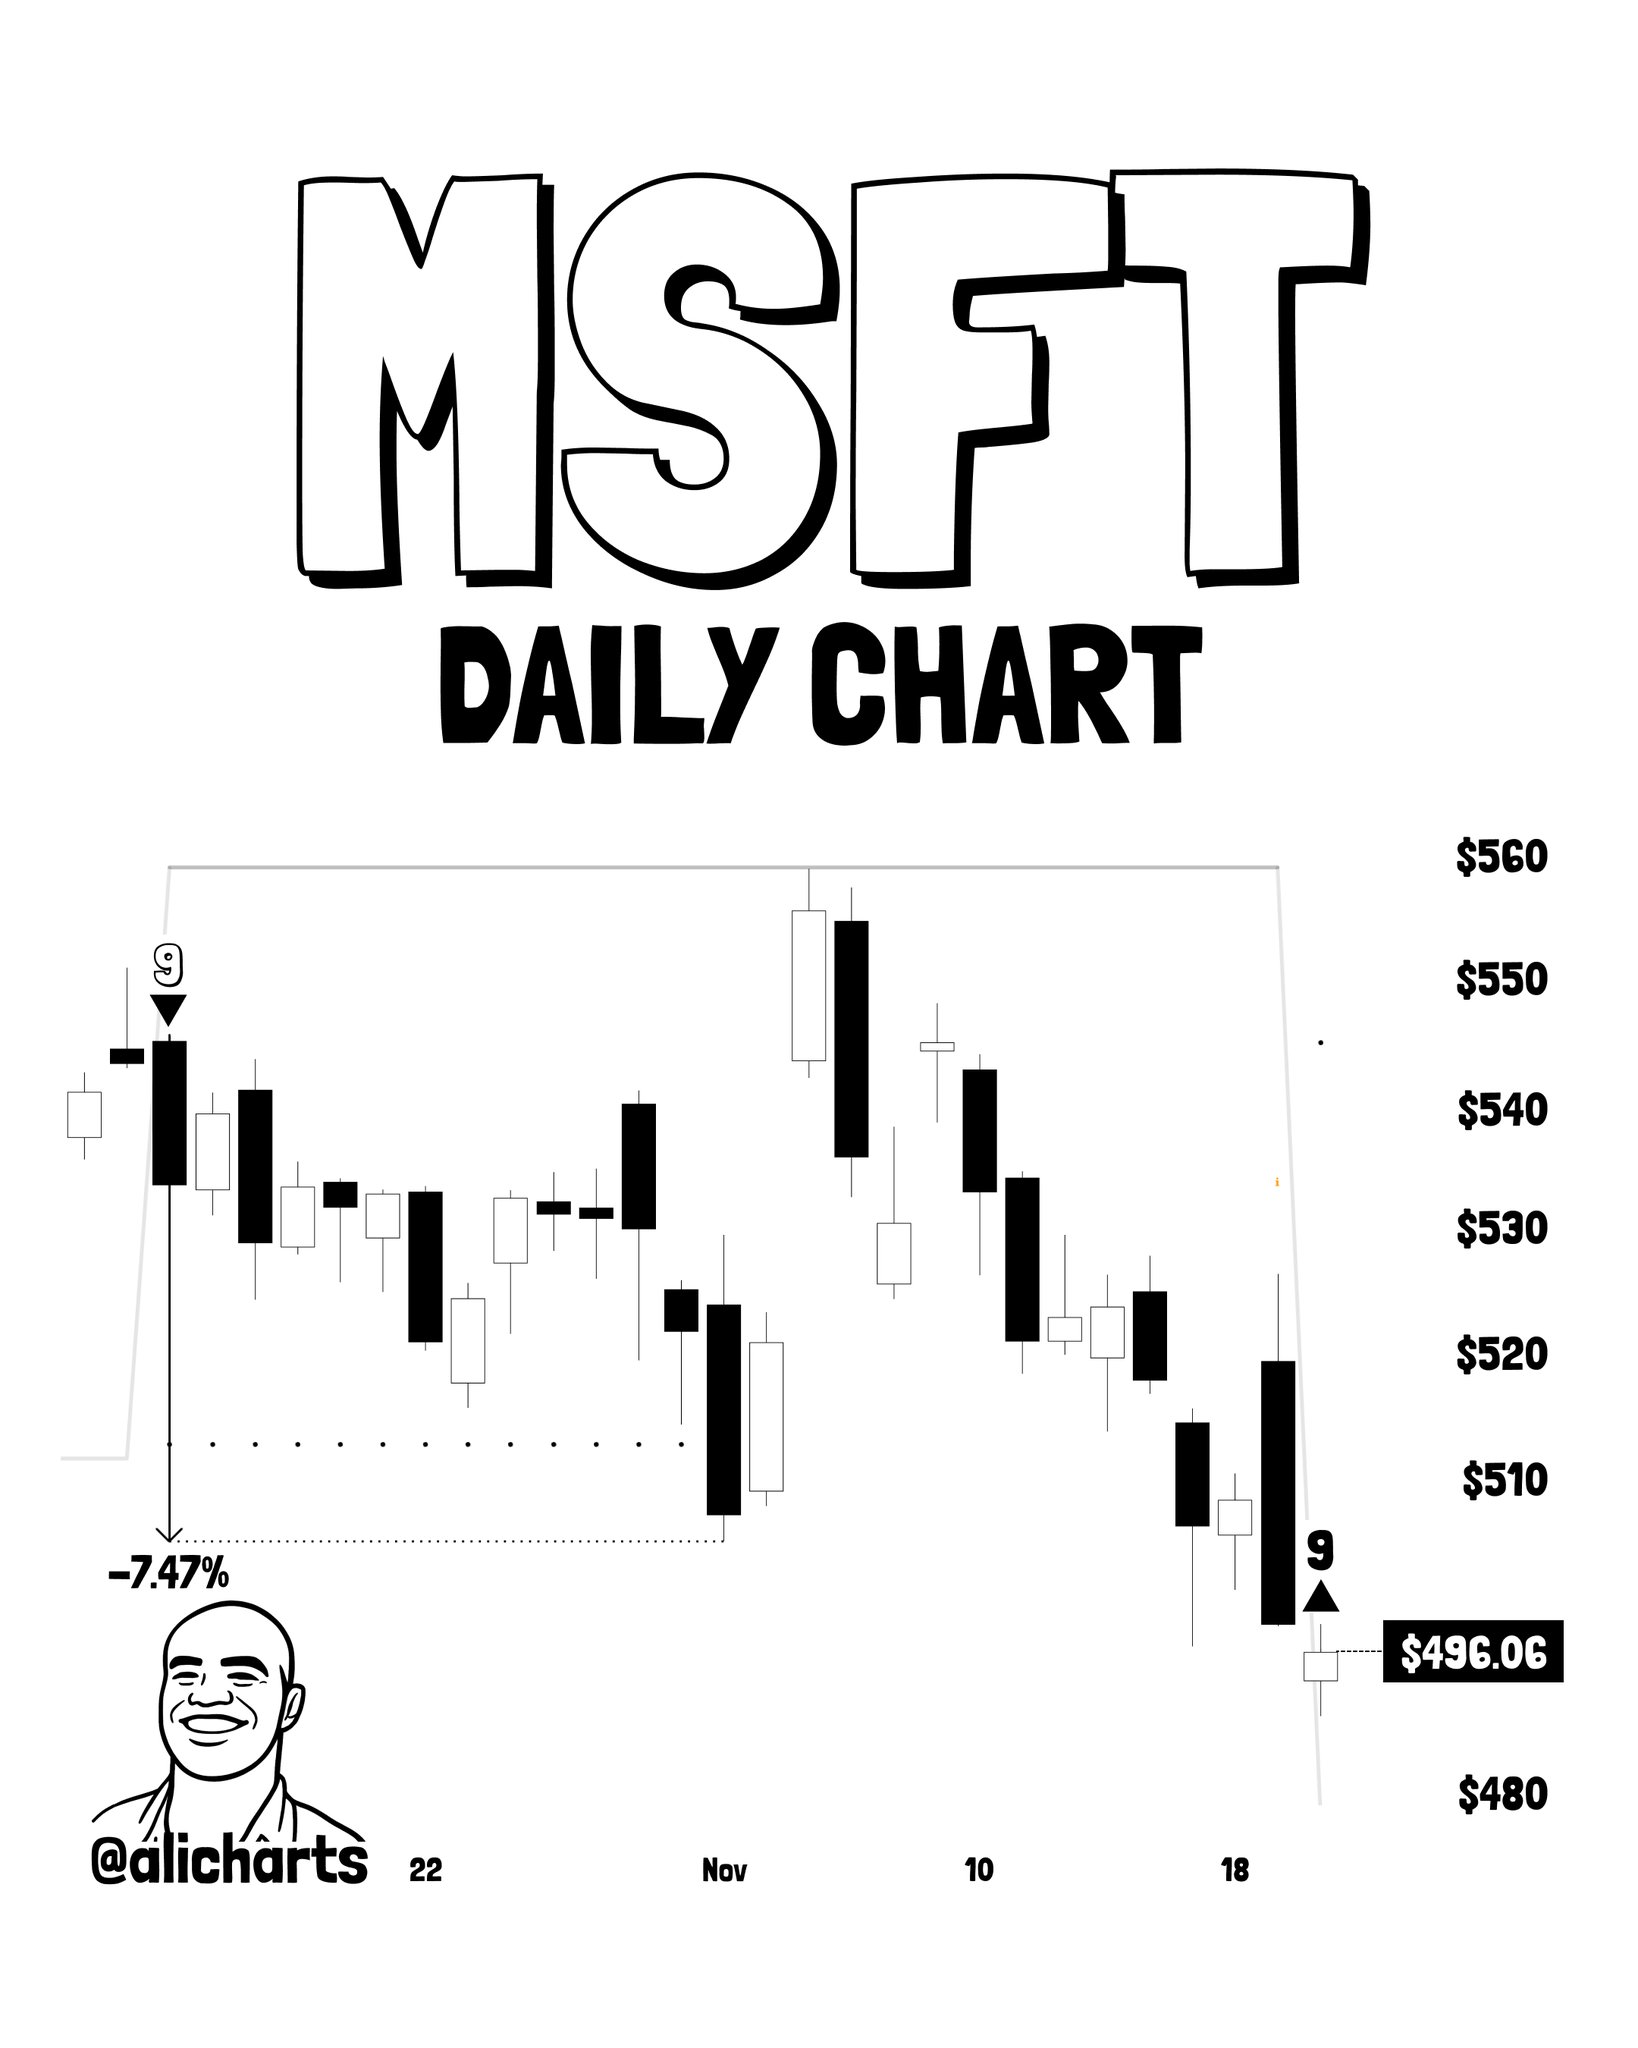
Microsoft’s daily chart shows a TD Sequential “9” buy signal printing at current lows near $496.06. The setup carries additional credibility because the same indicator’s prior sell signal — also a “9” count — directly preceded a 7.47% correction, the decline that brought price down to its current level. That completed move is annotated directly on the chart. The sell signal worked. Now its mirror image has appeared at the bottom of that same decline.
According to the analyst, if $480 holds as support, the rebound target is $510 to $520. The price is currently sitting at a dotted horizontal line drawn from the prior low — a visual reference point, not a confirmed level, as no breakout has yet occurred. The pattern is still forming: $480 is the line that separates a viable bounce setup from a deeper breakdown. The analyst has not stated a downside target beyond $480.
The TD Sequential works by counting nine consecutive daily closes in one direction — identifying momentum exhaustion rather than a price-based support or resistance level. A “9” count does not predict a reversal; it identifies a zone where the existing trend has statistically run its course and where counter-trend setups have historically appeared. The critical variable is always the confirmation candle that follows.
Signal 2 — CRISPR Therapeutics (CRSP): $36 Support, $46 Target
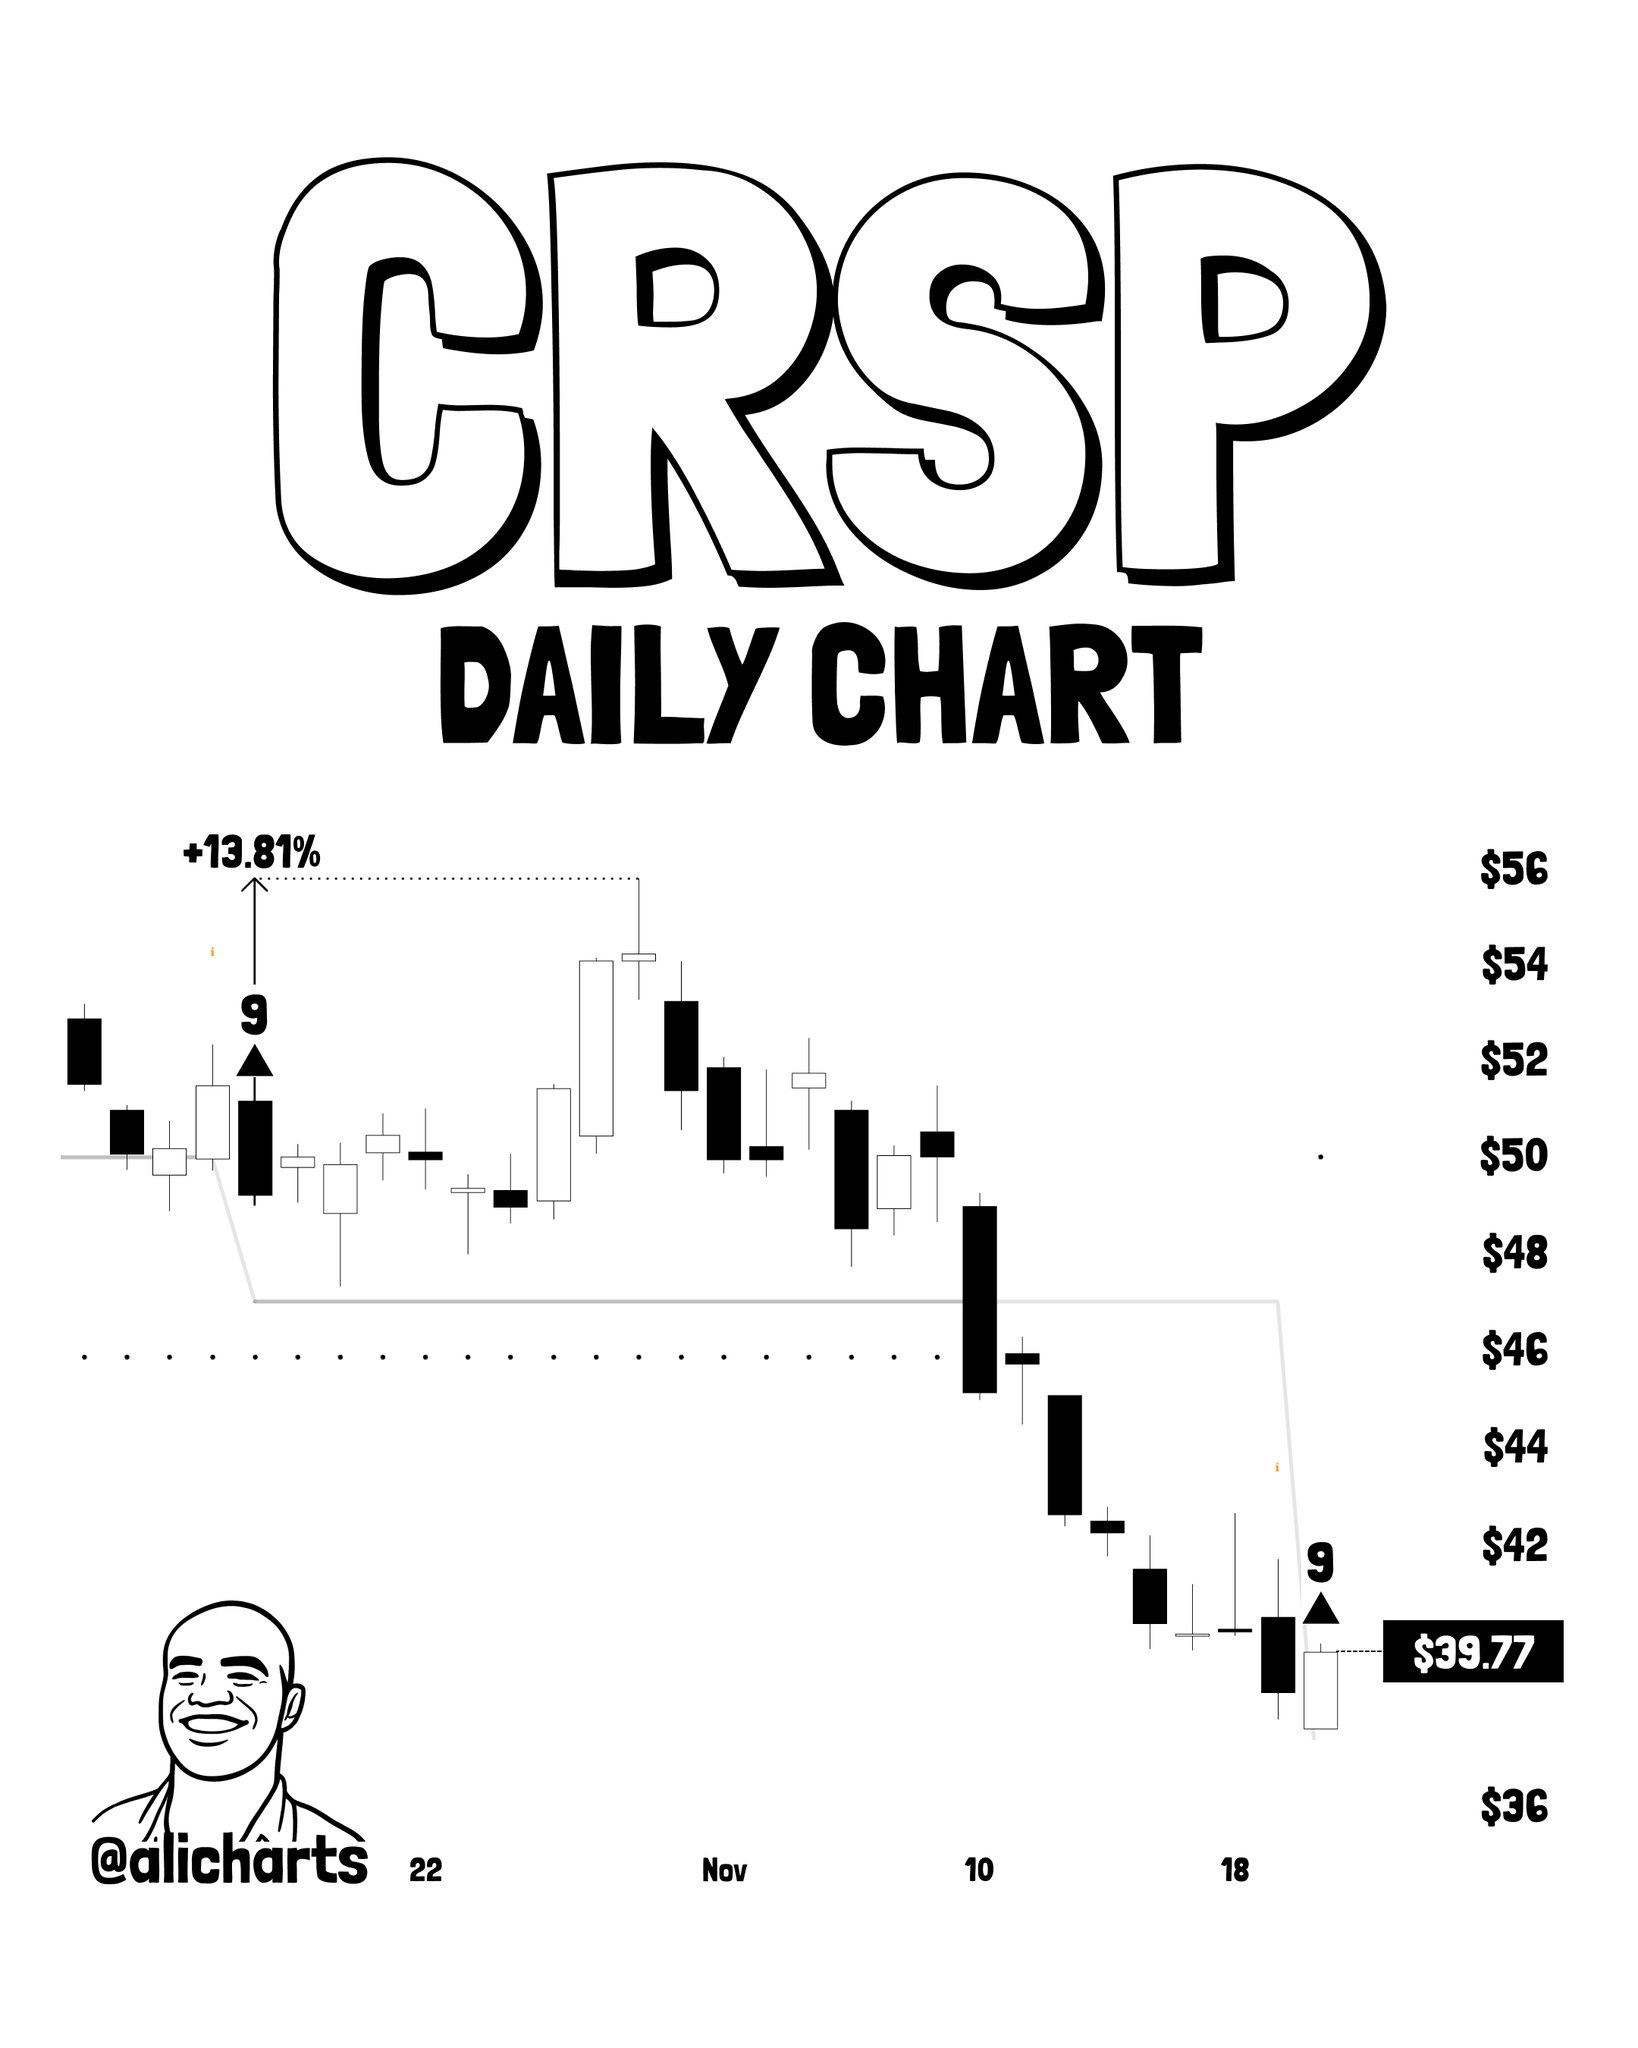
CRSP presents the most recent precedent of the three. Approximately one month ago, the same TD Sequential “9” buy signal appeared on its daily chart — and the subsequent rally reached 13.81%, a move annotated directly on the chart as a completed historical event. That prior signal-to-rally sequence is the basis for the analyst’s current positioning interest.
The current signal has printed at $39.77, with the analyst watching $36 as the critical support floor. The rebound target, if that level holds, is $46 — roughly matching the dotted horizontal line visible on the chart in that price zone. Notably, the chart analysis confirms a breakdown: price is currently below both the dotted horizontal reference line near $46 and the descending curved trendline. This means CRSP is in a structurally weaker position than MSFT or NFLX — the signal is present, but price has not yet demonstrated any stabilization. The $36 support is the level that must hold for the thesis to remain intact.
Signal 3 — Netflix (NFLX): $56 Support, $64 Target
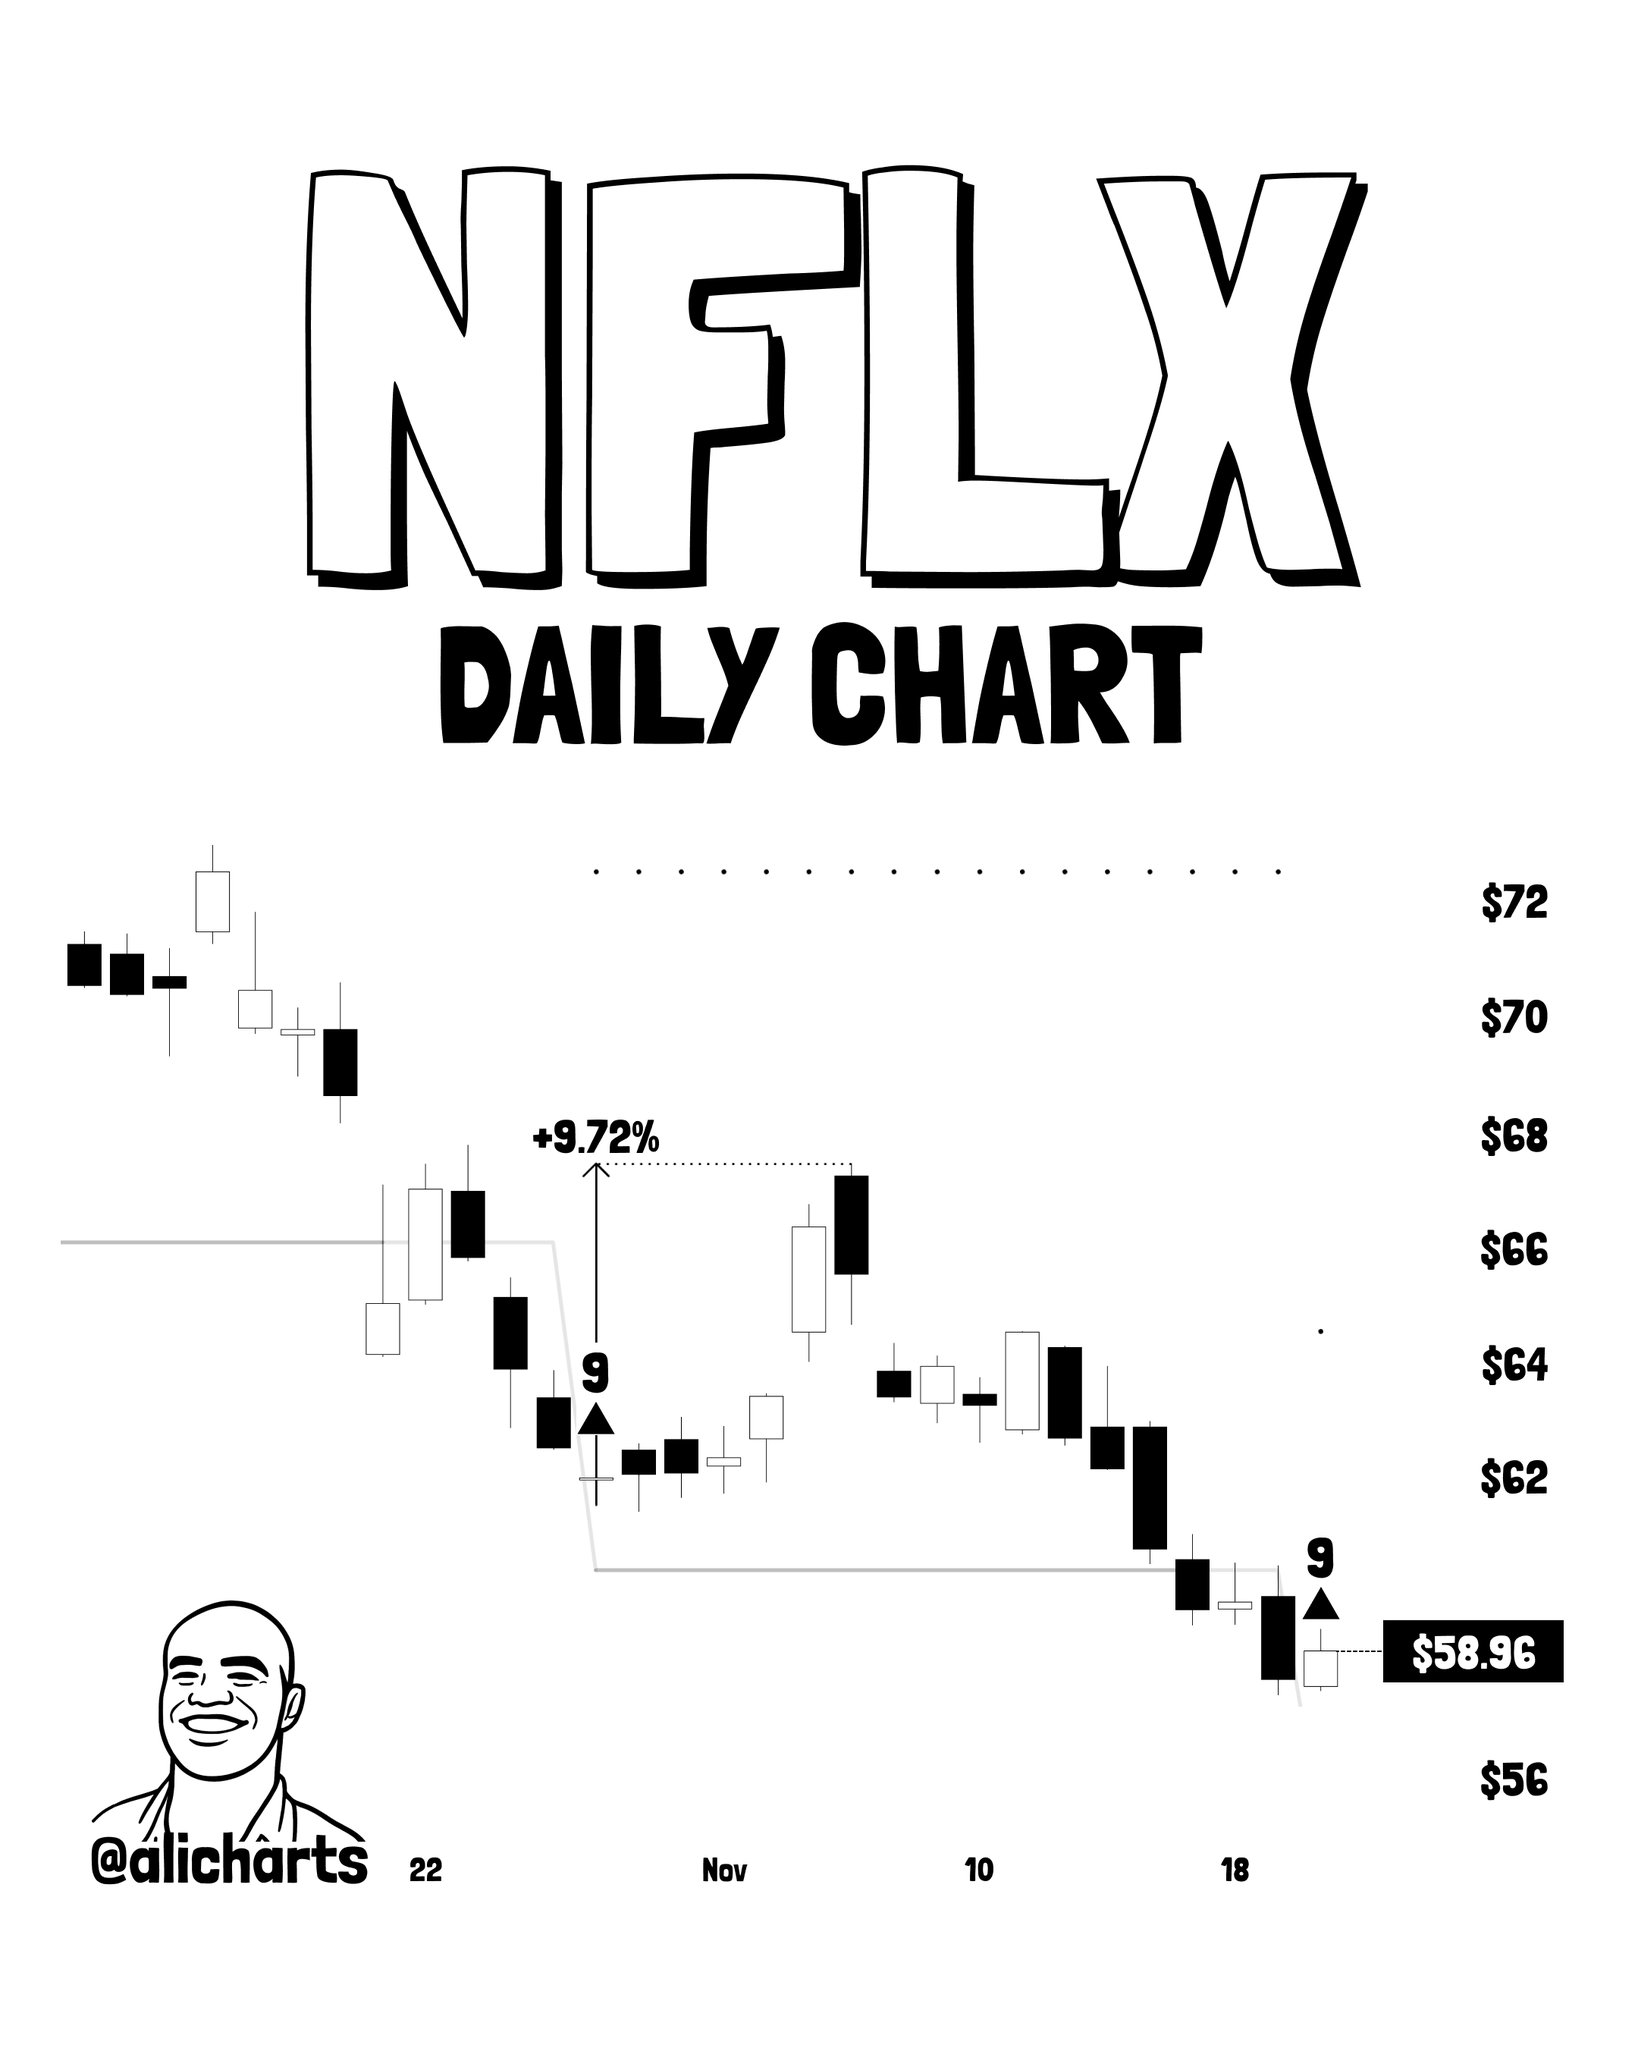
Netflix rounds out the three-stock setup with a TD Sequential “9” buy signal appearing at $58.96, sitting directly on the horizontal support line that connects the lows from the prior signal zone. The earlier “9” count on NFLX produced a 9.72% rally — that annotation is printed on the left side of the chart as a completed move, not a projection.
The analyst’s current watch level is $56 as support, with $64 as the rebound target if that floor holds. Price remains below the prior resistance and dotted reference line near $68, confirming the pattern is still forming — no breakout has occurred. The $56 level is approximately 1.6% below the current price box of $58.96, making it a relatively close invalidation threshold. A daily close below $56 would negate the setup entirely.
The Common Thread — What Three Simultaneous Signals Mean
Three TD Sequential “9” buy signals firing across three unrelated equities on the same day is not coincidence — it reflects a synchronized market drawdown that has pushed multiple names into momentum exhaustion simultaneously. The analyst’s framing is explicit: the market has reached oversold levels, and these signals are the quantitative expression of that condition.
The important caveat — stated clearly in the thread — is that all three setups need price confirmation. The TD Sequential identifies exhaustion. It does not confirm that buyers have stepped in. That confirmation comes only when price holds the stated support levels ($480 for MSFT, $36 for CRSP, $56 for NFLX) and begins to close higher on subsequent daily candles.
Readers tracking altcoin market structure alongside these equity signals may find context in recent analyses of TOTAL2 losing June lows and TOTAL3 breaking monthly support — both pointing to broad risk-off conditions that align with the oversold equity readings flagged here.
Prior Signal Track Record — What the Data Shows
| Stock | Prior Signal Type | Prior Move Produced | Current Signal | Support Level | Target |
|---|---|---|---|---|---|
| MSFT | TD Seq “9” Sell | −7.47% correction | TD Seq “9” Buy at $496.06 | $480 | $510–$520 |
| CRSP | TD Seq “9” Buy (~1 month ago) | +13.81% rally | TD Seq “9” Buy at $39.77 | $36 | $46 |
| NFLX | TD Seq “9” Buy | +9.72% rally | TD Seq “9” Buy at $58.96 | $56 | $64 |
Source: @alicharts (X), November 22, 2026
Across all three, prior signals produced real, measurable moves. The sell signal on MSFT worked with precision. The two prior buy signals on CRSP and NFLX both resulted in rallies in the 10%–14% range. The analyst is not identifying a theoretical setup — the indicator has demonstrated consistency on these specific names.
What it doesn’t say: none of these signals guarantees a bottom. The TD Sequential has no directional predictive power beyond identifying exhaustion. A “9” count at a low can be followed by further selling if the support level fails. The analyst’s stated supports are the invalidation levels — below them, the setup is void.
What to watch for continuation: daily closes above the first resistance level following the support hold. For MSFT, that means a sustained move back above $510. For CRSP, reclaiming the $46 horizontal reference. For NFLX, clearing the mid-$60s range.
The simultaneous appearance of these signals in a broad oversold market environment is the kind of setup where the risk-reward is defined and the confirmation criteria are specific. Three stocks, three signals, three support levels. The market will answer each question independently — and the TD Sequential’s prior track record on these names suggests the answers are worth watching closely.
Source: x.comFrequently Asked Questions
What does a TD Sequential ‘9’ buy signal mean for a stock?
What support levels must MSFT, CRSP, and NFLX hold for the buy signals to remain valid?
How reliable has the TD Sequential been on these three stocks recently?
What are the upside targets if the support levels hold?
Source: Ali Charts · Published by CoinsProbe Markets Desk
The opinions and market insights shared on CoinsProbe represent the views of individual authors based on prevailing market conditions at the time of publication. Cryptocurrency investments carry significant risk and volatility. Readers are encouraged to conduct their own research and seek professional financial advice before making investment decisions. CoinsProbe and its contributors do not accept responsibility for financial losses or decisions made based on published content.
CoinsProbe may publish sponsored articles, affiliate links, or promotional collaborations. All sponsored material is clearly labeled to maintain transparency with our audience. Our editorial decisions remain fully independent, and advertising partnerships do not influence reviews, rankings, or published opinions.
Since 2023, CoinsProbe has delivered reliable insights on cryptocurrency, blockchain, and digital assets. Our content is created by experienced researchers and analysts who follow strict editorial standards focused on accuracy, transparency, and credibility. Every article is carefully reviewed and verified using trusted sources and current market data. We provide unbiased analysis and timely updates covering everything from emerging crypto projects to major industry developments.