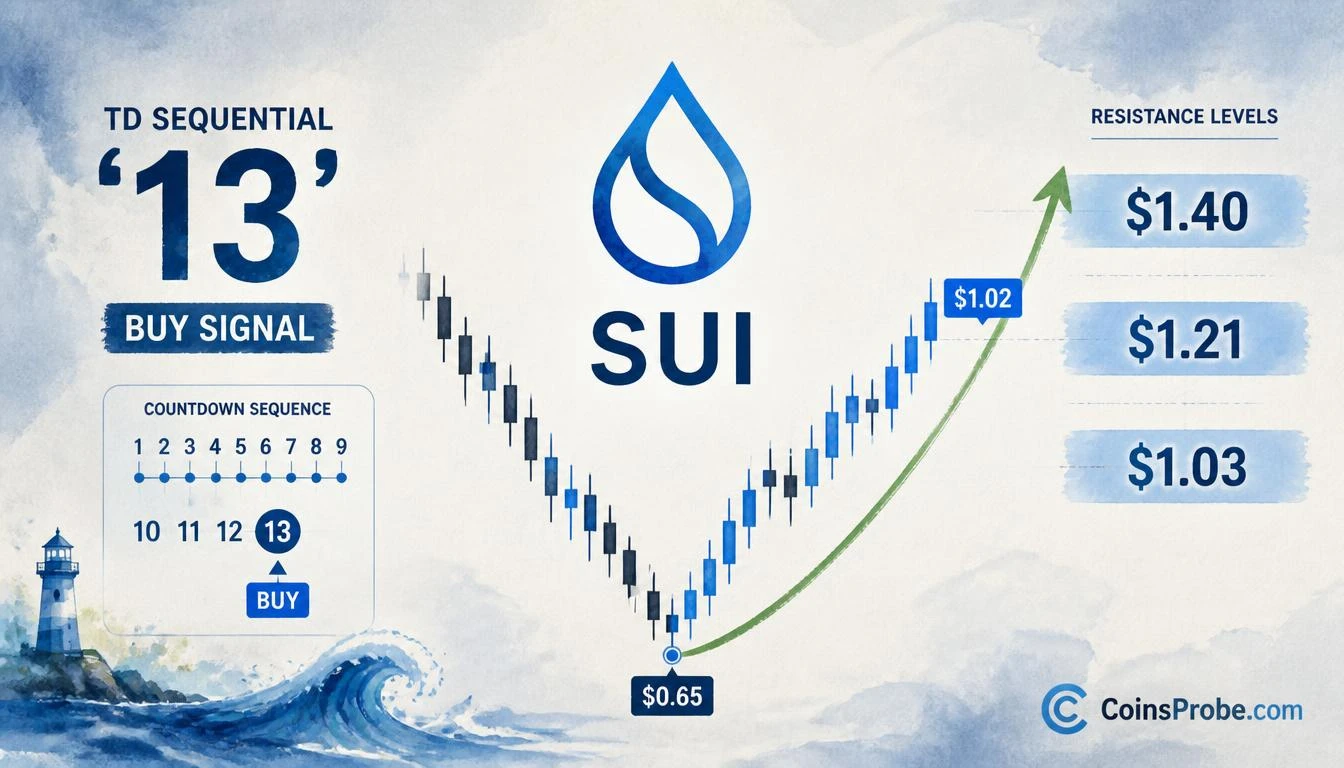

- SUI is trading at $1.02 — up 23.32% in 24 hours — after a TD Sequential '13' buy signal printed at $0.65 in late July
- Analyst @alicharts confirms SUI has already rallied 45% from the signal low, validating the weekly exhaustion indicator
- $1.03 is the immediate resistance — a weekly close above opens $1.21 then $1.40; loss of $0.84 risks a retest of $0.65
SUI is trading at approximately $1.02 — up 23.32% in the last 24 hours — with a market capitalization of $4.16 billion. The signal that triggered this move was not a rumor, not a listing, and not a narrative shift: it was a Tom DeMark Sequential “13” buy signal printed on the weekly chart in late July at a price low of approximately $0.65. That signal has already produced a 45% rally — and the structure says the move is not finished.
Analyst Ali Martinez (@alicharts) flagged the signal explicitly, writing: “$SUI turned bullish on the weekly chart when the Tom DeMark Sequential printed a 13 buy signal in late July. Since then, SUI has rallied 45%, showing that the initial reversal signal has already gained traction.”
is a post-facto validation of a real-time call — the signal printed, the rally followed, and the data now confirms alignment.
What the TD Sequential “13” Actually Measures
The TD Sequential, developed by Tom DeMark, is a momentum exhaustion indicator — not a price-level indicator and not a trend-following tool. It counts a specific sequence of price bars to identify when a directional move has run out of fuel.
The “13” countdown is the second and more significant phase. It requires:
- A completed “9” setup (nine consecutive closes lower than four bars prior) — identifying initial momentum exhaustion
- A 13-bar countdown sequence that confirms the exhaustion is deep, not superficial
When the countdown reaches 13, the indicator is signaling that sellers have been active for an extended, measurable period and that the downward pressure is statistically overextended. The “13” is rarer than the “9” and historically produces larger reversals. On the weekly chart — where each bar represents seven days of market activity — a completed 13 countdown represents months of directional exhaustion being resolved.
The critical distinction: the TD Sequential is a non-directional exhaustion indicator. It does not guarantee the direction of the next move. What it does is identify that the current direction has reached a statistically extreme state. On SUI’s weekly chart, that extreme state resolved bullishly — and the 45% rally is the confirmation that the market agreed with the signal.
The Signal in Context — Weekly Chart at $0.65
The TD Sequential “13” printed at SUI’s late July low of approximately $0.65. This was the trough of a multi-month decline from May highs near $1.40. The weekly chart shared by @alicharts shows the exhaustion signal printing precisely at the bottom of that structure — not mid-trend, not at resistance, but at the terminal low of the downtrend.
From that $0.65 low, SUI has recovered to $1.02 at the time of writing. That is a 56.9% recovery from the signal low. The analyst’s stated 45% figure references the rally from signal to prior recent levels, confirming that the reversal has already gained measurable traction rather than remaining speculative.
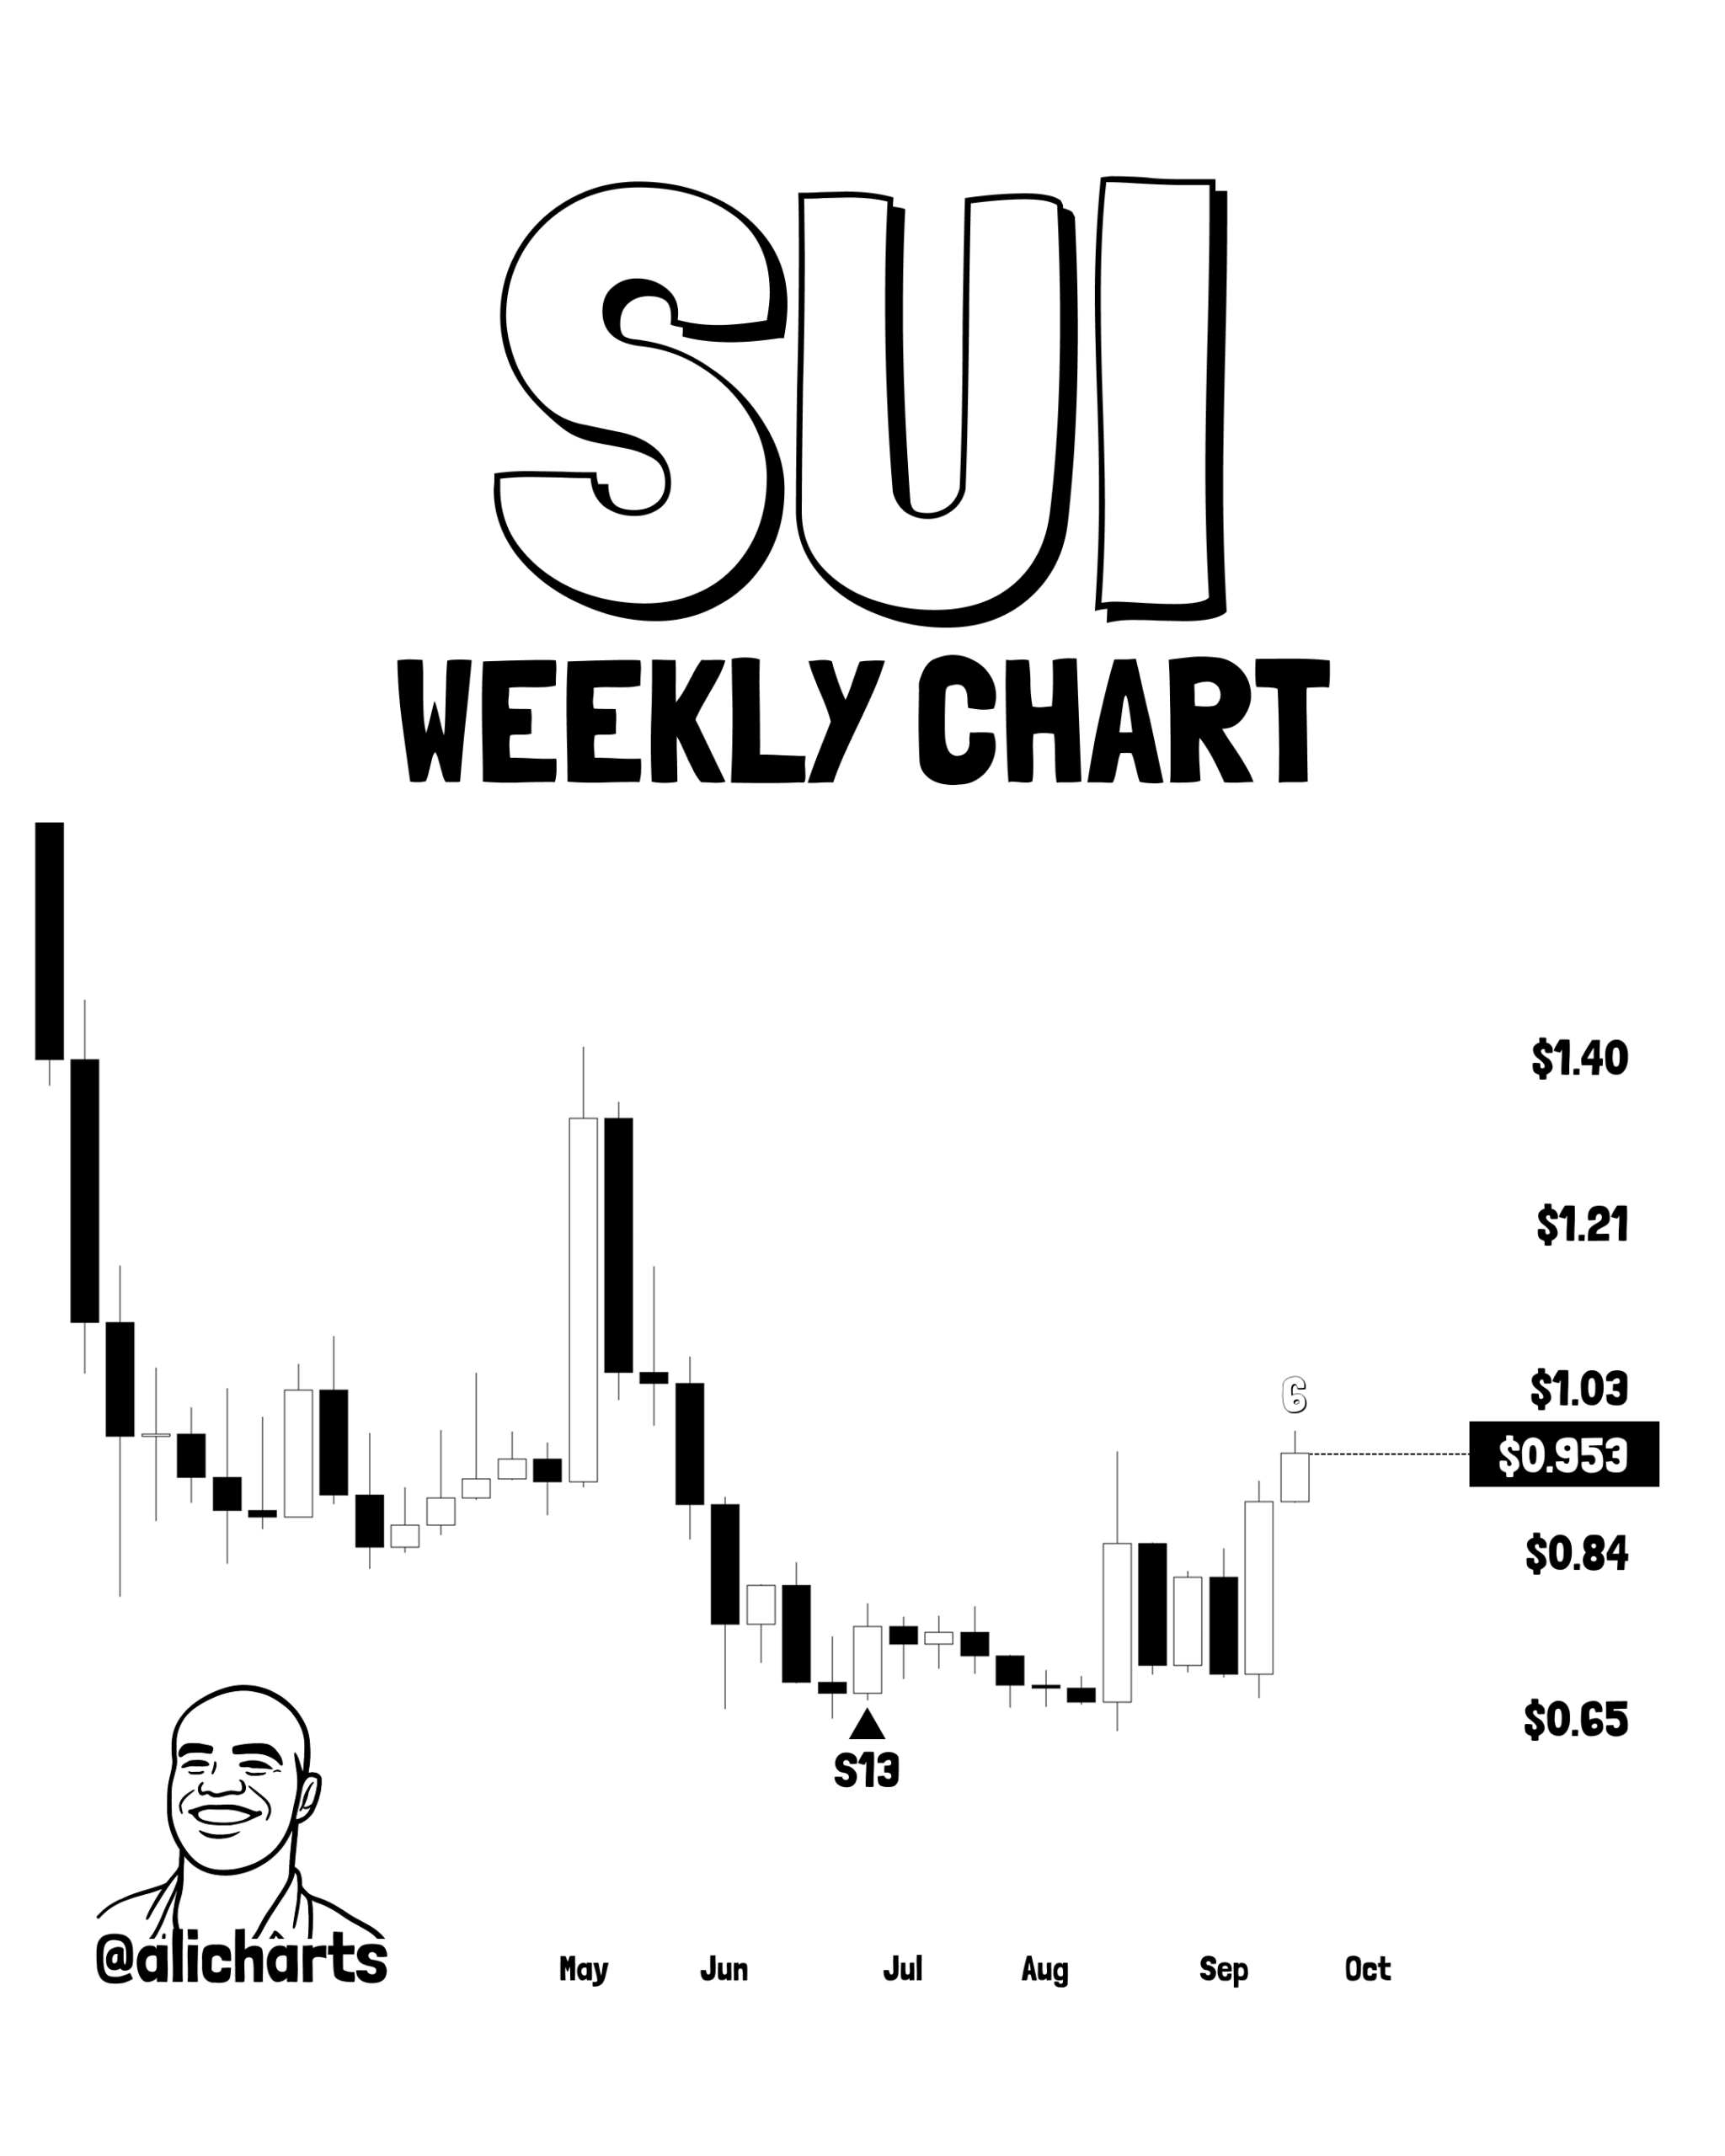
The weekly chart identifies three key resistance levels ahead: $1.03, $1.21, and $1.40. Support below sits at $0.84 and then $0.65 — the signal low itself. The immediate level in focus is $1.03, which the chart marks with a dotted target line.
Key Levels — The Structure From Signal to Target
| Level | Role | Distance From $1.02 |
|---|---|---|
| $0.65 | Signal low / TD-13 print | −36.3% (invalidation) |
| $0.84 | Support / prior structure | −17.6% |
| $1.02 | Current price | — |
| $1.03 | Immediate resistance / target | +1.0% |
| $1.21 | Secondary resistance | +18.6% |
| $1.40 | Prior May high / full target | +37.3% |
Source: @alicharts weekly SUI/USD chart analysis
SUI has already moved through most of the recovery structure. The $1.03 level is the first meaningful test — a zone that previously acted as support before the May-to-July decline. A weekly close above $1.03 opens the path to $1.21 and, beyond that, to $1.40 — the level from which the original decline began.
What the Signal Says — And What It Doesn’t
What it says: The TD Sequential “13” on SUI’s weekly chart identified a multi-month exhaustion of selling pressure at $0.65. The subsequent 45%+ rally confirms the signal was valid, not a false positive. The reversal has structural backing, not speculative momentum alone.
What it doesn’t say: The TD Sequential does not specify how far the subsequent rally extends or at what pace. It identifies exhaustion, not destination. The 45% already delivered is confirmed; the additional move to $1.21 or $1.40 depends on whether buyers sustain pressure through $1.03 resistance.
What to watch for continuation: A sustained weekly close above $1.03. Not an intraday spike. Not a daily close. A weekly closing price above $1.03 on the SUI/USD chart confirms that the first resistance of the post-signal structure has been cleared and that $1.21 is the next logical destination.
For broader context on SUI’s technical setup, the SUI SuperTrend flip to buy corroborates the macro directional shift identified by the TD Sequential — two independent indicators pointing to the same structural change. The SUI Parabolic SAR flip bullish similarly flagged $0.98 as the breakout level, with $1.40 as the target — aligning precisely with the TD Sequential’s upper resistance zone. Additionally, SUI’s weekly parallel channel has consistently identified $1.03 and $1.40 as the key zones — reinforcing the critical nature of the current test.
Bull and Bear Scenarios
Bullish Scenario — Weekly Close Above $1.03
A confirmed weekly close above $1.03 clears the first post-signal resistance and opens the path toward $1.21 — an 18.6% move from current levels. Beyond $1.21, the full measured target from the TD-13 signal returns to the May structural high at $1.40, representing a 37.3% extension from the current price of $1.02. The 45% already delivered demonstrates the signal’s validity; continuation to $1.40 would represent a full recovery of the May-to-July decline.
Bearish Scenario — Loss of $0.84
Loss of the $0.84 support level on a weekly closing basis would damage the post-signal recovery structure. A break below $0.84 returns SUI to the mid-range of the prior downtrend and opens a retest of the $0.65 signal low. A weekly close below $0.65 would technically invalidate the TD Sequential reversal setup and suggest the exhaustion signal produced only a temporary bounce, not a structural trend change.
Bottom Line
SUI’s Tom DeMark Sequential “13” buy signal printed on the weekly chart at $0.65 in late July — the terminal low of a multi-month decline from $1.40. The signal has already delivered: a 45% rally confirmed by @alicharts and validated by market structure. At $1.02, SUI is pressing directly against the $1.03 resistance zone, the first critical test of whether the post-signal recovery extends toward $1.21 and ultimately $1.40, or stalls at the first structural hurdle. Three independent technical signals — the TD Sequential, the SuperTrend flip, and the Parabolic SAR flip — all point to the same directional conclusion. The next session’s weekly candle behavior at $1.03 is the single most important data point for this trade. Watch $1.03 as the line between a recovering structure and a confirmed bullish continuation toward $1.40.
Source: x.com
Frequently Asked Questions
What is the TD Sequential ’13’ buy signal on SUI’s weekly chart?
How much has SUI rallied since the TD Sequential buy signal?
What is the key resistance level SUI must break to continue higher?
What level would invalidate SUI’s bullish reversal signal?
Source: Ali Charts · Published by CoinsProbe Markets Desk
The opinions and market insights shared on CoinsProbe represent the views of individual authors based on prevailing market conditions at the time of publication. Cryptocurrency investments carry significant risk and volatility. Readers are encouraged to conduct their own research and seek professional financial advice before making investment decisions. CoinsProbe and its contributors do not accept responsibility for financial losses or decisions made based on published content.
CoinsProbe may publish sponsored articles, affiliate links, or promotional collaborations. All sponsored material is clearly labeled to maintain transparency with our audience. Our editorial decisions remain fully independent, and advertising partnerships do not influence reviews, rankings, or published opinions.
Since 2023, CoinsProbe has delivered reliable insights on cryptocurrency, blockchain, and digital assets. Our content is created by experienced researchers and analysts who follow strict editorial standards focused on accuracy, transparency, and credibility. Every article is carefully reviewed and verified using trusted sources and current market data. We provide unbiased analysis and timely updates covering everything from emerging crypto projects to major industry developments.