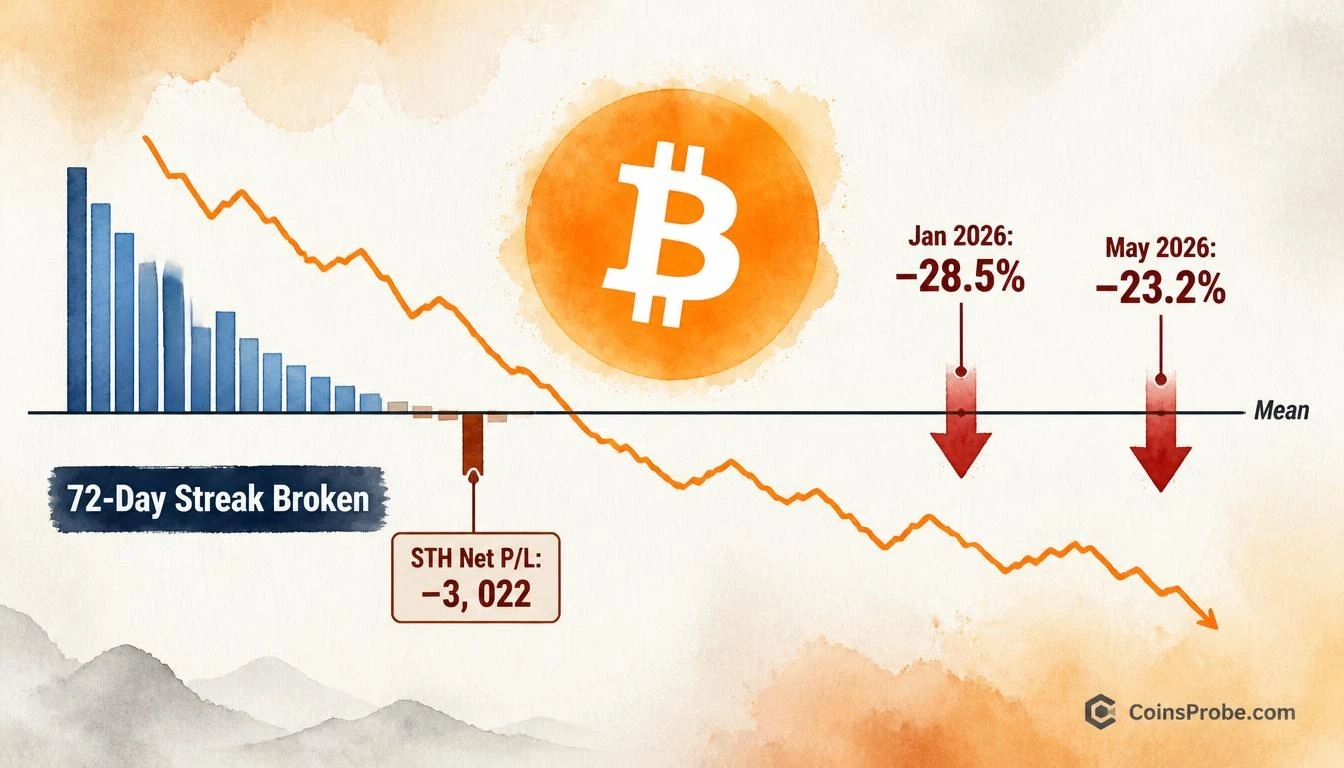

- Bitcoin is trading at $77,331 (−5.40% 24h) as STH Net P/L to Exchanges 7DMA prints −3,022 — first negative reading in 72 days
- The last two negative flips after extended profit runs (Jan at $89K, May at $76.9K) preceded 28.5% and 23.2% drawdowns per CryptoQuant
- STH metric peaked at +21,182 on Oct 24 and collapsed to −3,022 by Oct 30 — a 24,000-unit swing in under a week
- Current reading of −3,022 remains far above prior troughs of −60,768 (Jan) and −41,364 (May), suggesting the capitulation may be early-stage
Bitcoin is trading at $77,331 — down 5.40% in the past 24 hours and off sharply from recent highs — as a closely tracked on-chain metric just flashed its most bearish reading in more than two months. Short-term holders have sent coins to exchanges at a loss for the first time in 72 days, confirming that the profit-taking phase has definitively ended and that recent buyers are now capitulating into weakness.
The signal comes directly from an analyst tracked by CryptoQuant, who published a QuickTake note stating: “The profit-taking phase is over. Recent buyers are underwater and selling into weakness.” The report draws a direct parallel to two prior instances in 2026 where the same metric flipped negative after an extended profit-run — both of which preceded double-digit price drawdowns.
The Signal — STH Net P/L to Exchanges Turns Negative
The Short-Term Holder (STH) Net Profit/Loss to Exchanges metric tracks whether coins sent to exchanges by holders who acquired Bitcoin within the last 155 days are arriving at a profit or a loss. A positive reading means recent buyers are moving coins to exchanges while still in profit — historically associated with distribution and selling pressure near local tops. A negative reading means those same recent buyers are sending coins to exchanges while underwater — a sign of panic selling, capitulation, and forced exit from losing positions.
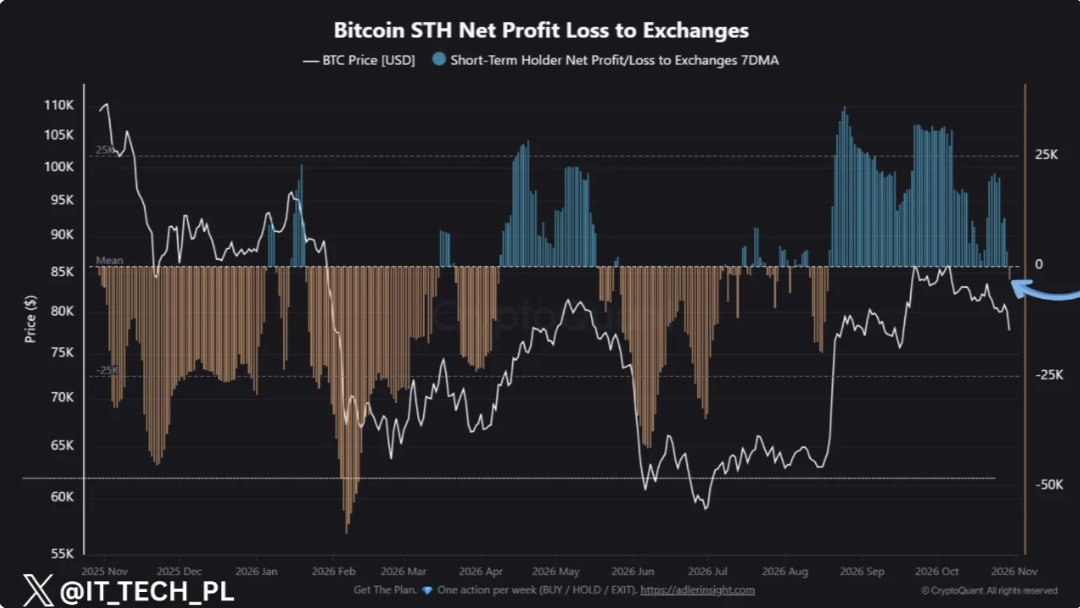
According to the CryptoQuant analysis, the 7-day moving average of this metric just printed at −3,022, collapsing from +21,182 on October 24 — a swing of more than 24,000 units in under a week. This is the first negative print since August 18, ending a 72-day streak during which short-term holders were consistently realizing profits on their exchange deposits. Over the same nine-day window, Bitcoin’s price fell from $83,600 to $77,800.
Historical Precedents — The Last Two Flips Led to 28.5% and 23.2% Drops
This is not the first time in 2026 that the STH Net P/L metric has flipped negative after an extended profit-taking phase. The CryptoQuant note identifies two directly comparable prior instances:
| Flip Date | BTC Price at Flip | Trough Reading | Price Decline Before Bottom |
|---|---|---|---|
| January 2026 | $89,000 | −60,768 | −28.5% |
| May 2026 | $76,900 | −41,364 | −23.2% |
| October 30, 2026 | ~$83,600 (at flip) | −3,022 (7DMA, early stage) | TBD |
Source: CryptoQuant QuickTake — IT Tech, October 30, 2026
In January, the metric bottomed at −60,768 and Bitcoin did not find its floor until it had shed 28.5% from the flip level. In May, the trough was −41,364 with a 23.2% peak-to-trough decline. The current reading of −3,022 is early-stage by both comparisons — suggesting that if historical patterns hold, the metric has considerably further to fall before the selling exhausts itself. The analyst’s note closes with a direct warning: “If recent buyers keep dumping at a loss, I expect the same outcome.”
For context on Bitcoin’s broader technical picture at this level, see our earlier report on Bitcoin hitting the EMA200 — a target that was flagged weeks in advance.
Why This Metric Matters More Than Standard Price Indicators
Standard price oscillators like RSI or MACD measure momentum within the price series itself. The STH Net P/L to Exchanges metric measures something structurally different: the behavioral state of the most recent cohort of Bitcoin buyers. When this group shifts from selling into strength (profit) to selling into weakness (loss), it confirms a regime change — not just a pullback. The market’s marginal sellers have stopped taking profits and started cutting losses. That distinction matters because loss-driven selling tends to be less price-sensitive and more persistent than profit-taking, which naturally slows as prices fall.
The chart shared by CryptoQuant illustrates this clearly. Brown bars — representing net loss deposits — dominate the mid-cycle period shown. A sustained sequence of blue bars (net profit deposits) preceded the current breakdown. The rightmost bar has just flipped brown, with Bitcoin’s price curve turning downward and crossing below the Mean line on the chart. That crossing below the Mean is a visual confirmation that the current reading is not noise — it is a structural shift in short-term holder behavior.
This dynamic is also relevant for Ethereum holders navigating a similar environment — our analysis of ETH entering a potential dip zone after its 200-week MA break provides useful parallel context.
What the Data Says — and What It Doesn’t
What it confirms: Short-term holders — defined as those who acquired BTC within the last 155 days — are now net sellers at a loss. The 72-day profit streak is over. The metric’s 7DMA has crossed into negative territory at −3,022, matching the behavioral setup seen in January and May 2026 before both major drawdowns.
What it does not confirm: The metric does not specify a price floor, a percentage decline target, or a timeline. The January flip from $89,000 produced a 28.5% drawdown; the May flip from $76,900 produced 23.2%. The current flip at approximately $83,600 has already seen Bitcoin drop to $77,331 — a 7.5% decline from the flip level. Whether the remaining downside mirrors January (−28.5% total) or May (−23.2% total) depends on how deeply the metric continues to deteriorate.
The metric to watch: The STH Net P/L to Exchanges 7DMA. In January, it troughed at −60,768. In May, it troughed at −41,364. The current reading of −3,022 has not yet approached either historical trough. CryptoQuant’s platform updates this in real time.
What Happens Next — The Two Scenarios
Bearish Scenario — Metric Deepens Toward Prior Troughs
If the STH Net P/L 7DMA continues deteriorating toward the −41,364 to −60,768 range seen in prior episodes, the historical precedent suggests Bitcoin has not yet found a durable bottom. The January 2026 analog — a flip at $89,000 followed by a 28.5% decline — would imply a trough in the low-to-mid $60,000s from the $83,600 flip level. That scenario requires sustained loss-driven selling by short-term holders over multiple weeks.
Bullish Scenario — Metric Stabilizes and Reverses Quickly
If the −3,022 reading proves shallow and the metric quickly reclaims positive territory, it would indicate that short-term holders absorbed the selling pressure rapidly and that the loss event was a temporary flush rather than the beginning of a prolonged capitulation. In both January and May, the metric spent multiple weeks in negative territory before recovering — a quick reversal here would be structurally different from those prior episodes and would require on-chain confirmation.
Bitcoin’s on-chain structure is evolving rapidly. Tools like Alphractal’s Alpha Terminal aggregate metrics of this type in real time for traders monitoring regime shifts.
The on-chain evidence is unambiguous: Bitcoin’s short-term holder cohort has shifted from profit distribution to loss-driven capitulation, ending a 72-day streak on October 30, 2026. The STH Net P/L to Exchanges 7DMA has printed −3,022 — its first negative reading since August 18 — after peaking at +21,182 just six days earlier. The last two instances where this metric flipped negative after an extended profit run produced drawdowns of 28.5% and 23.2% respectively before Bitcoin bottomed. The current reading is early-stage by both historical comparisons.
Watch the STH Net P/L 7DMA: if it deteriorates toward −40,000 to −60,000, the prior playbook remains intact. If it stabilizes and reverses within days, this episode is structurally different — and that divergence will show on CryptoQuant’s platform before it shows in price.
Frequently Asked Questions
What does it mean when Bitcoin short-term holders send coins to exchanges at a loss?
How severe were the drawdowns the last two times this signal appeared in 2026?
Is the current STH Net P/L reading as severe as the January and May 2026 instances?
What specific level on the STH Net P/L metric would indicate the selling has exhausted itself?
Source: CryptoQuant · Published by CoinsProbe Markets Desk
The opinions and market insights shared on CoinsProbe represent the views of individual authors based on prevailing market conditions at the time of publication. Cryptocurrency investments carry significant risk and volatility. Readers are encouraged to conduct their own research and seek professional financial advice before making investment decisions. CoinsProbe and its contributors do not accept responsibility for financial losses or decisions made based on published content.
CoinsProbe may publish sponsored articles, affiliate links, or promotional collaborations. All sponsored material is clearly labeled to maintain transparency with our audience. Our editorial decisions remain fully independent, and advertising partnerships do not influence reviews, rankings, or published opinions.
Since 2023, CoinsProbe has delivered reliable insights on cryptocurrency, blockchain, and digital assets. Our content is created by experienced researchers and analysts who follow strict editorial standards focused on accuracy, transparency, and credibility. Every article is carefully reviewed and verified using trusted sources and current market data. We provide unbiased analysis and timely updates covering everything from emerging crypto projects to major industry developments.